INTRODUCTION
In most situations, the seed yield of oilseed rape (Brassica napus) responds strongly to nitrogen (N) fertilizer with yield increases of up to 2·5 t/ha (Berry & Spink Reference Berry and Spink2009). Application of increasing amounts of N fertilizer usually also results in an increase in seed protein content (Bilsborrow et al. Reference Bilsborrow, Evans and Zhao1993) but a decrease in oil concentration, which reflects the inverse relationship between seed oil concentration and protein content (Zhao et al. Reference Zhao, Evans, Bilsborrow and Syers1993; Hocking et al. Reference Hocking, Kirkegarrd, Angus, Gibson and Koetz1997a , Reference Hocking, Randall and Demarco b ). Oilseed rape requires a large amount of N, but has relatively low nitrogen use efficiency (NUE): for example, UK grown oilseed rape has been estimated to have an NUE of 10 kg seed dry matter (DM)/kg N, which is low compared with 21, 25 and 69 kg DM/kg N for spring malting barley, feed winter wheat and sugar beet, respectively (Sylvester-Bradley & Kindred Reference Sylvester-Bradley and Kindred2009). The lipid-rich seed of oilseed rape requires 45% more assimilate than the starch-rich seed of barley or wheat seed (Sinclair & de Wit Reference Sinclair and De Witt1975). Additionally, oilseed rape has a lower N harvest index (seed N: total crop N) than wheat and a greater concentration of N in the seed compared to wheat (Dreccer et al. Reference Dreccer, Schapendonk, Slafer and Rabbinge2000), which also contribute to the difference in NUE between the species. Nitrogen use efficiency has two components (Moll et al. Reference Moll, Kamprath and Jackson1982): N uptake efficiency (the efficiency by which soil N can be taken up by the plant) and N utilization efficiency (the seed dry weight per unit of N taken up by the plant) (Sattelmacher et al. Reference Sattelmacher, Horst and Becker1994). As reviewed by Rathke et al. (Reference Rathke, Behrens and Diepenbrock2006), in order to improve the N efficiency and seed yield of oilseed rape the use of integrated N-management strategies are required, including the choice of variety, form and timing of N application adapted to site conditions.
Winter oilseed rape has the ability to take up more N than winter cereals between sowing and spring (Barraclough Reference Barraclough1989); however, relatively little of this N ends up in the seed due to leaf losses over winter (Sieling et al. Reference Sieling, Schröder and Hanus1998). The majority of N fertilizer applied to oilseed rape is applied to the soil between early green bud (GS3,3) (Sylvester-Bradley & Makepeace Reference Sylvester-Bradley and Makepeace1984)) and yellow bud (GS3,7) and is taken up into the plant via its roots. The majority of the soil-applied N fertilizer is in the form of urea or ammonium nitrate and is most often a solid product. In some countries, such as Germany and the UK, a small proportion of N fertilizer is applied to the crop as urea solution during, or soon after, flowering and is taken up into the plant through its foliage. This type of N fertilization is often referred to as foliar-applied N. In the UK, it has been estimated that <10% of oilseed rape crops received foliar-applied N in 2011 (M. Tucker, 2012 personal communication). Foliar urea is also applied to wheat crops in order to increase grain protein content (Gooding & Davies Reference Gooding and Davies1992; Varga & Svečnjak Reference Varga and Svečnjak2006; Gooding et al. Reference Gooding, Gregory, Ford and Ruske2007). Varga & Svečnjak (Reference Varga and Svečnjak2006) found that late season foliar urea increased wheat yields, and in some cultivars increased protein content after low soil-applied N rates. Gooding et al. (Reference Gooding, Gregory, Ford and Ruske2007) found that 40 kg foliar N/ha applied to wheat at GS71 (Zadoks et al. Reference Zadoks, Chang and Konzak1974) increased grain protein concentration by 6 g/kg DM.
Very few studies have investigated the effects of foliar-applied N on oilseed rape. One study in the Czech Republic in 1999 observed no benefit from foliar N applied during stem extension (Yang-Yuen et al. Reference Yang-Yuen, Tlustos, Balik and Vanek1999). However, commercial trials in Europe have indicated large yield responses from applications soon after the end of flowering. Late N uptake has also been shown to be important for maximizing yield in the following studies: oilseed rape cultivars with higher N uptake efficiency have been characterized as maintaining N uptake during reproductive growth (Horst et al. Reference Horst, Behrens, Heuberger, Kamh, Reidenbach, Wiesler, Lynch, Schepers and Ünver2003). Berry et al. (Reference Berry, Spink, Foulkes and White2010) found that the amount of N taken up after flowering was the most important phase of N uptake for determining yield differences between varieties at low N rates. Research by Berry & Spink (Reference Berry and Spink2009) showed that crops with a high yield potential have a greater requirement for N than lower yielding crops. Roques et al. (Reference Roques, Clarke and Berry2011) found that an additional 30 kg N/ha of fertilizer was required for each 0·5 t/ha of yield above 3·5 t/ha, and that the additional N should be applied after the yellow bud stage (GS 3,7) to prevent the production of an over-large canopy at flowering, which would cause fewer seeds to be set and reduce yield potential (Berry & Spink Reference Berry and Spink2006). However, applying solid N fertilizer after yellow bud can present practical difficulties if the crop is too tall to allow even spreading, and dry soil conditions may delay N uptake. Foliar-applied N may therefore provide a more efficient source of N for late applications.
The yield of oilseed rape that is achieved on farms in the UK and several other countries has been shown to be largely static since the 1990s (Berry & Spink Reference Berry and Spink2006). A desk study on the yield plateau in wheat and oilseed rape has surmized that between 1984 and 1994 national oilseed rape yields fell by 0·04 t/ha/year, but since 2004 yields have been increasing by 0·075 t/ha/year (Knight et al. Reference Knight, Kightley, Bingham, Hoad, Lang, Philpott, Stobart, Thomas, Barnes and Ball2012) Several agronomic reasons, including inadequate N nutrition, have been proposed to explain the lack of yield improvement in the UK (Spink & Berry Reference Spink, Berry, Wiseman and Bradley2005; Knight et al. Reference Knight, Kightley, Bingham, Hoad, Lang, Philpott, Stobart, Thomas, Barnes and Ball2012). An understanding of the possible yield benefits from foliar-applied N may therefore be important for helping to increase oilseed rape yields.
The present study aims to evaluate the effects of foliar-applied N fertilizer on oilseed rape. A key objective to be investigated is whether foliar-applied N confers a yield benefit following economically optimal amounts of soil-applied N. It is possible that the previously observed yield responses to foliar-applied N were as a result of inadequate soil-applied N. The present study will also investigate at which growth stage foliar N should be applied, and what the optimal rate of application is. The efficiency with which oilseed rape takes up foliar N has not been investigated and an understanding of this will be important for estimating the impact of foliar N use on N emissions to the air and water and its impact on greenhouse gas emissions. Finally, the impact of foliar N on the concentration of oil and protein in the seed is investigated as these have an important bearing on both the economic and nutritional value of the seed.
MATERIALS and METHODS
Experiments and treatments
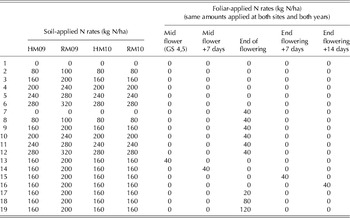
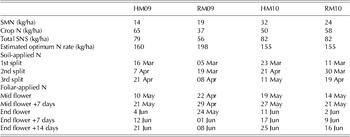
Field experiments were carried out at two UK sites in 2008/09 and 2009/10 near ADAS Rosemaund (2°36′W, 52°6′N) (RM09 and RM10) Herefordshire, on a silty clay loam (Bromyard series), and ADAS High Mowthorpe (0°30′W, 54°6′N) (HM09 and HM10) on a silty clay loam (Wold series). The same experimental design was used at each site and the treatments included: six rates of soil-applied N ranging from 0 to 280 or 320 kg N/ha, with each soil-applied N treatment followed by 0 or 40 kg foliar N/ha applied at the end of flowering; five rates of foliar N ranging from 0 to 120 kg N/ha applied at the end of flowering; and five timings of foliar N from mid-flowering to 2 weeks after the end of flowering at a rate of 40 kg N/ha (Table 1). The foliar N rate and foliar N timing treatments were applied following the soil-applied N treatment that was closest to the predicted economic optimum N rate. The optimum soil-applied N rate was estimated for each site using methodology described by Berry & Spink (Reference Berry and Spink2009) and Roques et al. (Reference Roques, Clarke and Berry2011) using measurements of soil mineral N and crop N at GS2,0 (Sylvester-Bradley & Makepeace Reference Sylvester-Bradley and Makepeace1984) in February (Table 2). The soil-applied N treatment closest to the estimated optimum N rates was 200 kg N/ha at RM09 and 160 kg N/ha at the other three experiments. The soil-applied N treatment rates up to and including the estimated optimum rate were applied in two approximately equal splits, with the first application in early March before stem extension (GS2,0), and the second application at the late green bud stage (GS3,5–3,6). The additional N rates above the estimated optimum N rate were applied between yellow bud (GS3,7) and early flowering (GS4,1). Application dates are given in Table 2.
Details of nitrogen (N) treatments

Details of February soil and crop nitrogen (N) measurements, N rates and N application dates for each experiment. SMN: soil mineral nitrogen; SNS: soil nitrogen supply (SMN+crop N)

The five foliar N application timing treatments included mid-flowering (GS4,5), mid-flowering plus 7 days, end of flowering, end of flowering plus 7 days and end of flowering plus 14 days. Foliar N was applied as a solution of urea containing 20 kg N/100 litres (Chafer Nufol 20). A water volume of 100 litres/ha was used for a foliar N rate of 20 kg N/ha, 200 litres/ha for 40 kg N/ha, 400 litres/ha for 80 kg N/ha and 600 litres/ha for 120 kg N/ha. A CO2 knapsack sprayer was used with medium spray nozzles (LD 015F110) for foliar rates of 20 and 40 kg N/ha and coarse spray nozzles (LD 04F110) for foliar N rates of 80 and 120 kg N/ha. A spray pressure of 2·5–2·8 bar was used for all applications. Care was taken to avoid applying foliar N treatments in hot, sunny conditions and applications were usually made in the morning or evening. Dates of foliar N applications are given in Table 2.
Plots were 24×3·5 m and arranged in randomized blocks, with each treatment replicated four times, except at HM10 where only three replicates were drilled. Oilseed rape varieties used were Castille at RM09, Vision at RM10 and Ovation at HM09 and HM10, all of which are open-pollinated varieties. All soil-applied N fertilizer was applied as granules of ammonium nitrate (34·5% N). All other crop inputs including pest, weed and disease control, and potassium, phosphate and sulphur fertilizers were applied at levels to prevent non-N nutrients or pests from limiting yield.
Measurements
Soil mineral N in the top 0–90 cm of the soil profile and crop N were measured in February in all experiments, to enable determination of appropriate rates of soil-applied N. Twenty soil samples were taken from the experimental area, bulked and tested for nitrate-N and ammonium-N. Crop samples were taken from a 1×1 m area in one plot of each replicate. The dry weight of the above-ground plant sample was recorded and the N concentration of the plant tissue determined by the Dumas method. Phytotoxicity (scorch) was measured in all treatments 7–14 days after each N application using a decimal scale where 0 indicated zero scorch and 1 very severe scorch.
Crop samples were taken from a 1×1 m area 10–14 days before harvest from treatments 1–5 and 7–11 (Table 1) by cutting plants at soil level. Following sampling, a random 0·20 sub-sample (determined by weight) of plant material was taken and the sub-sample was separated into stems, pod walls and seeds. The dry weight of each category was recorded and the concentration of N in each fraction was measured using the Dumas method. These measurements were used to calculate the crop biomass (t/ha) and the N content (kg N/ha) of the stems, pod walls and seeds and fertilizer N uptake efficiency.
Immediately before harvest, the percentage areas of each plot that were lodged or had shattered pods were visually assessed. Lodging was defined as the stems leaning at an angle of 10° or more from the vertical. Shattered pods were identified by their pale colour.
A small plot combine (Sampo 2025) was used to determine the seed yield from an individual plot area of at least 30 m2, avoiding plot edges. The seed moisture content was measured using a Dickey John GAC 2000 grain analysis computer (Church Industries, Minneapolis). The oil concentration of the seeds from treatments 1–5 and 7–11 (Table 1) was estimated using petroleum ether extraction (Sciantec Analytical Services Ltd., UK). In the HM10 and RM10 experiments, thousand seed weight and seeds/m2 were measured on treatments 1–5 and 7–11 (Table 1). Thousand seed weight was measured on a representative seed sample of 5 g, the seed was counted on a Numigral seed counter (Villeneuve-La-Garenne, France) and the weight corrected to 0% moisture.
Gross output was calculated to account for the combined economic effect of each treatment on seed yield and oil concentration. The UK industry standard oil premium is calculated as 1·5% of the basic oilseed rape price for each 10 g/kg of oil concentration above a base level of 400 g/kg. This means that gross output (t/ha) is calculated according to Eqn (1) from oil concentration (g/kg) and seed yield (t/ha). This calculation is described in the UK Recommended List for oilseed rape varieties (Anon. 2012).
 $${\rm GrossOuput} = 1.0015 \times \left[ {{\rm oilconcentration} - 400} \right] \times {\rm seedyield}$$
Statistical analysis
Analysis of variance procedures were used to test for differences between the treatments and to analyse cross site data using GenStat 12 (www.genstat.com). Linear plus exponential N response curves were fitted to the seed yield and gross output data for each N treatment as in Eqn (2), where Y is the seed yield (t/ha) and A, B, C and R are constants. Each linear plus exponential function was fitted using a stepwise process in GenStat 12.
 $$Y = A + BR^N + CN$$
The economic optimum N rate (NOPT) was determined as shown in Eqn (3) from the fitted linear plus exponential curve parameters defined in Eqn (2) and k, which is the breakeven ratio between fertilizer N price (p/kg) and seed value (p/kg). A breakeven ratio of 2·5 was used in the present study because this is used as a standard for UK fertilizer recommendations in the Defra RB209 Fertiliser Recommendations Handbook (Anon. 2010). The yield at the optimum N rate (Y) was calculated using Eqn (2):
 $$N_{{\rm OPT}} = \displaystyle{{[{\rm In}(k/1000 - C) - {\rm In}(B({\rm In}R))]} \over {{\rm In}R}}$$
RESULTS
Seed yield
Effects of soil-applied nitrogen
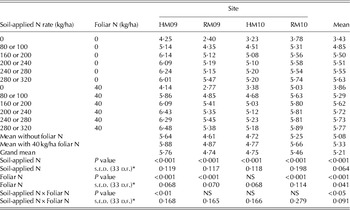
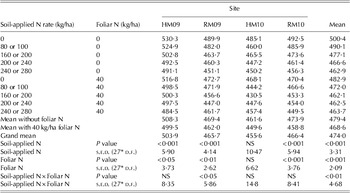
The greatest yield response resulted from increasing the soil-applied N rate (ammonium nitrate) from 0 to 80 or 100 kg N/ha (Table 3), which increased yields by 1·42 t/ha on average across all four experiments. Increasing the N rate by a further 80–100 kg N/ha increased yields by a further 0·65 t/ha on average. There were no significant increases in yield from applying more than 160 kg N/ha at HM09, HM10 or RM10, or more than 200 kg N/ha at RM09.
Seed yield (t/ha at 91% dry matter) for the soil-applied nitrogen (N) and foliar N treatments (kg/ha). Foliar N applied at the end of flowering. (n=48 for HM09, RM09 and RM10, n=36 for HM10). ANOVA P and s.e.d. (standard error of difference) values for individual sites and cross-site analysis

* d.f. for HM10=24.
Interaction between soil-applied nitrogen and foliar-applied nitrogen
At HM09 there was a significant interaction between the foliar-applied N at 40 kg N/ha and the soil-applied N rate (P<0·01; Table 3). This was because the greatest yield increase to foliar N of 0·72 t/ha was observed following a soil-applied N rate of 80 kg/ha while smaller yield responses of up to 0·47 t/ha were observed following the other soil-applied N rates. At HM09, foliar-applied N increased yield by an average of 0·24 t/ha across all soil N rates. A similar but not significant interaction was observed at RM10, where the greatest yield response to foliar N of 1·25 t/ha was observed in the absence of any soil N, with smaller yield responses following greater soil-applied N rates (Table 3). Foliar N increased yield by an average of 0·41 t/ha across all the soil-applied treatments at RM10. At RM09, there was no interaction between soil-applied N and foliar N, and the average yield response to foliar N was 0·26 t/ha. At HM10, foliar N did not affect yield significantly at any of the soil-applied N rates. Across all sites, years and soil-applied N rates, the average yield increase from 40 kg N/ha of foliar N was 0·25 t/ha (Table 3). Cross-site analysis revealed that the different sites had an effect on seed yield and interacted significantly with soil-applied N (P<0·001), foliar N treatment (P<0·01) and the interaction between the two treatments (P<0·05).
The mechanism of the seed yield response to foliar N at HM10 and RM10 was shown to be an increase in seed size with foliar N significantly increasing thousand seed weight from 5·80 to 6·01 g at RM10 (P<0·01). At HM10, foliar N significantly increased thousand seed weight from 5·02 to 5·18 g (P<0·01), but this did not result in an increase in yield because there was a reduction in seeds/m2. Thousand seed weight was not measured in the HM09 and RM09 experiments. No lodging or pod shatter was observed in any of the experiments.
Effects of foliar nitrogen at different application timings
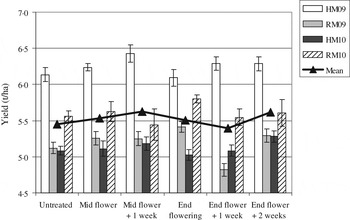
The effect of different foliar application timings was investigated by applying 40 kg N/ha of foliar N at five timings from mid-flowering to 2 weeks after the end of flowering, following a soil-applied N rate of 200 kg N/ha at RM09 and 160 kg N/ha at HM09, RM10 and HM10. There was no significant yield effect of different application timings of foliar N at any site except RM09 (Fig. 1). Across all four experiments, foliar N applications at 1 week after mid-flowering and 2 weeks at the end of flowering (Fig. 1) gave the greatest average yield response of 0·17 t/ha. Across all timings and sites there was an average yield response of 0·09 t/ha.
The effect of foliar N (40 kg N/ha) on yield (t/ha at 91% dry matter) applied following soil-applied N rate of 200 kg N/ha at RM09 and 160 kg N/ha at the other three sites. n=24 for HM09 and RM09, n=18 for HM10 and n=23 for RM10. Error bars show ±s.e.

Foliar nitrogen rate
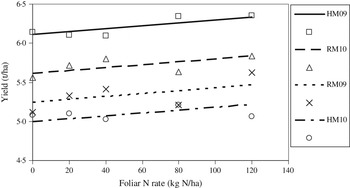
The effect of different rates of foliar N was investigated by applying rates from 0 to 120 kg N/ha at the end of flowering, following a soil-applied N rate of 200 kg N/ha at RM09 and 160 kg N/ha at HM09, HM10 and RM10. At HM09 foliar N rates of 80 and 120 kg/ha significantly (P<0·05) increased yield, by 0·21 and 0·22 t/ha, respectively, compared with the zero and lower foliar N rates. At the other sites there were no significant yield responses to foliar N applied at any rate. Multiple linear regression analysis showed that the average yield increase per kg of foliar N between 0 and 120 kg N/ha was 0·002 t/ha at each site (Fig. 2).
The relationship between yield (t/ha at 91% dry matter) and foliar N rate, applied at the end of flowering following soil-applied N rates of 200 kg N/ha at RM09 and 160 kg N/ha at the other sites. Linear regression analyses: HM09, y=0·002x+6·112; HM10, y=0·002x+5·002; RM09, y=0·002x+5·244; RM10, y=0·002x+5·614; Adjusted R 2=0·71

Increasing the foliar N rate from 40 kg N/ha to 80 or 120 kg N/ha significantly increased levels of scorch on the leaves and leaf bracts at HM09, RM09 and HM10. When foliar N was applied at 120 kg N/ha the area of leaf affected was 0·11 at HM09, 0·02 at RM09 and 0·15 at HM10. No leaf scorch was observed at RM10 and no scorch was observed on the pods at any of the sites.
Seed oil concentration
Increasing the soil-applied N rate from 0 to 160 or 200 kg N/ha significantly reduced the seed oil concentration at HM09, RM09 and RM10 (P<0·001; Table 4). Across all four experiments, increasing the soil-applied N rate from 0 to 160 or 200 kg N/ha reduced oil concentration by 23·3 g/kg. Smaller reductions in oil concentration were observed when the N rate was increased above 160 or 200 kg N/ha. Foliar N applied at a rate of 40 kg N/ha at the end of flowering significantly (P<0·05) reduced the seed oil concentration at HM09, RM09 and RM10, with oil concentration reductions of 8·8, 12·0 and 15·2 g/kg, respectively. At RM09 there was a significant (P<0·05) interaction between the soil-applied N rate and the foliar N because foliar N reduced oil concentration more at low soil-applied N rates than at high N rates. Foliar N reduced oil concentration by 17·2 g/kg when zero soil N was applied, reduced oil concentration by 8·6 g/kg at the two soil-applied N rates closest to the economic optimum (100 and 200 kg N/ha) and decreased oil concentration by 1·4 kg N/ha at super-optimal soil-applied N rates (240 and 280 kg N/ha). Cross-site analysis revealed that the different sites were not interacting with either the soil-applied N or the foliar-applied N. In 2010, additional oil measurements were carried out on the foliar N rates at 20, 80 and 120 kg N/ha. There was a significant (P<0·01) negative linear relationship between increasing foliar N rate and oil concentration in both experiments in 2010, where each additional kilogram of foliar N reduced the oil concentration by 0·29 g/kg.
Oil concentration (g/kg of seed dry weight) for soil-applied nitrogen (N and foliar N treatments (kg/ha). Foliar N applied at the end of flowering. (n=40 for HM09, RM09, HM10 and RM10). ANOVA P and s.e.d. (standard error of difference) values for individual sites and cross-site analysis

* d.f. for HM10=18.
Gross output, seed yield adjusted for oil concentration
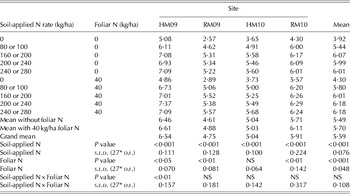
Gross output is the combined effect of seed yield and oil concentration, using Eqn (1), which accounts for the combined economic effect of each treatment on seed yield and oil concentration. Increasing soil-applied N increased gross output at all sites (Table 5). However, because increasing the soil-applied N rate also reduced oil concentration, the increases in gross yield were not as great as for seed yield (Table 3). Foliar N at a rate of 40 kg N/ha applied at the end of flowering significantly (P<0·01) increased gross output at HM09, RM09 and RM10. The average increases in gross output were 0·27 and 0·40 t/ha at RM09 and RM10, respectively. At HM09 there was a significant (P<0·01) interaction between foliar-applied N and soil-applied N. This is because foliar-applied N increased yield by 0·62 t/ha at 80 kg N/ha and by 0·44 t/ha at 200 kg N/ha, but had no significant effect at the other soil-applied N rates. Foliar-applied N had no effect on gross output at HM10. Cross-site analysis revealed that the different sites had a significant (P<0·001) effect on gross output and significantly interacted with soil-applied N (P<0·001), the foliar N treatment (P<0·05) and the interaction between the two treatments (P<0·05).
Gross output (t/ha) for the soil-applied N and foliar N treatments. Foliar N applied at the end of flowering. (n=40 for HM09, RM09, HM10 and RM10). ANOVA P and s.e.d. (standard error of difference) values for individual sites and cross site analysis

* d.f. for HM10=18.
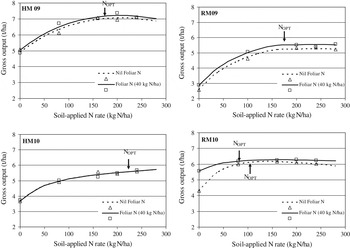
The use of foliar N did not affect the economic optimum soil-applied N rate at HM09, RM09 or HM10 (Fig. 3). At HM09 and RM09, the N response data supported fitting parallel curves to the soil and foliar N treatments. At HM10, a single response curve explained most of the variation because foliar N did not significantly affect gross output at this site. At RM10, non-parallel response curves were fitted because the foliar N treatment lowered the economic optimum soil-applied N rate. The economic optimum soil-applied N rates were 175 kg N/ha at HM09, 184 kg N/ha at RM09 and 237 kg N/ha at HM10. At RM10, the optimum soil-applied N rate was 111 kg N/ha without foliar N and 84 kg N/ha with foliar N.
Gross output response to soil-applied N and foliar N at each site in 2 years. Mean data points and fitted curves. Statistical analyses supported the fitting of parallel curves for treatments with and without foliar N in 09, a single curve for both treatments for HM10 and non-parallel curves for RM10. N OPT denotes the economic optimum N rate at breakeven ratio 2·5 : 1.

At HM10 and RM10 oil concentration was measured at the full range of foliar N application rates, which enabled the effect of a wider range of foliar N rates on gross yield to be calculated (Eqn (1)). Increasing foliar N rate did not significantly affect the gross output at either site. The maximum gross output occurred at a foliar N rate of 0 N/ha at HM10 and 40 kg N/ha at RM10.
Nitrogen uptake
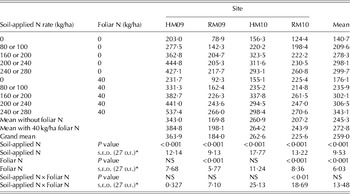
Increasing the rate of soil-applied N significantly (P<0·001) increased total N uptake (kg/ha) in all sites and seasons (Table 6). Increasing the soil-applied N rate from 0 to 240 or 280 kg N/ha increased the total N taken up at harvest by 265 kg N/ha at HM09, 156 kg N/ha at RM09, 139 kg N/ha at HM10 and 92 kg N/ha at RM10. Foliar N applied at 40 kg N/ha at the end of flowering increased total N uptake by 42 kg N/ha at HM09 (P<0·05), 28 kg N/ha at RM09 (P<0·001), with no effect at HM10. At RM10 there was an interaction between soil-applied N and foliar N, because foliar-applied N had a much greater effect on N uptake at zero soil-applied N compared with greater soil-applied N rates. A cross-site analysis revealed that different sites had an effect on the total N uptake and significantly interacted with the soil-applied N (P<0·001) but not the foliar N treatment. At the soil-applied N rates closest to the economic optimum (80 and 160 kg N/ha), foliar N resulted in an increase in N uptake of 28 kg N/ha. Comparing total amounts of N applied, for example, 200 or 240 kg soil-applied N with 160 or 200 kg of soil-applied N plus 40 kg foliar N, it can be seen that total N uptake for soil-applied N resulted in an average total N uptake of 298 kg/ha, whereas soil-applied N plus foliar N resulted in an average total N uptake of 302 kg/ha across all sites and seasons. At all sites apart from HM09, 160 or 200 kg N/ha soil-applied N plus 40 kg foliar N/ha resulted in an additional 26 kg/ha of total N taken up compared with the same amount applied only as soil N. Across all soil-applied N treatments, foliar N increased N uptake by 37 kg N/ha. The average uptake efficiency of foliar N across all sites and all soil-applied N rates (but using soil-applied N rates closest to the optimum at RM10) was 61%, with a range of 0% to over 100%. The application of foliar N did not significantly affect the harvest index, N harvest index or the N utilization efficiency (data not shown).
Total N uptake (kg/ha) measured at maturity for the soil-applied N and foliar N treatments. Foliar N applied at the end of flowering. (n=40 for HM09, RM09, and RM10 n=30 for HM10). ANOVA P and s.e.d. (standard error of difference) values for individual sites and cross-site analysis

* d.f. for RM09=26, HM10=18.
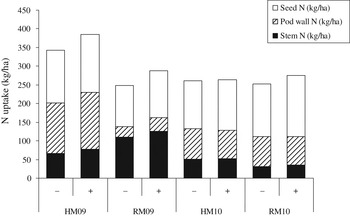
Increasing the rate of soil-applied N significantly (P<0·001) increased the N yield of the pod walls and seed in all sites and seasons (Fig. 4). A cross-site analysis revealed that foliar N had no significant effect on stem N (kg/ha). At all four sites, foliar N significantly (P<0·001) increased N yield from the seed (kg/ha). At HM09, RM09 and RM10 foliar N significantly (P<0·05) increased N uptake by increasing the amount of N in the seed and pod wall, which in turn resulted from increases in the biomass and N concentration of the seeds and pod walls. At RM09 and RM10, the greatest contribution to the increased N uptake came from the increase in seed N content, and pod wall N contributed most to the increase in N uptake at HM09. At HM09 and RM10 there was a significant (P<0·05) interaction between the soil N rate and the foliar N applied on the N yield from the seeds (Fig. 4). On average, the increase in the N content of the crop residues returned to the soil following harvest as a result of 40 kg/ha of foliar N was 12 kg N/ha, which was primarily a result of greater N in the pod walls. Across all sites and soil-applied N rates, foliar N applied at 40 kg N/ha increased seed N by 1·7 mg/g (28·6 to 30·3 mg/g). If it is assumed that protein concentration is equal to N concentration×6·25, then the average increases in seed protein content due to foliar N was 10·6 mg/g (178·7–189·3 mg/g).
Total N uptake (kg/ha) of the stem, pod walls and seed fractions for the foliar (+, 40 kg N/ha; −, 0 kg N/ha) and the average soil-applied N (kg/ha) treatments at the four sites. At HM09 N=40, RM09 n=39, HM10 n=30 and at RM10 n=40.

DISCUSSION
The present study found that the seed yield and gross output yield response to 40 kg/ha of foliar N applied at the end of flowering was independent of soil-applied N in two experiments (RM09 and RM10) and significantly (P<0·05) greater at low soil-applied N rates in one experiment (HM09). There was no significant effect of foliar N in the fourth experiment (HM10). The greatest average yield response from soil-applied N was 1·42 t/ha in response to increasing soil N from 0 to 80 or 100 kg/ha, which is consistent with previously reported oilseed rape yield responses to soil-applied N. For example, Zhao et al. (Reference Zhao, Evans, Bilsborrow and Syers1993) measured a yield increase of 1·34 t/ha in response to increasing soil-applied N from 0 to 100 kg/ha ,Yang-Yuen et al. (Reference Yang-Yuen, Tlustos, Balik and Vanek1999) found a yield increase of 1·33 t/ha in response to increasing soil-applied N from 0 to 120 kg/ha of soil-applied N. Berry et al. (Reference Berry, Spink, Foulkes and White2010) reported an average yield increase of 0·85 t/ha (range of 0–1·71 t/ha) in response to increasing N fertilizer application from low N (0–50 kg/ha) to high N (110–250 kg/ha).The effect of foliar N on seed yield ranged from 0 to 0·41 t/ha, with an average increase across all four sites of 0·25 t/ha. When calculated across the soil-applied N rates common for the gross output yield calculation (i.e. omitting the highest soil-applied N rate), the average seed yield increase was 0·28 t/ha. This benefit dropped to 0·21 t/ha for gross output yield because foliar N reduced the seed oil concentration. These findings are in contrast to those of Yang-Yuen et al. (Reference Yang-Yuen, Tlustos, Balik and Vanek1999), who found that foliar application of foliar urea did not increase seed yield. In three of the present experiments, foliar N reduced oil concentration independently of the soil-applied N rate by between 8·8 and 15·1 g/kg and in one experiment (RM09) foliar N reduced oil concentration more at low rates of soil-applied N than at high rates. The average effect of foliar N on oil concentration across the four experiments (using the effect at the optimum soil-applied N rates at RM09) was to reduce it by 10·7 g/kg. The reduction in seed oil concentration in response to increasing N fertilizer application is consistent with previous work and reflects the inverse relationship between seed oil concentration and protein content (Zhao et al. Reference Zhao, Evans, Bilsborrow and Syers1993; Hocking et al. Reference Hocking, Kirkegarrd, Angus, Gibson and Koetz1997a , Reference Hocking, Randall and Demarco b )
In the present study, the effects of foliar-applied N on oilseed rape have been calculated in terms of gross output, which is calculated by increasing the seed yield (t/ha) by 0·015 for each 10 g/kg of seed oil concentration which is >400 g/kg (Eqn (1)) (Anon. 2012). This approach is justified because it represents the value of oilseed rape that UK farmers are paid for, and against which they must justify applications of N fertilizer and other crop inputs.
A cost-benefit analysis for a gross output yield response to foliar N at 40 kg N/ha of 0·21 t/ha with application costs of £13/ha (Nix Reference Nix2011) indicates that when the foliar N cost is between £0·50 and £0·75/kg N then for foliar N to be profitable the ratio of foliar N cost (£ per kg of elemental N): oilseed rape price (£/kg) must be <3·0. When the foliar N cost is between £0·80 and £1·00/kg N then for foliar N to be profitable the ratio of fertilizer cost: oilseed rape price must be <3·5.
The present study has demonstrated that there can be large variability for the yield response to foliar N, particularly between sites, but also within the same field when applications were made on different days. There was no consistent effect of applying foliar N at different growth stages ranging from mid-flowering to 2 weeks after the end of flowering. Significant yield responses were also seen for all four of the experimental crops from at least one foliar N treatment. It therefore seems likely that the variation in yield response was caused mainly by environmental factors, although crop factors cannot be ruled out completely. The significant yield response to different foliar N application timings at RM09 was due to a low yield following the 4th foliar N timing (7 days after flowering), which might be explained by the warm weather on the day of, and following, foliar N application (maximum of 26 and 25 °C, respectively). Other foliar N applications at this site were applied on days with maximum temperatures no higher than 19 °C. Linear regression analysis was used to investigate whether several environmental factors measured at the time of application affected the yield response to the foliar N treatments applied at 40 kg N/ha. This showed that the size of the yield response was not affected by soil wetness, sun or cloud, relative humidity or time of day of application. There was a weak negative correlation between the air temperature at the time of application and the yield response (R 2=0·15; P<0·05). Six out of 19 tests showed a negative or neutral yield response to foliar N, of which five occurred when the temperature at application was 19 °C or more. More research is required to quantify the effect of temperature on the yield response, but the present analysis indicates that applications should be avoided when the temperature is 19 °C or above. It is clear that temperature only explains a small part of the variation in yield response and further research will be required to identify whether there are other environmental or crop factors which affect the yield response.
Nitrogen management guidelines developed by Berry & Spink (Reference Berry and Spink2009) and Roques et al. (Reference Roques, Clarke and Berry2011) advocate that oilseed rape crops with a high-yield potential should receive part of their total fertilizer N requirement at yellow bud or early flowering in order to minimize the risk of building an over-large canopy that would be prone to lodging. Berry & Spink (Reference Berry and Spink2009) reported that delayed applications of soil-applied N resulted in yield increases of 0·1–0·36 t/ha at three of nine experimental sites, with negligible effects at the other six sites. In dry seasons, there is a risk that late application of soil-applied N will be taken up less efficiently. Rathke et al. (Reference Rathke, Behrens and Diepenbrock2006) also concluded that N fertilization management strategies that are timed with crop N demand and account for climatic conditions will increase yield and improve NUE. The present study investigated whether foliar N could be a reliable substitute for a late dose of soil-applied N at yellow bud or early flowering. The average yield response for 40 kg soil-applied N/ha applied between yellow bud and early flowering, following 160 or 200 kg/ha soil-applied N, was 0·01 t/ha, whereas the average yield response to applying 40 kg foliar N/ha applied at the end of flowering resulted in an average yield increase of 0·12 t/ha (Table 3). Conditions were very dry in the spring of 2010 which may have reduced uptake efficiency of late soil-applied N in this year. This indicates that foliar N could be used if conditions were predicted to be too dry for soil-applied N to be taken up efficiently. However, it should be emphasized that foliar N yield responses also occurred following optimal or super-optimal rates of soil-applied N (which included late applications at yellow bud). This finding is not consistent with results in wheat, where late-season fertilizer N did not increase yield when previous applications had been sufficient (Gooding Reference Gooding2005; Gooding et al. Reference Gooding, Gregory, Ford and Ruske2007). The finding that foliar N can increase yield when soil N is optimal indicates that foliar N should be used as a treatment for increasing yields over-and-above those that can be achieved using earlier applications of soil-applied N, rather than as a substitute for soil-applied N. Therefore, if conditions are predicted to be dry it may be best to apply N to the soil earlier.
Further research is required to understand the mechanism by which foliar-applied N increases yield following optimal applications of soil-applied N. One possible explanation for this could be that foliar-applied N reduces disease. For example, foliar application of urea to oilseed rape stubble has been shown to reduce canker (Leptosphaeria maculans) ascospores by 97% (Humpherson-Jones & Burchill Reference Humpherson-Jones and Burchill1982). In the present study, disease was minimized through the use of fungicides, but it is possible that low levels of disease were present.
Foliar N was taken up with an efficiency of 70–100% at the three sites where foliar N significantly increased yield. There was no significant increase in total N uptake by the crop at the site without a significant yield response. Across all four experimental sites the efficiency with which foliar N was taken up was 61%. This is greater than the foliar N uptake efficiencies of <50% that are frequently measured in wheat at and after flowering (Gooding et al. Reference Gooding, Gregory, Ford and Ruske2007). This suggests that oilseed rape pods and upper stems may be relatively efficient at absorbing foliar N and consequently there may be less gaseous loss due to volatilization following foliar applications to oilseed rape compared with wheat after flowering. Foliar N generally resulted in more N taken up into the seed and pod wall with significant increases in seed N observed more commonly than significant increases in pod wall N. Across all sites following a foliar N rate of 40 kg/ha, approximately 0·33 of the foliar N was taken up into the seed, 0·27 into the pod walls and stems and 0·40 was not taken up. This indicates that the additional amount of N in crop residues following harvest was modest at 11 kg N/ha. Only a proportion of the N in the crop residues would be vulnerable to nitrate leaching during the following winter due to the relatively high C:N ratio of the pod walls, which will reduce mineralization of the tissues. Of the foliar N not taken up it is likely that a substantial proportion would have been volatilized. The average foliar N uptake efficiency in the present study was 61%. This is similar to the soil-applied fertilizer N uptake efficiency of 60% estimated by Berry & Spink (Reference Berry and Spink2009). It therefore seems unlikely that the use of foliar N will significantly alter the overall N uptake efficiency of oilseed rape or its overall NUE. Further work is required to investigate what causes variation in yield response to foliar N, for example crops with greater sink sizes (seeds/m2) may respond more to foliar N, whether or not foliar N has any disease control effects should be determined and the impact on drought stress may be important.
The authors gratefully acknowledge funding from the Home-Grown Cereals Authority for this study.