Executive function (EF) refers to higher-order cognitive processes that enable individuals to execute goal-directed behavior in a novel, problem-solving context. EF in early childhood is important for school success, supporting the development of social–emotional competence and academic skills (Blair & Razza, Reference Blair and Razza2007; Ursache, Blair, & Raver, Reference Ursache, Blair and Raver2012). An impressive body of research has documented that risks related to socioeconomic status (SES) and maternal mental health may interfere with the development of EF in early childhood (Gueron-Sela, Camerota, Willoughby, Vernon-Feagans, & Cox, Reference Gueron-Sela, Camerota, Willoughby, Vernon-Feagans and Cox2018; Hackman & Farah, Reference Hackman and Farah2009; Hughes, Roman, Hart, & Ensor, Reference Hughes, Roman, Hart and Ensor2013; Mezzacappa, Reference Mezzacappa2004; Noble, Norman, & Farah, Reference Noble, Norman and Farah2005; Raver, Blair, Willoughby, & Family Life Project Key Investigators, Reference Raver, Blair and Willoughby2013). While both SES and maternal mental health have been found to uniquely influence child cognitive development as key predictors (Kiernan & Huerta, Reference Kiernan and Huerta2008), recent studies using a person-centered approach have demonstrated the critical role of maternal mental health in EF development. This line of studies has shown that risks related to SES and maternal mental health symptoms systematically interplay to combine into certain patterns, and the distinct patterns of risks are associated with different levels of child EF at early ages, in this (Rhoades, Greenberg, Lanza, & Blair, Reference Rhoades, Greenberg, Lanza and Blair2011) and other datasets (Ku, Feng, Hooper, Wu, & Gerhardt, Reference Ku, Feng, Hooper, Wu and Gerhardt2019). Interestingly, among a number of studies, evidence has been found that the role of maternal mental health in the development of EF may differ in various SES contexts. For example, work by Ku et al. (Reference Ku, Feng, Hooper, Wu and Gerhardt2019) has indicated that having mentally healthy mothers, characterized by low levels of depression and anxiety symptomology, may compensate for the adverse effect of low SES on the development of early EF. However, it remains unclear how different patterns of risks related to SES and maternal mental health symptoms contribute to the developmental trajectory of EF during early childhood. Along with these proximal contexts, broader contexts, such as neighborhood environments, may also affect cognitive development and EF (McCoy, Raver, & Sharkey, Reference McCoy, Raver and Sharkey2015); thus, this study considered a neighborhood context as an additional indicator of early caregiving environments.
Theoretically, maternal positive parenting may play a protective role in child development, promoting resilience in children exposed to adversity (Masten, Best, & Garmezy, Reference Masten, Best and Garmezy1990). In light of the well-documented role of maternal parenting in the development of EF (Bernier, Carlson, & Whipple, Reference Bernier, Carlson and Whipple2010; Brandes-Aitken et al., Reference Brandes-Aitken, Braren, Gandhi, Perry, Rowe-Harriott and Blair2020; Fay-Stammbach, Hawes, & Meredith, Reference Fay-Stammbach, Hawes and Meredith2014), maternal sensitivity, in particular, may serve a key role in promoting the development of EF among children living in disadvantaged environments. Accordingly, the present study attempted to identify profiles of family environments based on SES and neighborhood environments, and maternal mental health symptoms, and also examined the protective role of maternal sensitivity in the association between early family risk profiles and the growth of EF during the preschool period.
Developmental Trajectories of EF in Early Family Environments
Although EF in adulthood is considered a construct consisting of distinct but correlated working memory, inhibitory control, and attention shifting components (Miyake et al., Reference Miyake, Friedman, Emerson, Witzki, Howerter and Wager2000), in early childhood the construct has been shown to be unitary (Garon, Bryson, & Smith, Reference Garon, Bryson and Smith2008). Children exhibit a rapid increase in EF during the preschool period (Anderson, Reference Anderson2002). Although research on EF in early childhood is currently of strong interest (Diamond, Reference Diamond2013), few studies have examined growth in EF in the preschool period. For example, using the dataset analyzed in this study, children in the preschool period have shown a linear increase in overall EF during the preschool years across age 3, 4, and 5 years (Blair, Kuzawa, & Willoughby, Reference Blair, Kuzawa and Willoughby2020; Kuhn, Willoughby, Vernon-Feagans, & Blair, Reference Kuhn, Willoughby, Vernon-Feagans and Blair2016; Willoughby, Wirth, Blair, & Family Life Project Key Investigators, Reference Willoughby, Wirth and Blair2012). Analyses of other datasets with EF measured longitudinally have also produced evidence for a linear increase in EF during the preschool years (Bindman, Hindman, Bowles, & Morrison, Reference Bindman, Hindman, Bowles and Morrison2013; Hughes & Ensor, Reference Hughes and Ensor2011; Hughes, Ensor, Wilson, & Graham, Reference Hughes, Ensor, Wilson and Graham2010).
The model of the intergenerational transmission of self-regulation (Bridgett, Burt, Edwards, & Deater-Deckard, Reference Bridgett, Burt, Edwards and Deater-Deckard2015) posits that both proximal and broader developmental contexts shape the development of EF. These contexts include socioeconomic (e.g., income), neighborhood (e.g., neighborhood disadvantage, violence), and psychosocial environments (e.g., maternal mental health). However, despite the well-documented rapid growth of EF during the preschool period, the role of these different types of environments in the growth of EF during this time period is not well known.
Socioeconomic and neighborhood environments shaping trajectories of EF development
A large body of literature has documented that SES-related adversity may undermine the development of EF in early childhood from as early as 2 years old through the preschool period (Blair et al., Reference Blair, Granger, Willoughby, Mills-Koonce, Cox, Greenberg and Fortunato2011; Hackman & Farah, Reference Hackman and Farah2009; Mezzacappa, Reference Mezzacappa2004). For example, prior analyses with the dataset analyzed here have found that lower income-to-needs ratio and/or higher economic strain (i.e., both averaged across infancy and the preschool period) were associated with lower EF in 3-year-olds (Blair et al., Reference Blair, Granger, Willoughby, Mills-Koonce, Cox, Greenberg and Fortunato2011) and 4-year-olds (Raver et al., Reference Raver, Blair and Willoughby2013). Furthermore, low-income families tend to inhabit homes with fewer rooms, greater noise, and within more dangerous neighborhoods (Iceland & Bauman, Reference Iceland and Bauman2007). Accordingly, a line of research has documented that neighborhood risk (e.g., neighborhood disadvantage, violence) and residential crowding are related to low levels of general cognitive function and EF assessed at one point in time during early and middle childhood (Evans et al., Reference Evans, Ricciuti, Hope, Schoon, Bradley, Corwyn and Hazan2010; McCoy et al., Reference McCoy, Raver and Sharkey2015; Raver et al., Reference Raver, Blair and Willoughby2013). Some researchers used neighborhood environments as an extension of SES; however, there have been findings that direct measures of SES and neighborhood environments may have distinct effects on child stress physiology (Hackman, Betancourt, Brodsky, Hurt, & Farah, Reference Hackman, Betancourt, Brodsky, Hurt and Farah2012), which is associated with EF. Moreover, the effect of neighborhood environments on self-regulation development may differ at varying levels of SES, such as parental education (Hackman et al., Reference Hackman, Robert, Grübel, Weibel, Anagnostou, Hölscher and Schinazi2019). Thus, the current study has considered both SES and neighborhood environments as separate indicators of direct and indirect measures of SES.
Yet to date, the role of SES and neighborhood environments in the growth of EF during the preschool years has received less attention, and only a few studies have examined this effect during early or middle childhood (e.g., Hackman, Gallop, Evans, & Farah, Reference Hackman, Gallop, Evans and Farah2015; Hughes et al., Reference Hughes, Ensor, Wilson and Graham2010). For example, Hughes et al. (Reference Hughes, Ensor, Wilson and Graham2010) found that lower family income predicted lower EF scores at age 4 but did not predict the rate of increase in EF from age 4 to 6. Similarly, neither maternal education nor neighborhood disadvantage predicted the rate of increase in EF during middle childhood (Friedman et al., Reference Friedman, Scholnick, Bender, Vandergrift, Spieker and Hirsh Pasek2014; Hackman et al., Reference Hackman, Betancourt, Gallop, Romer, Brodsky, Hurt and Farah2014, Reference Hackman, Gallop, Evans and Farah2015). This line of studies has consistently shown nonsignificant associations between SES/neighborhood environments and the rate of change in EF. However, the development of EF may not occur in isolation but in a context where multiple environments interact. Thus, there is a need to examine the role of SES/neighborhood environments in EF growth in conjunction with other types of caregiving environments. Maternal mental health is a good candidate, as recent studies have shown the critical role of maternal mental health in the development of EF (e.g., Gueron-Sela et al., Reference Gueron-Sela, Camerota, Willoughby, Vernon-Feagans and Cox2018; Hughes et al., Reference Hughes, Roman, Hart and Ensor2013; Ku & Feng, Reference Ku and Feng2021).
Maternal mental health symptoms shaping trajectories of EF development
A number of studies have demonstrated that maternal mental health symptoms, such as depression and anxiety symptoms, may have a negative effect on child cognitive functioning, independent of the effect of SES (e.g., Field, Reference Field2018; Kiernan & Huerta, Reference Kiernan and Huerta2008; Liu et al., Reference Liu, Kaaya, Chai, McCoy, Surkan, Black and Smith-Fawzi2017; Stein, Malmberg, Sylva, Barnes, & Leach, Reference Stein, Malmberg, Sylva, Barnes and Leach2008). Similarly, growing evidence suggests that maternal mental health symptoms may impede the development of EF during early childhood (e.g., Clavarino et al., Reference Clavarino, Mamun, O'Callaghan, Aird, Bor, O'Callaghan and Alati2010; Gueron-Sela et al., Reference Gueron-Sela, Camerota, Willoughby, Vernon-Feagans and Cox2018) and middle childhood/adolescence (Buss, Davis, Hobel, & Sandman, Reference Buss, Davis, Hobel and Sandman2011; Comas, Valentino, & Borkowski, Reference Comas, Valentino and Borkowski2014). For example, preschool-age children showed lower levels of EF when their mothers showed greater depressive symptoms at age 2 (Hughes et al., Reference Hughes, Roman, Hart and Ensor2013) or anxiety symptoms during or after pregnancy (Clavarino et al., Reference Clavarino, Mamun, O'Callaghan, Aird, Bor, O'Callaghan and Alati2010). Mothers experiencing elevated depression or anxiety symptoms may have difficulty recognizing the child's needs, providing a prompt, appropriate response, and respecting the child's autonomy (Kluczniok et al., Reference Kluczniok, Boedeker, Fuchs, Hindi, Fydrich, Fuehrer and Bermpohl2016; Nicol-Harper, Harvey, & Stein, Reference Nicol-Harper, Harvey and Stein2007). Such behaviors might impede the development of EF.
Despite emerging evidence supporting the link between maternal mental health symptoms and children's EF, there is insufficient work investigating the effect of maternal mental health symptoms on developmental trajectories of EF. There are also few studies examining maternal mental health and trajectories of cognitive development. For example, in Azak's (Reference Azak2012) study, when mothers were clinically depressed at 6 months, their children showed stable and low levels of cognitive functioning (e.g., receptive and expressive language) during infancy, while those of nondepressed mothers showed an increase in cognitive functioning. While the literature shows that clinical-level depression negatively impacts child development, another line of studies has also shown that even mild levels of depression symptomology that do not meet criteria for clinical-level depression may result in adverse effect on the development of self-regulation (Ashman, Dawson, & Panagiotides, Reference Ashman, Dawson and Panagiotides2008). Thus, it is important to consider mild to moderate levels of mental health symptoms in relation to the development of child EF.
Profiles of Early Family Environments and Child EF
Low SES families are heterogenous, characterized by diverse patterns of strengths and risks, and as such are diverse in their experience of psychological symptoms (Lanza, Tan, & Bray, Reference Lanza, Tan and Bray2013). Low SES and maternal mental health symptoms are correlated to some extent, but are distinct and, as such, are amenable to a person-centered approach to data analysis. The person-centered approach is used to classify individuals with similar patterns of defining characteristics into latent profiles (Muthén & Muthén, Reference Muthén and Muthén2000). The approach helps gain a more holistic understanding of the complex associations among multiple influences that families experience, both positive and negative, such that childhood outcomes are not predicted by a single context alone, but instead by combinations of multiple family strengths and risks.
Profiles based on the combinations of differing levels of SES and maternal mental health symptoms are associated with variation in child EF and EF-related outcomes such as behavioral regulation (Ku et al., Reference Ku, Feng, Hooper, Wu and Gerhardt2019; Lanza et al., Reference Lanza, Tan and Bray2013; Pratt, McClelland, Swanson, & Lipscomb, Reference Pratt, McClelland, Swanson and Lipscomb2016; Rhoades et al., Reference Rhoades, Greenberg, Lanza and Blair2011). There have been mixed findings concerning the associations between early family profiles and the development of EF and related constructs. For example, a line of research has found that groups of mothers with low SES (i.e., at their child's third year or averaged across the first three years) exhibited varying levels of depression and/or anxiety symptoms and were classified into discrete profiles based on symptomatology: one profile with fewer symptoms of depression/anxiety, another with moderate symptoms, and the last with greater symptoms (Ku et al., Reference Ku, Feng, Hooper, Wu and Gerhardt2019; Pratt et al., Reference Pratt, McClelland, Swanson and Lipscomb2016). Among mothers in low-income profiles with varying levels of mental health symptoms, 4-year-olds of mentally healthy mothers exhibited better inhibitory control and attention shifting (Ku et al., Reference Ku, Feng, Hooper, Wu and Gerhardt2019), and better behavioral regulation (Pratt et al., Reference Pratt, McClelland, Swanson and Lipscomb2016). These findings indicate that having mentally healthy mothers may benefit the development of EF among children from low-income homes.
Rhoades et al. (Reference Rhoades, Greenberg, Lanza and Blair2011), using data from the Family Life Project (FLP), the dataset analyzed here, indicated that SES is a more salient factor than maternal mental health for child EF. Specifically, Rhoades et al. (Reference Rhoades, Greenberg, Lanza and Blair2011) showed that children in a low family risk profile (i.e., higher SES, married mothers, low residential crowding, fewer depression, anxiety, and somatization symptoms of mothers measured at child age 2 and 7 months) showed better EF at age 4 than those in low-SES profiles with varying levels of maternal demographic characteristics, including one profile of married mothers with moderate mental health symptoms, a second profile of unmarried mothers with moderate mental health symptoms, and a final profile of unmarried mothers with greater mental health symptoms. Rhoades et al. (Reference Rhoades, Greenberg, Lanza and Blair2011) found that among the low-SES profiles, children did not vary in EF at age 4 as a function of maternal mental health. Rhoades et al. (Reference Rhoades, Greenberg, Lanza and Blair2011) also found mediation of some but not all risk profiles through general composites of positive and negative parenting at child age 7 months. The current analysis extends the analysis of Rhoades et al. (Reference Rhoades, Greenberg, Lanza and Blair2011) by testing the key question of whether maternal sensitivity matters most in high-risk environments by examining moderation of risk by maternal sensitivity rather than mediation of risk through overall positive and negative parenting composites. Furthermore, although prior research has attempted to investigate preschool age children's EF at discrete time points in the context of early family profiles, it is not yet clear whether distinct profiles of early family characteristics would be associated with differential developmental trajectories of EF during the preschool years.
Interactions between Early Family Profiles and Maternal Sensitivity in Predicting Developmental Trajectories of EF
Masten et al.'s (Reference Masten, Best and Garmezy1990) risk-protective developmental framework suggests that positive characteristics of children or caregivers can promote positive developmental outcomes among children experiencing adversity. Supporting this protective view, studies have found that positive maternal parenting would promote cognitive and social–emotional functioning among children growing up in socioeconomically disadvantaged environments and/or those of mothers experiencing mental health symptoms (Grant, McMahon, Reilly, & Austin, Reference Grant, McMahon, Reilly and Austin2010; NICHD Early Child Care Research Network [ECCRN], 1999; Oxford & Lee, Reference Oxford and Lee2011). Among various types of maternal behaviors, the current study particularly focused on maternal sensitivity, which refers to the mother's ability to recognize the child's signals and respond to the child in a warm, prompt, and appropriate manner (Ainsworth, Blehar, Waters, & Wall, Reference Ainsworth, Blehar, Waters and Wall1978). Maternal sensitivity has been documented to play a key role in the development of EF in early childhood (Fay-Stammbach et al., Reference Fay-Stammbach, Hawes and Meredith2014) in studies using a community sample (e.g., Bernier et al., Reference Bernier, Carlson and Whipple2010) and the sample used in this study (e.g., Brandes-Aitken et al., Reference Brandes-Aitken, Braren, Gandhi, Perry, Rowe-Harriott and Blair2020). While there have been a wealth of studies investigating EF development in the context of family SES, research has not yet considered the protective role of maternal sensitivity in the development of EF among children living in disadvantaged environments. Previous studies focusing on cognitive development and behavioral regulation, although limited in number, have found the protective role of maternal sensitivity (Oxford & Lee, Reference Oxford and Lee2011). For example, Oxford and Lee (Reference Oxford and Lee2011) delineated two profiles of families, the socioeconomically advantaged and disadvantaged profiles, and found that maternal sensitivity at 36 months was associated with reading achievement in Grade 1 in the disadvantaged profile, but not in the advantaged profile.
In general, mothers experiencing mental health symptoms are at risk for providing low-quality parenting. However, recent empirical studies have shown that not all mothers with mental health symptoms are identical in terms of their parenting behavior (e.g., Brophy-Herb et al., Reference Brophy-Herb, Martoccio, Hillaker, Stansbury, Harewood, Senehi and Fitzgerald2013; Field, Hernandez-Reif, & Diego, Reference Field, Hernandez-Reif and Diego2006). For instance, Hooper, Feng, Christian, and Slesnick (Reference Hooper, Feng, Christian and Slesnick2015) found that among mothers with a range of mental health symptoms (e.g., stress, depressive symptoms), a subgroup of the mothers showed low levels of positive interactions with their child (e.g., decreased positive statements, gestures, and emotion expression), while another subgroup with elevated depressive symptoms showed high levels of positive interactions. In the further analysis, children showed differing social–emotional outcomes between the subgroups. This line of work implies the interactive nature of maternal mental health and maternal parenting affecting child development. Work by NICHD ECCRN (1999) found that maternal sensitivity during the first 3 years predicted expressive language at age 3. Interestingly, the positive association between maternal sensitivity and child expressive language was stronger among children whose mothers had experienced a clinical level of depressive symptoms over the first 3 years than those whose mothers had never had a clinical level of depressive symptoms. Similarly, Grant et al. (Reference Grant, McMahon, Reilly and Austin2010) found that maternal sensitivity at 7 months was associated concurrently with child cognitive skills among children whose mothers had prenatal anxiety disorder, while no association was found for those whose mothers did not have prenatal anxiety. These interaction patterns for cognitive development likely apply to the development of EF, such that the association between maternal sensitivity and child EF may be stronger for children living in more psychologically or socioeconomically disadvantaged environments.
The Current Study
Using latent profile analysis (LPA), the current study identified profiles of early family environments at 6 months of age based on indicators of SES, neighborhood environments, and maternal mental health symptoms. Specifically, we included maternal marital status, maternal education, household income-to-needs ratio, parental occupational prestige, the possession of maternal health insurance, learning materials available in the home, perceived economic strain, residential crowding, neighborhood safety/quietness, and maternal depression, anxiety, and somatization symptoms. Considering that multiple mental health symptoms tend to co-exist (Kaufman & Charney, Reference Kaufman and Charney2000; Rief, Hennings, Riemer, & Euteneuer, Reference Rief, Hennings, Riemer and Euteneuer2010), it is likely that mothers classified into the same profile would show similar levels of symptoms in depression, anxiety, and somatization. Similar to prior work (Ku et al., Reference Ku, Feng, Hooper, Wu and Gerhardt2019; Pratt et al., Reference Pratt, McClelland, Swanson and Lipscomb2016; Rhoades et al., Reference Rhoades, Greenberg, Lanza and Blair2011), we expected to find between four and six profiles, reflecting various combinations of different levels of SES, neighborhood environments and maternal mental health symptoms. Specifically, we expected to find a low-risk profile with lower levels of risk on all indicators (i.e., advantaged SES, higher neighborhood safety, and fewer maternal mental health symptoms), an average profile with average levels of risk on all indicators, and a high-risk profile with higher levels of risk on all indicators. We also expected to find two to three additional profiles, each of which could be defined by combinations of differing levels of SES, neighborhood environments, and maternal mental health symptoms, specifically, a SES/neighborhood environments risk only profile characterized by the absence of maternal mental health symptoms and a mental health risk only profile characterized by relatively advantaged SES/safe neighborhood environments.
In regard to EF, we hypothesized a linear increase in EF from 36 to 60 months, consistent with findings from previous studies using the FLP data (Blair et al., Reference Blair, Kuzawa and Willoughby2020; Kuhn et al., Reference Kuhn, Willoughby, Vernon-Feagans and Blair2016; Willoughby et al., Reference Willoughby, Wirth and Blair2012). However, we hypothesized that children would show different developmental trajectories of EF in distinct family profiles. In line with past evidence (Ku et al., Reference Ku, Feng, Hooper, Wu and Gerhardt2019; Rhoades et al., Reference Rhoades, Greenberg, Lanza and Blair2011), we expected that among identified profiles, children in the highest risk profile (e.g., disadvantaged SES, lower neighborhood safety, and greater maternal mental health symptoms) would show the lowest levels of EF at 36 months. We did not hypothesize differences in EF at 36 months in the SES/neighborhood environments risk only profile and in the maternal mental health risk only profile, because of mixed findings from past work, with some studies suggesting the primary role of SES (Rhoades et al., Reference Rhoades, Greenberg, Lanza and Blair2011) while others emphasize the role of maternal mental health (Ku et al., Reference Ku, Feng, Hooper, Wu and Gerhardt2019; Pratt et al., Reference Pratt, McClelland, Swanson and Lipscomb2016) in early EF and EF-related development. However, we were mindful of the restricted range of SES in our predominantly low-income sample and the implications this might have for our ability to detect a profile characterized by only mental health risk.
Regarding the rate of change in EF, however, we hypothesized that maternal mental health would be a primary factor that contributes to differences in the rate of change in EF in distinct profiles. Prior work showed that children of mentally healthy mothers showed a faster increase in cognitive ability from infancy through early toddlerhood (Azak, Reference Azak2012), whereas SES did not predict the rate of change in EF development during early and middle childhood (Hackman et al., Reference Hackman, Betancourt, Gallop, Romer, Brodsky, Hurt and Farah2014, Reference Hackman, Gallop, Evans and Farah2015; Hughes et al., Reference Hughes, Ensor, Wilson and Graham2010). We hypothesized that children in lower and average SES profiles with mentally healthy mothers would show a faster increase in EF from 36 to 60 months, compared to those in the dual high-risk profile (i.e., disadvantaged SES/lower neighborhood safety and greater maternal mental health symptoms).
Lastly, we examined interactions between family profile membership and maternal sensitivity in the prediction of initial level and the growth rate of child EF across the preschool period. Maternal sensitivity assessed at 24 months was included in all analyses because it was the most proximal nonoverlapping time point to the EF assessments. In addition, prior work has indicated that maternal sensitivity may change during childhood (Mills-Koonce, Gariepy, Sutton, & Cox, Reference Mills-Koonce, Gariepy, Sutton and Cox2008; Wang, Christ, Mills-Koonce, Garrett-Peters, & Cox, Reference Wang, Christ, Mills-Koonce, Garrett-Peters and Cox2013) and mothers in various contexts with differing levels of SES and mental health symptoms may show distinct trajectories of sensitivity over time (Campbell, Matestic, von Stauffenberg, Mohan, & Kirchner, Reference Campbell, Matestic, von Stauffenberg, Mohan and Kirchner2007). Thus, the use of a composite of maternal sensitivity, averaging sensitivity scores across multiple time points, may not be appropriate. Consistent with the small extant literature (Grant et al., Reference Grant, McMahon, Reilly and Austin2010; NICHD ECCRN, 1999; Owen & Shaw, Reference Owen and Shaw2003), we hypothesized that there would be a significant association between maternal sensitivity at 24 months and EF, both the initial level and the rate of change, in the dual high-risk profile and the profiles with relatively high-risk for SES or maternal mental health symptoms alone, but not in the low-risk profile.
Method
Participants
The FLP was designed to study children and families (N = 1,292) who lived in two areas of the United States with high poverty rates (Dill & Myers, Reference Dill, Myers and Blau2004). Specifically, three counties in North Carolina (NC) and three in Pennsylvania (PA) were selected to be representative of the Black South and Appalachia, respectively. Adopting a developmental epidemiological sampling design, the FLP recruited a representative sample of 1,292 children and families who resided in one of the six counties at the time of the child's birth. Low-income families in both states and African American families in NC were oversampled (i.e., African American families were not oversampled in PA because the target communities included at least 95% non-African Americans). A comprehensive description of the sampling procedure is provided by Vernon-Feagans and Cox (Reference Vernon-Feagans and Cox2013). Among 1,292 families, 82% completed the 2-month assessment. At the 2-month assessment, 58.6% of mothers were White, 41.7% were African American, and 0.7% were other. Approximately, 51% of the children were boys and 49% were girls.
Procedures
The current study used parent and child measures assessed at 2-, 6-, 15-, 24-, 36-, 48-, and 60-month home visits. Home visits included a set of parent (e.g., interviews, questionnaires), child (e.g., cognitive and EF skills), and parent–child dyadic (e.g., parent-child interactions) tasks. At 24 months, mother–child dyads participated in a mother-child interaction task, a puzzle task. Parent-child interactions were videotaped for later coding. The battery of EF tasks was administered to children at 36, 48, and 60 months, which took approximately 30–45 min for children to complete. At each time, except for the 2-month visit, home visits took 2–3 h to complete.
Measures
All indicators of early family environments were assessed at the 6-month assessment, including indicators of SES, neighborhood environments, and maternal mental health. Among those indicators, continuous indicators were standardized.
Indicators of early family environments
Maternal marital status
Mothers reported their marital status and it was coded 0 (unmarried) and 1 (married).
Maternal education
Mothers’ highest levels of completed education (in years) was coded, ranging from 1 (less than high school) to 22 (doctoral degree).
Income-to-needs ratio
Income-to-needs ratios were calculated by dividing the total household income by the federal poverty threshold for the number of people residing in the household for that year. An income-to-ratio below 1.0 indicates that the family's income is less than the threshold for the family size and is not able to provide for basic needs, thus considered poor. Income-to-needs ratios were log-transformed to correct for positively skewed distribution.
Occupational prestige
Parental occupational prestige was coded using the National Opinion Research Center (NORG) coding system (Nakao & Treas, Reference Nakao and Treas1994). Occupational prestige scores were calculated for both parents and then the higher score was chosen for the family's occupational prestige score. Higher scores indicate higher self-direction and upward mobility, and lower physical activity, exposure to hazardous conditions and automation/repetition (Crouter, Lanza, Pirretti, Goodman, & Neebe, Reference Crouter, Lanza, Pirretti, Goodman and Neebe2006).
Health insurance
Mothers reported whether they had any type of health insurance and it was coded 0 (no) and 1 (yes).
Learning materials
The provision of learning materials in the home was assessed with the learning materials subscale of the Home Observation for the Measurement of the Environment Inventory (HOME; Bradley, Reference Bradley and Reese1994). The learning materials subscale consisted of nine items (e.g., muscle activity toys or equipment, complex eye–hand coordination toys), each of which was scored in a yes/no fashion by the trained research assistants. Average scores of the nine items were calculated. The scores of the learning materials subscale were squared to correct for negatively skewed distribution. Cronbach's alpha for the nine items was 0.77. This learning materials measure was a summative combination of the multiple items, which did not require higher internal consistency.
Economic strain
Economic strain was measured using the Economic Strain Questionnaire (Conger & Elder, Reference Conger and Elder1994), consisting of six items. The first two items assessed economic need, the degree to which the family had difficulty paying bills (1 = great deal of difficulty to 5 = no difficulty at all) and the degree to which the family ran out of money each month (1 = not enough to make ends meet to 5 = more than enough money left over). The rest of the four items assessed economic sufficiency, the degree to which the family felt they had enough money to afford the housing, clothing, food, and medical care they needed (1 = strongly disagree to 4 = strongly agree). The scores of each item were reversed and then averaged. Higher scores indicated greater economic strain.
Residential crowding
A residential crowding score was generated, such that the number of rooms in the household was divided by the number of people living in the household. The scores of residential crowding were log-transformed to correct for positively skewed distribution.
Neighborhood safety
The Windshield Survey consisted of 12 items drawn from the FAST Track project (Conduct Problems Prevention Research Group, 1992). The current study used the three-item Neighborhood Safe/Quiet Scale from the Windshield Survey, which asked about the safety of the area outside of the building (1 = obviously dangerous to 4 = above average safety), the noise level in the neighborhood around the dwelling (1 = very quiet to 4 = very noisy; reverse scored), and the safety of the neighborhood around the dwelling (1 = very safe/crime free to 4 = very unsafe/high risk; reverse scored). Average scores of the three items were calculated. Higher scores indicated higher levels of neighborhood safety. Cronbach's alpha for the three items was 0.76.
Maternal mental health symptoms
Mothers completed the Brief Symptoms Inventory-18 (BSI-18; Derogatis, Reference Derogatis2000). BSI-18 is a short self-report screening index of psychological distress including three subscales: depression, anxiety, and somatization symptoms. Each subscale consisted of six items, each of which was scored using a Likert-type scale ranging from 0 (not at all) to 4 (extremely). Item scores of each subscale were summed and then each summary score was averaged across six items. The mean scores of each subscale were log-transformed to correct for positively skewed distribution. Cronbach's alpha for each subscale indicated good internal consistency (depression: α = 0.84; anxiety: α = 0.78; somatization: α = 0.77). The clinical cut-off score for depression, anxiety, and somatization are T scores at or above 63. In our sample, the percentages of mothers meeting the clinical cut-off were relatively low, 6.55% for depression, 5.29% for anxiety, and 10.08% for somatization.
Maternal sensitivity
Maternal sensitivity was measured during mother-child interactions when the target child was 24 months old. Mother–child dyads completed a puzzle task consisting of three jigsaw puzzles, each of which differed in level of difficulty. During the puzzle task, the mother was asked to assist the child in resolving the puzzles. Each mother-child interaction lasted 10 minutes and all interactions were video recorded for later coding. Coders rated maternal behaviors including responsiveness/supportive presence, detachment, intrusiveness, stimulation of cognitive development, positive regard, negative regard, and animation in interaction with the child (Cox & Crnic, Reference Cox and Crnic2002; NICHD ECCRN, 1999). Each behavior was rated on a 1–7 scale at 24 months, where 1 = not at all characteristic and 7 = highly characteristic. Then, for consistency with earlier assessments of maternal parenting, the 24-month maternal behaviors were rescaled to range from 1 to 5. A maternal sensitivity composite at 24 months was created by summing three subscales, responsiveness/supportive presence (i.e., how the mother responded to the child's signals, social gestures, and expression of distress and negative affects), intrusiveness (i.e., level of mother-centered interactions rather than child-centered; reverse scored), and negative regard (i.e., the mother's expressions of harsh and negative feelings toward the child; reverse scored). Interrater reliability for the sensitivity composites was assessed by calculating the intraclass correlations (ICC) across each pair of coders. The ICC was 0.91 at 24 months. At least 20% of all observations were double-coded and discrepancies were resolved by conferencing.
Child executive function (EF)
Children's EF was measured at 36, 48, and 60 months using the battery of EF including measures of working memory, inhibitory control, and attention shifting. For each task, children were required to successfully complete practice trials and attempted up to three trials as needed. Children who completed 75% of practice trials received a score for that task. Item response theory was used to construct expected a posteriori (EAP) scores for each task. The expected a posteriori scores were averaged to generate a composite score of EF at 36, 48, and 60 months and then were z scored, where a value of 0 represented the average EF abilities at the 48-month assessment. The EF battery has been widely used in prior studies (e.g., Blair et al., Reference Blair, Kuzawa and Willoughby2020; Kuhn et al., Reference Kuhn, Willoughby, Vernon-Feagans and Blair2016; Willoughby et al., Reference Willoughby, Wirth and Blair2012). The battery included three inhibitory control tasks (spatial conflict, go no-go, and a Stroop-like task), two working memory tasks (self-ordered pointing and a span-like task), and one attention shifting task based on the Flexible Item Selection task (Jacques & Zelazo, Reference Jacques and Zelazo2001). The six individual EF tasks exhibited measurement invariance across age 3, 4, and 5 (Willoughby et al., Reference Willoughby, Wirth and Blair2012). A full description of each measure and detailed information about the measurement invariance can be found in Willoughby et al. (Reference Willoughby, Wirth and Blair2012).
Covariates
A set of child and maternal characteristics was included in the analyses as covariates. Child demographic characteristics included sex (0 = female, 1 = male) and race (0 = White, 1 = Black), from responses collected at the 2-month assessment. At the 15-month home visit, children's cognitive development was assessed with the Mental Developmental Index (MDI), derived from the Bayley Scales of Infant Development (BSID-II; Bayley, Reference Bayley1993). Norm-referenced standard scores (M = 100, SD = 15) were used in the analyses. Maternal age obtained at the 6-month home visit was included and ages of 18 years or younger were treated as missing (n = 46). Lastly, recruitment site was also included as a covariate (0 = PA, 1 = NC).
Missing data
Due to item nonresponse, 9.32% of the responses were missing at 6 months, 15.48% at 15 months, 18.29% at 24 months, 24.61% at 36 months, 21.84% at 48 months, and 19.60% at 60 months. Among 1,292 families enrolled at the 2-month assessments, 19.6% of the families (n = 254) did not have an EF assessment at 60 months. Those who did not have the 60-month EF assessment did not differ from those who had in most of the study variables including maternal age, maternal marital status, maternal education, and income-to-needs ratio assessed at 6 months, as well as in terms of child sex and race (ps < .05). Families recruited from PA were more likely to have the 60-month EF assessment (84%) than those from NC (78%). Table 1 presents descriptive statistics of the sample in terms of early demographics, maternal characteristics, and child EF. To account for missing data, we fitted all models using full information maximum likelihood estimation, which produces unbiased parameter estimates (Enders & Bandalos, Reference Enders and Bandalos2001).
Descriptive statistics and bivariate correlations

Note. Correlations in bold are p < .001; M = maternal; mos = months; for married mothers and maternal health insurance, the proportions of mothers being married and mothers having insurance were presented; scores of income-to-needs ratio, residential crowding, depression, anxiety, and somatization were log-transformed and learning materials were squared to correct skewness.
Analytic plan
Analyses proceeded in three steps using Mplus 8.4 (Muthén & Muthén, Reference Muthén and Muthén1998–2017). Scores of the continuous indicators of early family environments were standardized so that all indicators were compared on the same scale and interpretation of results was facilitated. For preliminary analyses, descriptive statistics on the study variables and bivariate correlations between them were conducted.
-
Step 1: Latent Profile Analysis (LPA) to Define Latent Profiles of Early Family Environments
First, LPA was used to identify different profiles of families based on indicators of family SES, neighborhood environments, and maternal mental health symptoms assessed at 6 months of age. LPA is a person-centered approach that classifies individuals into distinct profiles/subgroups, each of which shares similar patterns of defining features (Muthén & Muthén, Reference Muthén and Muthén2000). The following indicators of early family environments were included in this study: maternal marital status, maternal education, household income-to-needs ratio, parental occupational prestige, the possession of maternal health insurance, the provision of learning materials, economic strain, residential crowding, neighborhood safety, and maternal depression, anxiety, and somatization. A series of LPA models were estimated from 1- to 6-profile models with varying sets of starting values to determine the model that best captured the distinct profiles of the families so that we ensured global maximum in each solution, 1- to 6-profile solutions (Masyn, Reference Masyn and Little2013). We considered a set of criteria to determine the best fitting model. First, Bayesian information criteria (BIC; Schwartz, Reference Schwartz1978) was used with lower values suggesting better fitting models. Second, we used Vuong–Lo–Mendell–Rubin (VLMR; Vuong, Reference Vuong1989) and Lo–Mendell–Rubin likelihood ratio tests (LMR; Lo, Mendell, & Rubin, Reference Lo, Mendell and Rubin2001). A significant p value of each test indicates that an estimated model with K number of profiles was a better fit compared to a model with K−1 number of profiles (Nylund, Asparouhov, & Muthén, Reference Nylund, Asparouhov and Muthén2007). In addition, entropy (Jedidi, Ramaswamy, & Desarbo, Reference Jedidi, Ramaswamy and Desarbo1993) was used to evaluate the quality of classification, ranging from 0 to 1, with a value at .70 or above indicating a good classification (Reinecke, Reference Reinecke2006). Lastly, we considered the interpretability and conceptual clarity of the profile membership as well as the presence of a reasonable number of individuals assigned to each profile (Jung & Wickrama, Reference Jung and Wickrama2008; Muthén, Reference Muthén2003).
-
Step 2: Latent Growth Curve (LGC) Modeling of EF
Second, an unconditional latent growth curve (LGC) model was estimated to examine linear trajectories of child EF from 36 to 60 months. The LGC for EF was parameterized, such that the intercept of EF represented the level of EF at 36 months and the slope represented the rate of linear change in EF from 36 to 60 months. Next, we conducted a conditional LGC model to investigate whether children would exhibit different patterns of growth in EF in the profiles of early family environments. Using the Wald chi-square tests, we examined whether the intercepts and the slopes of EF in each profile differed across the five profiles.
-
Step 3: Interactions between Early Family Profiles and Maternal Sensitivity in Predicting the Growth of EF
Finally, we tested whether the profiles of early family environments would interact with maternal sensitivity to predict the growth of EF. To examine the interaction models, we adapted the Bolck–Croon–Hagenaars (BCH; Bakk, Tekle, & Vermunt, Reference Bakk, Tekle and Vermunt2013) approach. The BCH method is highly recommended for LPAs with continuous distal outcomes (Asparouhov & Muthén, Reference Asparouhov and Muthén2014) because the BCH method has been found to outperform other approaches where LPAs predict distal outcomes, such as Lanza et al. (Reference Lanza, Tan and Bray2013) and Vermunt's (Reference Vermunt2010) methods (Bakk & Vermunt, Reference Bakk and Vermunt2016). Following Asparouhov and Muthén's (Reference Asparouhov and Muthén2014) three-step BCH method, first, individuals were assigned to a latent profile based on maximum posterior probabilities; second, a LPA model with auxiliary variables (i.e., covariates and distal outcomes) was estimated using BCH weights reflecting the measurement error of the latent profile variable, similar to a multigroup model in structural equation modeling; and third, differences in the means of the covariates and distal outcomes were compared using the Wald chi-square tests. In this study, the interaction between latent profile membership and maternal sensitivity was tested in the multigroup analysis frame. In this multigroup analytic framework, differential associations between maternal sensitivity and child outcomes in distinct profiles indicate a significant interaction between latent profile membership and maternal sensitivity (Cooper & Lanza, Reference Cooper and Lanza2014). The interaction model included a maternal sensitivity at 24 months as the predictor and both the intercept and the slope of EF as the outcomes. A set of covariates such as child sex and race, early cognitive skills, maternal age, and state was also included in the interaction model.
Results
Preliminary analyses
Descriptive statistics and correlations among variables used in the analyses are presented in Table 1. Overall, there were moderate to large correlations (rs = –.33 to .52) among family SES (i.e., maternal marital status, education, income-to-needs ratio, occupational prestige, economic strain, residential crowding) and neighborhood environments variables (i.e., neighborhood safety). However, the possession of maternal health insurance was only correlated with higher occupational prestige and lower economic strain; no correlation was shown between the possession of maternal health insurance and other SES variables or neighborhood environments variables. Among maternal mental health indicators, depression and somatization symptoms were correlated with most of the family SES and neighborhood environments variables, whereas anxiety symptoms were correlated with only economic strain. Higher family SES, except for the possession of health insurance, and neighborhood safety were correlated with higher maternal sensitivity and child EF across 36 and 60 months. Maternal depression and somatization symptoms, but not anxiety symptoms, were negatively correlated with maternal sensitivity at 24 months. Mostly, maternal mental health indicators were uncorrelated with EF measures across 36 and 60 months, while only somatization was negatively correlated with 60-month EF. Maternal sensitivity was positively, moderately correlated with all EF measures from 36 to 60 months.
-
Step 1: Latent Profile Analysis (LPA) to Define Latent Profiles of Early Family Environments
Given statistics on the criteria (for more information, see the Analytic plan section), the five-profile model was selected. As presented in Table 2, the five-profile model showed significant p values of VLMR and LMR, indicating that the five-profile model was better than the four-profile model. Although the six-profile model showed the smallest BIC, the six-profile model showed nonsignificant p values of VLMR and LMR, suggesting that five profiles were sufficient. In addition, the five-profile model showed an entropy value of .79, indicating good classification accuracy. The five-profile model was also interpretable based on prior findings and had a reasonable number of families in each profile.
Fit statistics for LPA models with 1- to 6-class models based on the early family characteristics
Note. LPA = Latent profile analysis; BIC = Bayesian information criteria; VLMR = Vuong–Lo–Mendell–Rubin; LMR = Lo–Mendell–Rubin.
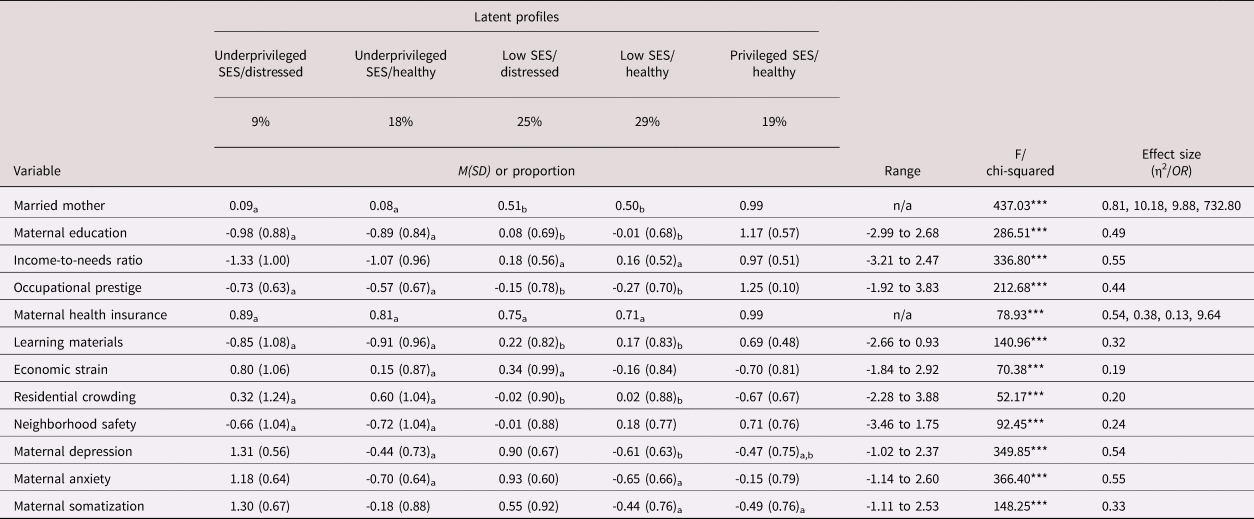
Table 3 presents latent profile prevalences and means/probabilities for the five-profile model. For maternal marital status and the possession of maternal health insurance, we presented probabilities, each of which indicates the proportion of families endorsing a particular response on each item, 0 (e.g., not married or did not have health insurance) and 1 (e.g., married or had health insurance). For the rest of the family environment indicators, means of each indicator were compared using an analysis of variance (ANOVA) shown in Table 3 (the means of raw scores of each continuous indicator are presented in the supplemental materials section). Regarding the effect sizes of binary indicators (Table 3), logistic regression analyses revealed that compared to the Underprivileged SES/distressed profile (reference group), the likelihood of mothers in the Underprivileged SES/healthy being married did not significantly differ, while mothers in the other three profiles were more likely to be married (odds ratios [ORs] = 9.88–732.80; 95% confidence intervals [CIs; 4.98, 2721.40]). Also, relative to the Underprivileged SES/distressed profile (reference group), the likelihood of mothers in the Underprivileged SES/healthy profile having health insurance did not significantly differ, while mothers in the Low SES/distressed and Low SES/healthy profiles were less likely to have health insurance (ORs = 0.31–0.38, 95% CIs [0.17, 0.73]) and mothers in the Privileged SES/healthy profile were more likely to have health insurance (OR = 9.64, 95% CI [2.66, 14.43]). Moreover, the analyses demonstrated significant differences among the profiles on the continuous indicators. Effect sizes for group differences ranged from 0.20 to 0.55, all of which indicate large effect sizes (Cohen, Reference Cohen1988).
Mean/probability Comparisons of Early Family Environments Indicators between Profiles
Note. For the two binary indicators, married mothers and maternal health insurance, the proportions of mothers being married and having health insurance were presented; for the rest of the family environment indicators, standardized means are presented; differing subscripts within rows indicate significantly different means at p < .05; for the effect sizes of the two binary indicators, we presented odds-ratios indicating the likelihood of mothers endorsing a particular response on each binary item (i.e., married, having insurance) depending on their profile membership, using the Underprivileged SES/distressed profile as a reference group; the means of raw scores of each indicator are found in the supplemental materials section.
***p < .001.
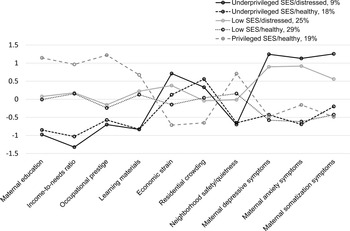
In addition, characteristics of the family environment indicators in each profile, except for maternal marital status and health insurance, are presented in Figure 1. Figure 1 presents two profiles of families with highly disadvantaged SES and very low neighborhood safety, each of which showing low or high levels of maternal mental health symptoms, and the other two profiles with relatively disadvantaged SES and lower neighborhood safety, each of which showing low or high levels of maternal mental health symptoms. The last profile is characterized by advantaged SES, high neighborhood safety, and low maternal mental health symptoms.
Means of the continuous indicators of early family characteristics for each identified profile. All the continuous indicators presented were standardized. The y-axis indicates the mean scores of the indicators shown on the x-axis. The two categorical indicators of family characteristics were not presented in this figure but presented in Table 3.

Specifically, the Underprivileged SES/distressed profile (9%) consisted of families with very low levels of SES and neighborhood safety, and higher levels of maternal mental health symptoms. Mothers in this profile had the lowest rate of being married among the five profiles. These mothers had attained 12 years of education on average and their average income-to-needs ratio was 0.46. They also showed average T scores of 59.26 for depression, 57.45 for anxiety, and 61.57 for somatization, each of which was slightly to moderately below the clinical cut-off of 63. The Underprivileged SES/healthy profile (18%) showed a similar pattern to the Underprivileged SES/distressed profile in terms of family SES, neighborhood environments, and maternal marital status. Mothers in the Underprivileged SES/healthy profile had 12 years of education on average and their average income-to-needs ratio was 0.60. In addition, the Underprivileged SES/healthy profile showed lower levels of economic strain and maternal mental health symptoms (T scores for depression = 43.42; anxiety = 40.86; somatization = 47.43) than the Underprivileged SES/distressed profile. The Underprivileged SES/distressed and Underprivileged SES/healthy profiles had the lowest rates of married mothers among the five profiles, 9% for each.
The Low SES/distressed profile (25%) was characterized by relatively low levels of SES and neighborhood safety but higher levels of maternal mental health symptoms (T scores of depression = 54.27; anxiety = 54.39; somatization = 53.74). Those mothers had attained 15 years of education on average and their average income-to-needs ratio was 1.80. Next, the Low SES/healthy profile (29%) was the largest profile, characterized by relatively low levels of SES and neighborhood safety, and lower levels of maternal mental health symptoms (T score Ms for depression = 42.32; anxiety = 41.30; and somatization = 45.48). Mothers in this profile had attained 14 years of education on average and their income-to-needs ratio was 1.72 on average. The Low SES/distressed and Low SES/healthy profiles had 51% to 52% of married mothers, which was higher than the two Underprivileged SES profiles.
Lastly, the Privileged SES/healthy profile (19%) had the highest levels of SES and the quality of neighborhood environments, the highest rate of married mothers among the five profiles (99%), and lower levels of depression, anxiety, and somatization symptoms (Ms of T scores = 43.26, 44.82, 45.13, respectively). In this profile, mothers had attained 18 years of education on average and an average income-to-ratio of 4.02. Also, mothers in this profile were more likely to have health insurance (99%), while mothers in the other four profiles did not show a difference in the rate of having health insurance among the four profiles. Unlike depression and somatization symptoms, mothers in this profile showed relatively higher levels of anxiety than the other two healthy profiles, Underprivileged SES/healthy and Low SES/healthy.
-
Step 2: Latent Growth Curve (LGC) Modeling to Examine the Growth of Child EF
Unconditional LGC of EF
We estimated an unconditional linear LGC model of EF measures across 36, 48, and 60 months. The model was parameterized, such that the intercept term represented EF at 36 months and the slope represented rates of change in EF levels from 36 to 60 months. This model fit the data well, χ2(1) = 0.017, p = .90; comparative fit index (CFI) = 1.00; root mean square error of approximation (RMSEA) = 0.00, 90% CI [0.00, 0.04]. The intercept (unstandardized μInt = −0.56, SE = 0.02; standardized μInt = −1.55, both at p < .001) and the slope (unstandardized μSlope = 0.42, SE = 0.01; standardized μSlope = 2.16, both at p < .001) factors were significant. The model also showed the significant variance of the intercept (unstandardized φInt = 0.13, SE = 0.02, p < .001) and the slope (unstandardized φSlope = 0.04, SE = 0.01, p < .001). These results indicate that children showed variability of the 36-month EF assessment and EF skills increased from 36 to 60 months in a linear fashion with variability of the rate of change. The intercept and slope terms were negatively correlated (unstandardized φInt,Slope = −0.02, SE = 0.01, p = .02; standardized φInt,Slope = −0.27, p = .001), indicating that children with higher levels of EF at 36 months had slower growth in EF from 36 to 60 months. This model accounted for 43% of the variance in EF at 36 months, 49% at 48 months, and 89% at 60 months.
Early family profiles predicting the intercept and growth of EF
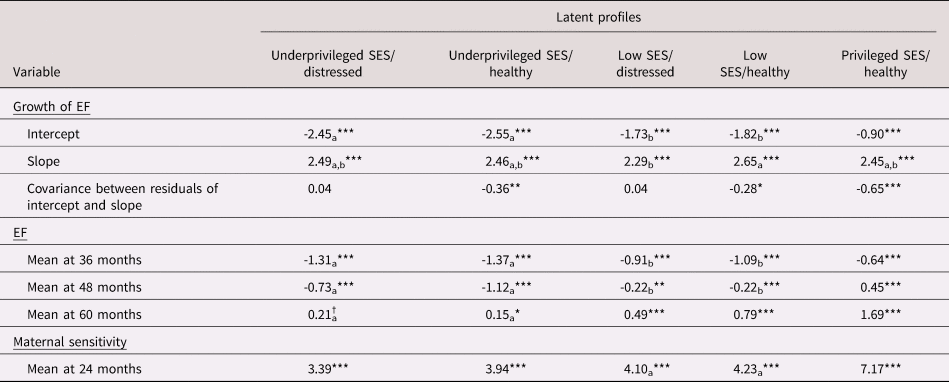
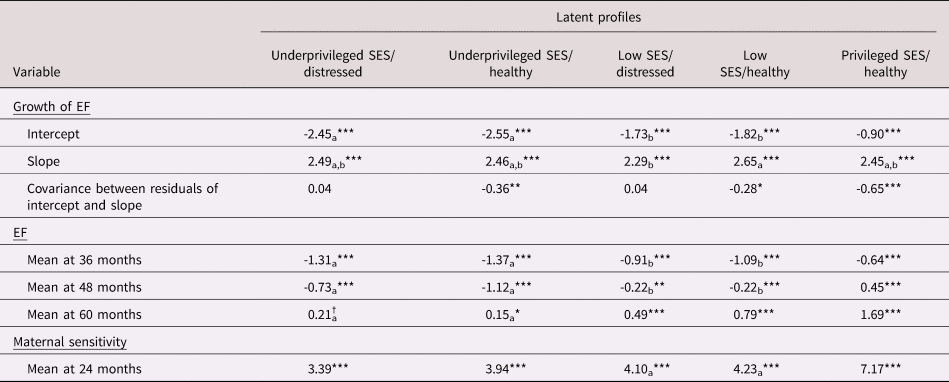
A conditional LGC model of EF measures was estimated to test whether children would exhibit distinct developmental trajectories of EF in the five profiles. As presented in Table 4, the intercepts and the slopes as well as the variances of the intercepts and the slopes for all profiles were significant. In regard to the intercepts of EF, children from the Underprivileged SES/distressed (standardized μInt = −2.45, p < .001) and Underprivileged SES/healthy (standardized μInt = −2.55, p < .001) profiles showed lower levels of EF at 36 months (i.e., EF intercept) than those from the Low SES/distressed (standardized μInt = −1.73, p < .001), Low SES/healthy (standardized μInt = −1.82, p < .001) and Privileged SES/healthy (standardized μInt = −0.90, p < .001) profiles. Furthermore, children from the Low SES/distressed and Low SES/healthy profiles exhibited lower levels of the EF intercept (i.e., EF at 36 months) than those from the Privileged SES/healthy profile. However, children in the two underprivileged SES profiles did not show differences in the EF intercept. Similarly, children in the two low SES profiles did not differ in the EF intercept.
Early Family Profiles Predicting Developmental Trajectories of EF and Maternal Sensitivity
Note. Standardized coefficients are presented; differing subscripts within rows indicate statistically different levels of the intercepts and slopes of EF, the means of EF, or the means of maternal sensitivity at p < .05; unstandardized results are found in the supplemental materials section.
† p < .10; *p < .05; **p < .01; ***p < .001.
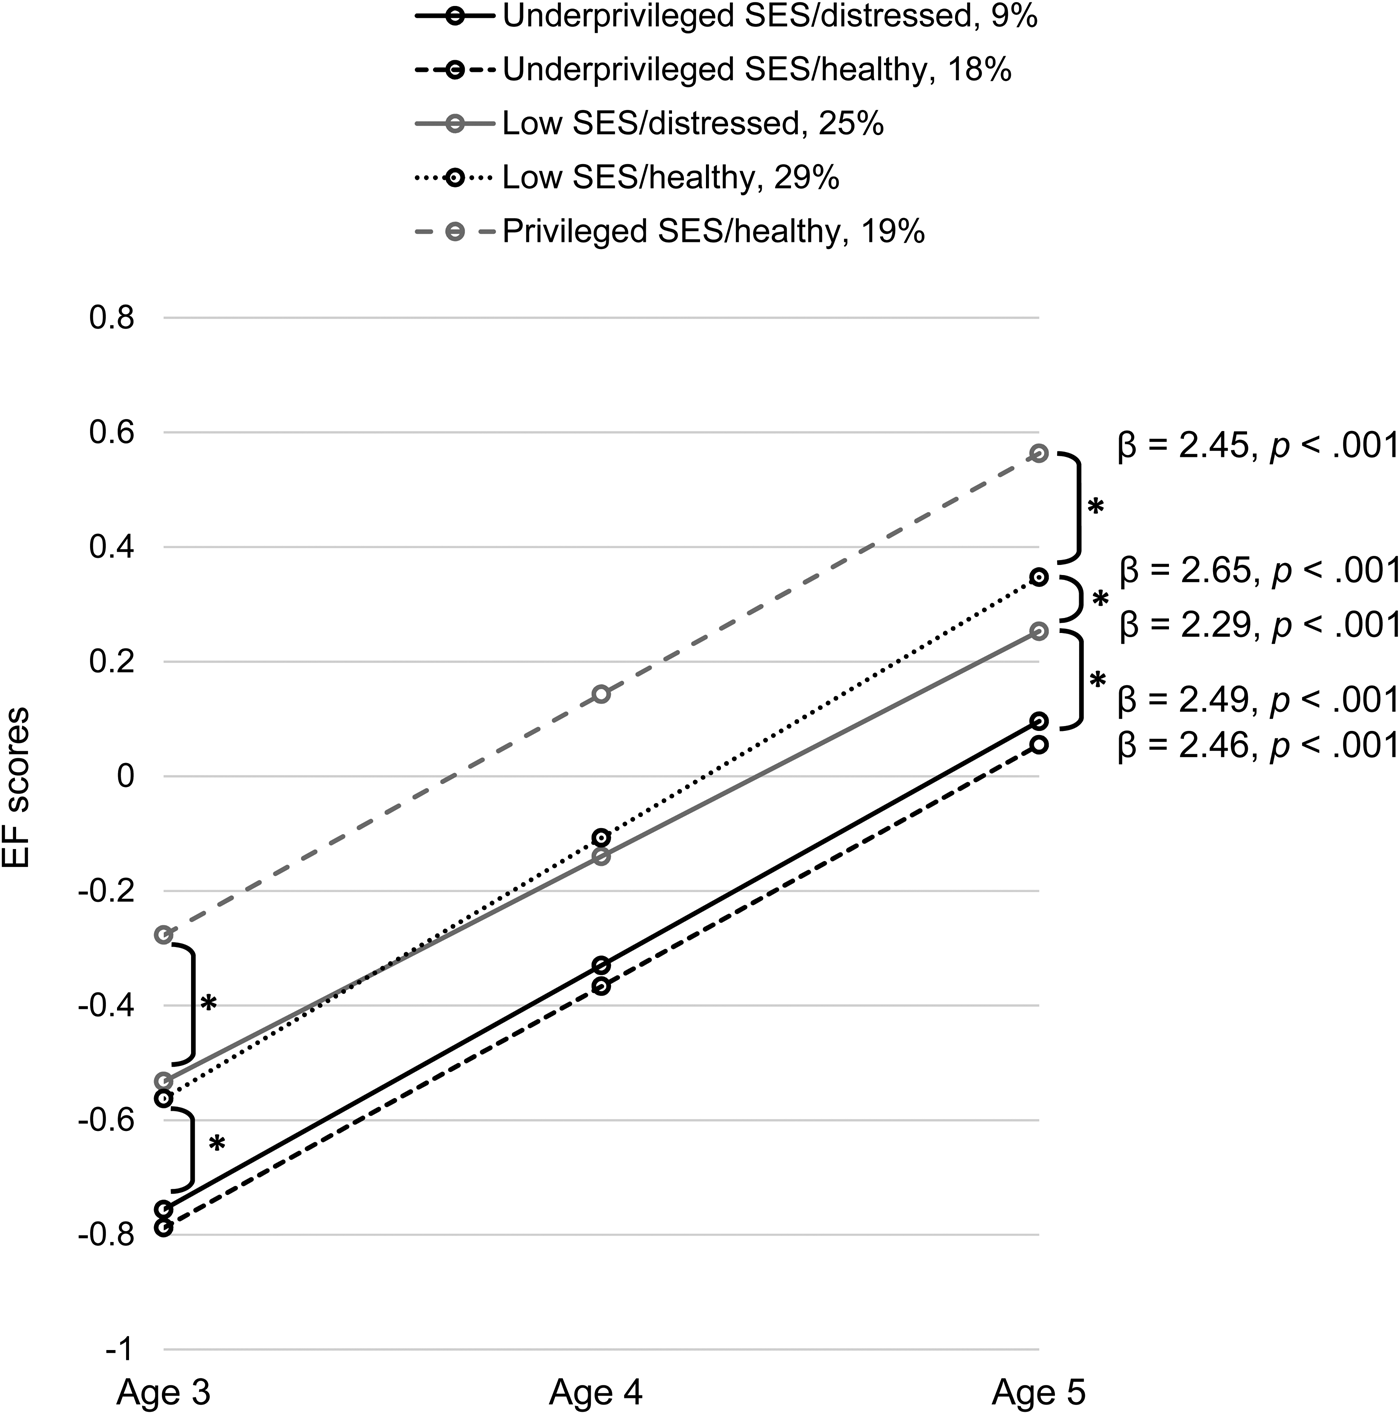
Regarding differences in the slope in each profile, as presented in Figure 2, children in the Low SES/healthy profile showed faster growth of EF from 36 to 60 months (standardized μSlope = 2.65, p < .001) than those in the Low SES/distressed (standardized μSlope = 2.29, p < .001) profile. However, the growth rate of EF in the Low SES/healthy profile was not significantly higher than that of other profiles, including the Underprivileged SES/distressed, Underprivileged SES/healthy, and Privileged SES/healthy profiles. Similarly, the growth rate of EF in the Low SES/distressed profile was not significantly lower than that of the other three profiles.
Developmental trajectories of executive function (EF) across profiles. Standardized coefficients for the growth rates of EF in each profile are presented. The growth rates of EF significantly differed in the Low socioeconomic status (SES)/healthy and Low SES/distressed profiles at p < .05. An asterisk represents a significant difference in the EF scores at age 3 or at age 5 between profiles at p < .05.

In addition, the mean differences in EF at 36 and 48 months indicate that children in the Low SES/distressed and Low SES/healthy profiles did not differ in terms of EF at 36 or 48 months (Table 4). However, as shown in Figure 2, children in the Low SES/healthy profile showed a faster increase in EF from 36 to 60 months than those in the Low SES/distressed profile, and at 60 months, children in the Low SES/healthy profile outperformed those in the Low SES/distressed profile in the EF tasks. At 60 months, children in the Privileged SES/healthy profile showed the highest level of EF (standardized M = 1.69), those in the Low SES/healthy profile showed the second highest (standardized M = 0.79), and those in the Low SES/distressed profile showed the third highest (standardized M = 0.49) among the five profiles (Figure 2). Children in the Underprivileged SES/healthy and Underprivileged SES/distressed profiles showed the lowest level of EF at 60 months among the five profiles, with no significant difference in 60-month EF scores between them (standardized Ms = 0.21, 0.15, respectively).
-
Step 3: Interactions between Early Family Environment Profiles and Maternal Sensitivity in Predicting the Growth of EF
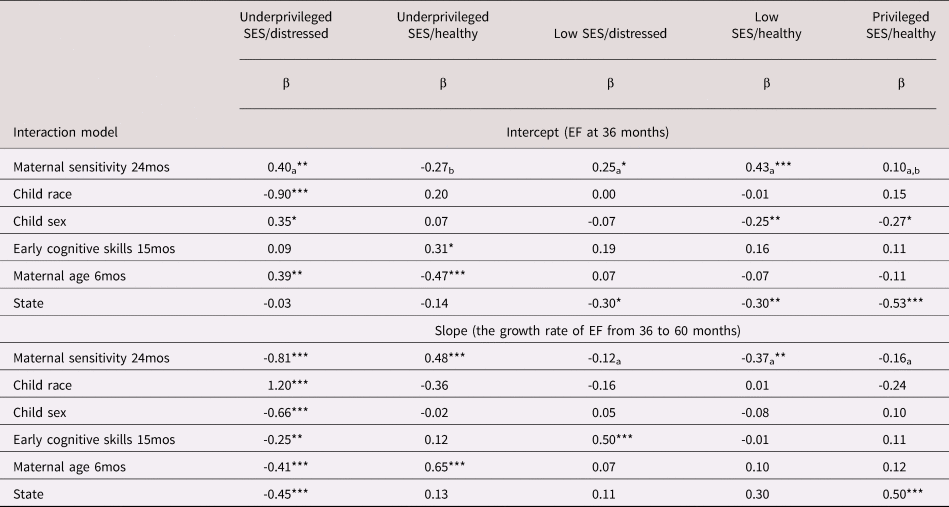
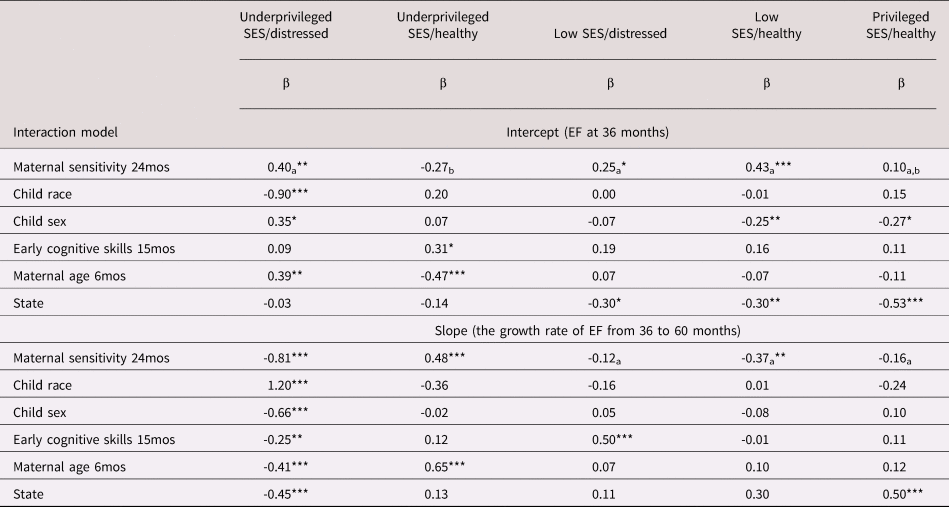
Interactions between early family profiles and maternal sensitivity in predicting the growth of EF were estimated. As shown in Table 5, the intercept and the slope of EF were regressed on maternal sensitivity and a set of covariates in each profile. Each coefficient represented the directions of the regression coefficients. In the interaction model, nonsignificant residual correlations between the intercept and the slope of EF in each profile were fixed to zero, only the significant residual correlation was estimated. Prior to interaction tests, we investigated whether maternal sensitivity scores at 24 months differed in distinct family profiles (at p < .05). As shown in Table 4, among the five profiles, mothers in the Privileged SES/healthy profile showed the highest sensitivity (unstandardized M = 4.04, var = 0.32). Mothers in the Low SES/healthy (unstandardized M = 3.30, var = 0.61) and Low SES/distressed (unstandardized M = 3.28, var = 0.64) profiles showed the second highest level of sensitivity, with no statistically significant difference in sensitivity between the profiles. Mothers in the Underprivileged SES/healthy profile (unstandardized M = 2.88, var = 0.54) showed the third highest level of sensitivity, and those in the Underprivileged SES/distressed (unstandardized M = 2.54, var = 0.56) showed the lowest level of sensitivity.
Interactions between Early Family Profiles and Maternal Sensitivity predicting the Growth of Child EF
Note. mos = months; child race was coded as 0 = White and 1 = Black; child sex was coded as 0 = female and 1 = male; state was coded as 0 = PA and 1 = NC; for coefficients where maternal sensitivity predicting the intercept and the slope of EF, differing subscripts within rows indicate significantly different coefficients at p < .05; unstandardized results are found in the supplemental materials section.
*p < .05; **p < .01; ***p < .001.
In regard to the interaction model, as shown in Table 5, in the Underprivileged SES/distressed profile, higher levels of maternal sensitivity at 24 months predicted higher levels of child EF at 36 months (β = 0.40, p = .007) and slower growth of EF from 36 to 60 months (β = −0.81, p < .001), respectively. In the Underprivileged SES/healthy profile, maternal sensitivity was associated with a faster increase in EF from 36 to 60 months (β = 0.48, p < .001) but was not related to EF at 36 months (β = −0.27, p = .07). In the Low SES/distressed profile, higher maternal sensitivity at 24 months predicted higher EF at 36 months (β = 0.25, p = .014) but was unrelated to the slope of EF from 36 to 60 months (β = −0.12, p = .40). In the Low SES/healthy profile, higher maternal sensitivity at 24 months predicted higher EF at 36 months (β = 0.43, p < .001) and slower growth of EF from 36 to 60 months (β = −0.37, p = .02). For children in the Privileged SES/healthy profile, maternal sensitivity at 24 months predicted neither the intercept of EF (36 months) nor the slope of EF from 36 to 60 months. In addition, Table 5 presents differences in coefficients in which maternal sensitivity predicted the intercept and the slope of EF in distinct profiles. The association between maternal sensitivity and EF intercept in the Underprivileged SES/healthy profile was statistically smaller than those associations in the other three disadvantaged profiles (Underprivileged SES/distressed, Low SES/distressed, Low SES/healthy) but was not significantly different from the association in the Privileged SES/healthy profile. Relative to differences in coefficients for the intercept, differences in coefficients predicting the slope of EF were more salient in distinct profiles (Table 5). Specifically, in the Underprivileged SES/distressed profile, the association between sensitivity and EF slope was the strongest in the negative direction among the five profiles. In contrast, this association was the strongest in the positive direction in the Underprivileged SES/healthy profile among the five profiles.
Discussion
The current study advances our understanding of how early-life adversity impacts the growth of EF and how maternal sensitivity plays a protective role in the growth of EF in the context of early familial risk. We proposed that early family characteristics may not be sufficiently represented by one or two types of early-life adversity and hypothesized that the consideration of different types of risks would provide a more comprehensive, deeper understanding of the potential beneficial or detrimental effects early risks have on the development of EF. In addition, we proposed that maternal sensitivity would promote the initial EF and/or the growth rate of EF in various risk profiles but not in a low-risk profile. In this, our hypotheses were generally confirmed for the initial levels of EF; however, our findings of the effects of maternal sensitivity on the growth of EF demonstrate somewhat complex and mixed. We identified five family profiles primarily differentiated by varying levels of SES, neighborhood environments, and maternal mental health. Furthermore, in the low-risk family profile, as hypothesized, maternal sensitivity did not appear to promote EF at age 36 months or the growth of EF between 36 and 60 months. Among the higher risk profiles, positive effects of maternal sensitivity were consistently seen on the EF intercept in the three risk profiles and the faster growth of EF in one risk profile. As such, the novel contributions of this study are in identifying differential patterns of growth in EF in distinct family risk profiles, and in the indication that the protective role of maternal sensitive caregiving in promoting children's early EF or the growth of EF may not be the same in different profiles. This nuanced understanding of the role of maternal sensitivity on child EF extends the risk-protective framework (Masten et al., Reference Masten, Best and Garmezy1990) by demonstrating that maternal sensitivity fosters the resilience of children and, in turn, promotes early EF or the growth of EF, primarily for children who live in disadvantaged environments. More importantly, these processes may differ among children living in various disadvantaged contexts, characterized by differential combinations of SES, neighborhood, and maternal mental health symptoms.
Early family profiles of SES and maternal mental health
In support of our hypothesis, five distinct profiles were identified from indicators of SES, neighborhood environments, and maternal mental health symptoms. Families in four of the identified profiles were considered poor, ranging from moderate to deep poverty. Patterns of profiles are largely consistent with a prior analysis using a number of overlapping variables from the data analyzed in the present study (Rhoades et al., Reference Rhoades, Greenberg, Lanza and Blair2011). That analysis also found one low-risk profile, with the majority of profiles characterized by manifestations of risk associated with SES. That prior analysis is not directly comparable to ours given that the authors created a cut-score of 1.5 for household income-to-needs ratio and considered families below that threshold to be in poverty. However, similar to profiles identified in the present study, prior work using a person-centered approach, including Rhoades et al. (Reference Rhoades, Greenberg, Lanza and Blair2011), has found an advantaged profile with high SES and fewer maternal mental health symptoms, such as our Privileged SES/healthy profile, and also a disadvantaged profile with low SES and maternal mental health risks, such as our Underprivileged/distressed profile (Ku et al., Reference Ku, Feng, Hooper, Wu and Gerhardt2019). In addition, we found profiles with more and less pronounced SES risk in the relative absence of maternal mental health risk (i.e., Underprivileged SES/healthy, Low SES/healthy) and a profile with maternal mental health risk and less pronounced SES risk (i.e., Low SES/distressed). In this, our findings are consistent with prior studies identifying profiles below average SES with fewer or greater maternal mental health symptoms (Ku et al., Reference Ku, Feng, Hooper, Wu and Gerhardt2019; Pratt et al., Reference Pratt, McClelland, Swanson and Lipscomb2016). Furthermore, consistent with the extant literature, we found that multiple mental health symptoms tend to co-exist (Kaufman & Charney, Reference Kaufman and Charney2000; Rief et al., Reference Rief, Hennings, Riemer and Euteneuer2010), as mothers in the distressed profiles reported higher levels of symptoms in all three types of mental health examined here: depression, anxiety, and somatization.
Early family profiles and developmental trajectories of EF
Our findings on the differential associations between family profile membership and EF are in support of Bridgett et al.'s (Reference Bridgett, Burt, Edwards and Deater-Deckard2015) developmental framework for self-regulation, suggesting that both a proximal (e.g., maternal mental health) and broader (e.g., SES, neighborhood) context can shape the development of EF. Expanding this framework, our analysis using a person-centered approach provides a more nuanced understanding of the interactive nature of SES, neighborhood environments, and maternal mental health in shaping early EF, as well as trajectories of EF during the preschool period.
All children showed substantial linear growth in EF from 36 to 60 months, regardless of differential levels of initial EF between risk profiles. This is in line with prior findings using measures from the data analyzed in the current study (Blair et al., Reference Blair, Kuzawa and Willoughby2020; Kuhn et al., Reference Kuhn, Willoughby, Vernon-Feagans and Blair2016; Willoughby et al., Reference Willoughby, Wirth and Blair2012), as well as those derived from other datasets (Bindman et al., Reference Bindman, Hindman, Bowles and Morrison2013; Hughes et al., Reference Hughes, Ensor, Wilson and Graham2010; Hughes & Ensor, Reference Hughes and Ensor2011). Unlike our findings on initial EF levels, which indicate initial EF is primarily shaped by SES-related indicators, results for EF growth may suggest that the rate of change in EF during the preschool years may not differ by SES, but may be meaningfully affected by maternal mental health. Specifically, we found that children in the low SES/healthy profile showed a faster increase in EF during the preschool years than the Low SES/distressed profile. Accordingly, mean differences in 60-month EF between profiles demonstrate that children in the Low SES/healthy profile outperformed those in the Low SES/distressed profile in EF at the transition to elementary school, although these two groups started off at equivalent levels of EF at the beginning of the preschool period.
Although there was a significant difference in the rate of change in EF growth between the two low SES profiles, overall, the coefficients predicting the EF slope among the five profiles were similar. This indicates that for most children, the gap in early EF, possibly caused by differing combinations of early adverse environments, may persist through early childhood, unless they have mentally healthy mothers in the context of moderately disadvantaged SES/moderate levels of neighborhood violence. Specifically, the effect of positive maternal mental health was not observed in the Underprivileged/healthy versus Underprivileged/distressed profiles, seemingly indicating that the context of deep poverty is not easily overcome by maternal mental health. Furthermore, scores for depression and somatization were significantly higher in the Underprivileged SES/healthy profile compared with the Low SES/healthy profile. This finding would seem to indicate that moderate socioeconomic deprivation can negatively affect the early status of EF; however, mentally healthy mothers facing moderate risk associated with SES may be able to find ways to promote the development of EF in their young children. The promotive role of maternal mental health in our findings is also in line with prior evidence that positive maternal mental health facilitates the growth rate of cognitive development (Azak, Reference Azak2012). Expanding Azak's findings, we have provided further evidence that children with mentally healthy mothers may show the faster growth rate of EF in the context of disadvantaged SES/neighborhood environments.
Interactions between early family profiles and maternal sensitivity in predicting developmental trajectories of EF
The second aim of this study was to identify different patterns of associations between maternal sensitivity and the growth of EF across profiles. Consistent with our hypothesis that the protective role of maternal sensitivity against early adversity would be more important in the presence of environmental adversity, our results show that maternal sensitivity may affect initial EF levels and/or rates of change in EF in profiles with SES risk, maternal mental health risk, or both. In contrast, in the most advantaged profile, Privileged SES/healthy, maternal sensitivity predicted neither initial EF nor the rate of change in EF. In addition, as expected, maternal sensitivity differed among the risk profiles. The Privileged SES/healthy profile exhibited the highest level of maternal sensitivity followed by the Low SES/healthy and Low SES/distressed profiles, which were statistically identical, the Underprivileged SES/healthy profile, and the Underprivileged SES/distressed profile in which maternal sensitivity was the lowest.
Differences in maternal sensitivity among the profiles, particularly between the Underprivileged SES/healthy and the Underprivileged SES/distressed profiles, are important for the interpretation of our effects. Specifically, maternal sensitivity was not related to initial EF but was associated with faster growth of EF from 36 to 60 months in the Underprivileged SES/healthy profile. This finding indicates that maternal sensitivity for children in poverty might promote the growth of EF during the preschool period. A similar pattern has been found in prior research involving older children, such that sensitive parenting at 54 months was not associated with EF at Grade 1 but was associated with faster growth in EF from Grade 1 to 5 (Friedman et al., Reference Friedman, Scholnick, Bender, Vandergrift, Spieker and Hirsh Pasek2014). Notably, our findings indicate that the compensatory effect on EF growth is only seen among children of mentally healthy mothers in the context of deep poverty. This might be due to these mothers being more emotionally available and attentive to their relationship with the child, potentially buffering some of the effects of socioeconomic deprivation on the child's development. As such, our findings are consistent with a compensatory framework in which environmental adversity prompts mothers to exert high-quality parenting as a means to offset risk for children growing up in disadvantaged environments (Meins, Centifanti, Fernyhough, & Fishburn, Reference Meins, Centifanti, Fernyhough and Fishburn2013; Oxford & Lee, Reference Oxford and Lee2011). The ongoing investigation of factors associated with sensitive parenting in the context of deep poverty is a high priority. Our analysis can shed no light on these factors; however, findings from the current study extend the protective role of maternal sensitivity to the growth of EF during the preschool years among children exposed to different conditions of life-adversity, in particular risk associated with SES. It is especially important to identify protective factors to support EF during this period, because the preschool period represents a time of tremendous potential growth in EF (Anderson, Reference Anderson2002).
In the other three risk profiles, maternal sensitivity predicted higher initial EF and in two profiles, slower growth of EF from 36 to 60 months. The effect of maternal sensitivity on the initial levels of EF is in line with prior theoretical (Masten et al., Reference Masten, Best and Garmezy1990) and empirical work (Grant et al., Reference Grant, McMahon, Reilly and Austin2010; Manning, Davies, & Cicchetti, Reference Manning, Davies and Cicchetti2014; Meins et al., Reference Meins, Centifanti, Fernyhough and Fishburn2013; NICHD ECCRN, 1999; Oxford & Lee, Reference Oxford and Lee2011) suggesting the protective role of maternal sensitivity in the development of cognitive and social–emotional functioning at one point in time during early and middle childhood. However, in these three risk profiles, maternal sensitivity failed to promote the growth of EF. In the Underprivileged SES/distressed profile, maternal sensitivity positively predicted the EF intercept at 36 months but negatively predicted growth in EF between 36 and 60 months. In the Low SES/distressed profile, maternal sensitivity positively predicted higher initial EF, but failed to predict the growth rate of EF. These findings suggest that mothers with substantial maternal mental health symptoms in the context of moderate to deep poverty may be unable to support the growth of the child's EF through maternal sensitivity.
Our analyses also showed that mothers in the Underprivileged SES/distressed profile exhibited the lowest levels of maternal sensitivity among the profiles and the highest levels of mental health risk. In the Low SES/distressed profile, however, maternal sensitivity was equivalent to the Low SES/healthy profile but was unrelated to growth in EF. Mothers in this profile also exhibited lower levels of mental health symptoms. In the Low SES/healthy profile, maternal sensitivity predicted higher initial EF and slower growth in EF from 36 to 60 months. As expected, the association between maternal sensitivity and initial EF indicated that maternal sensitivity may be a key predictor for early EF (Bernier et al., Reference Bernier, Carlson and Whipple2010). Furthermore, EF at child age 60 months was significantly higher in the Low SES/healthy profile than in the other three risk profiles. It is unclear, however, why maternal sensitivity did not promote growth in EF in this profile given that mothers in this profile exhibited low rates of depression, anxiety, and somatic symptoms. Further analyses with this and other datasets are needed to fully understand the positive effect of maternal sensitivity in these profiles on the intercept but not the slope in this analysis.
Limitations and future directions
Although this study has notable strengths, including its longitudinal design and focus on a pressing issue, namely the effect of risk associated with SES and with maternal mental health on the development of EF in the preschool period, our findings should be interpreted in the context of study limitations. The primary limitation is the generally descriptive nature of our primary analysis technique, LPA. Importantly, however, we hypothesized that profiles would be differentiated by maternal mental health, identifying groups in deep poverty and near poverty that were differentiated by maternal depression, anxiety, and somatic symptoms. Second, although the present study included extensive indicators of early life adversity that could influence the growth of EF, it focused on maternal behavior at a single time point as a protective factor. We opted for temporal precedence in the relation of maternal sensitivity to child EF under the assumption of stability in maternal sensitivity as children age through the preschool years. However, there is evidence that psychological environments created by mothers change over time as mothers’ mental health symptoms fluctuate with implications for sensitive caregiving during early childhood (Campbell et al., Reference Campbell, Matestic, von Stauffenberg, Mohan and Kirchner2007). The consideration of potential change in maternal mental health and sensitivity over time in distinct subgroups may enhance existing knowledge about how changing environments during early childhood would differentially contribute to trajectories of EF in distinct subgroups. Finally, although our sample was representative of the regions from which the sample was drawn, the predominantly low-income and nonurban nature of these regions likely limits the generalizability of our findings.
Conclusions
The current study advances our understanding of developmental trajectories of EF in early childhood within proximal processes by which multiple types of early life adversity influence the growth of EF. In particular, a person-centered approach reveals that certain combinations of early risks might be more detrimental to initial EF and/or the rate of EF development. In addition, our analysis demonstrates that maternal positive parenting may play a protective role in the development of initial EF and the growth rate of EF among underserved families. More importantly, our analyses using a person-centered approach with various different types of early caregiving environments provide a more nuanced understanding of the role of maternal sensitivity in EF growth among children living in diverse caregiving contexts. Our findings also indicate that maternal sensitivity may increase resilience of children, especially those who are vulnerable to deficits in EF during the preschool period, which is an important predictor for a wide range of subsequent social–emotional and academic outcomes. Finally, findings from the present study have implications for interventions to promote early EF as well as the growth rate of EF from the beginning of the preschool period through the transition to school. They suggest that it is important to consider maternal mental health and maternal sensitivity components in intervention programs designed to promote the development of child EF in various family contexts with differing levels of SES.
Supplementary material
The supplementary material for this article can be found at https://doi.org/10.1017/S0954579421000535
Acknowledgments
We would like to express our gratitude to all of the families, children, and teachers who participated in this research and to the FLP research assistants for their hard work and dedication to the FLP. This study is part of the FLP (https://flp.fpg.unc.edu/).
Funding Statement
This research was supported by a grant from the National Institute of Child Health and Human Development, P01HD039667. Co-funding was provided by the National Institute of Drug Abuse, NIH Office of Minority Health, National Center on Minority Health and Health Disparities, and the Office of Behavioral and Social Sciences Research. This research was also supported by a grant from NICHD R01HD51502 and from the NIH Office of the Director, UG3OD023332 and UH3OD023332.
Conflicts of Interest
None.