

1. Introduction
Rapid change in the nature of economic institutions among countries in the 20th century was the rule. The turn of the century saw the first age of globalization, followed by the rise of socialism and fascism, and later, the development of the modern welfare state. For much of second half of the century, the developing world was polarized between allying with the United States or the Soviet Union, while, at least superficially, adopting the economic model of its clique. And although countries allied with the West maintained the veneer of liberalism, many also dabbled in central planning up until the return to liberal economic doctrines, beginning in the 1970s. But the story of the historical development of institutions is not just one of liberalism versus socialism, as this period also saw state building and modernization, not merely differences in degrees of interventionism.
This paper will examine recent developments and patterns in economic institutions worldwide since 2000. It can be read side by side with the quickly developing recent literature on the current decline in the quality of political institutions. Contrasting specifically with the triumphalism of Fukuyama (Reference Fukuyama1992), this barrage of literature has described the decline in democratic political institutions both in the West and throughout the world (The Economist, 2014; Kurlantzick, Reference Kurlantzick2013; Levitsky and Ziblatt, Reference Levitsky and Ziblatt2018; Mounk, Reference Mounk2018; Runciman, Reference Runciman2018; Snyder, Reference Snyder2017), as well as a decline in liberalism in a broader sense (Deneen, Reference Deneen2018; Goldberg, Reference Goldberg2018; Lilla, Reference Lilla2017; Luce, Reference Luce2017). This includes concern expressed by Fukuyama himself (Reference Fukuyama2018). Strangely, this literature has appeared at the same time as several works that advocate a broad optimism regarding the state of the modern world, often with reference to the strong performance of our institutions (McCloskey, Reference McCloskey2010; Pinker, Reference Pinker2018; Ridley, Reference Ridley2010; Rosling et al., Reference Rosling, Rosling Ronnlund and Rosling2018).
Most recent works considering our economic institutions tend to be pessimistic, whether those works are in reference to economic liberalization (Boudreaux, Reference Boudreaux2015; Cachanosky and Padilla, Reference Cachanoksy and Padillaforthcoming; Murphy, Reference Murphy2015; c.f. Olson, Reference Olson1982) or state building (Andrews et al., Reference Andrews, Pritchett and Woolcock2017; Fukuyama, Reference Fukuyama2014). The conclusions expressed here will be modestly more optimistic. The closest recent scholarship to this paper is Sobel (Reference Sobel2017), though Sobel focuses solely on economic liberalization and considers a much longer period. More specifically, Sobel evaluates the distribution of changes in economic freedom over time, concluding that liberalization occurs slowly, while de-liberalization can happen rapidly, and that improvements in the freedom to trade internationally predict other liberalizations.
To measure changes in economic institutions, this paper will make use of two indexes, the Economic Freedom of the World index (Gwartney et al., Reference Gwartney, Lawson, Hall and Murphy2018) and the “State Economic Modernity” index (Murphy, Reference Murphy2019), the latter of which was derived from data found in the former. The Economic Freedom of the World index captures the degree of liberalization a country undergoes, while the state economic modernity index captures the extent to which a country has built a powerful and capable state. This latter index measures something similar conceptually to state capacity, but it is more concrete and more greatly reflects the extent to which a country has economic institutions commonly associated with social democracy. Section 2 will describe each index at length.
To illustrate recent changes in economic institutions, I will make use of the two indexes in concert with one another, qualitatively characterizing changes in economic institutions formulaically. Notably, for instance, when both Economic Freedom of the World and “state economic modernity” increase significantly in a country, I will use Fukuyama's (Reference Fukuyama2011) phrase, “getting to Denmark,” to describe it; when a country is both liberalizing and state building, it is making a movement toward the (economic) institutional frontier. While the way I classify countries is hardly analytically complex, the structure and results are intuitive and useful, and one of the contributions of this paper.
I complete my empirical investigation with a conclusion that the world has institutionally stagnated, but in such a way that provides grounds for optimism. While many have already expressed pessimism about the prospects of either liberalization or state building, most regions and income groups of countries have continued liberalizing, with the top income group merely stagnating, not falling. All this is in the context of strong headwinds against the prospects for positive reform. While state economic modernity is stagnant across regions and across income groups, there is heterogeneity across countries, suggesting the possibility for improvements to occur in the aggregate in the future. In terms of individual countries, I find that Rwanda deserves its accolades for its improvements in its institutional environment, at least economically speaking.Footnote 1 Other countries that have made serious movements toward “getting to Denmark” over the 2000–2016 period – directionally if not in level – are the Democratic Republic of the Congo, Benin, Indonesia, and Guinea-Bissau. No country has moved away from Denmark in the same manner that those five countries have moved toward Demark. If we loosen definitions, however, Venezuela and Syria are the two countries that have done the most to destroy their economic institutions since 2000.
The structure of this paper follows. Section 2 describes Economic Freedom of the World and the “State Economic Modernity” indexes at length. Section 3 undertakes several empirical exercises to understand the nature and patterns of the development of economic institutions since the turn of the new millennium. In the course of doing this, Section 3 creates a set of eight possible classifications of institutional change. The empirics are descriptive, making no claims of causality. Section 4 concludes.
2. Data description
The Economic Freedom of the World (EFW) index (Gwartney et al., Reference Gwartney, Lawson, Hall and Murphy2018) quantifies the economic institutions of classical liberalism, categorizing rules, laws, policies, and other institutional measures into five “areas” – [Limited] Size of Government, Legal System and Property Rights, Sound Money, Freedom to Trade Internationally, and Regulation, each scored on a 0–10 scale and averaged. The index provides data every five years from 1970 to 2000, and yearly from 2000 up through 2016. Country coverage is sparse in early years in the index, but in its most recent iteration, 162 countries are scored. The index makes use of 43 different variables, the vast majority of which come from third-party sources, as documented in the publication's appendix. The most recent significant change to the index occurred in 2017 when a downwards adjustment to reflect the presence of institutionally disparate treatment of women was implemented (see Fike, Reference Fike2016).
Because of their importance for this paper, I will go into greater detail regarding the composition of the [Limited] Size of Government and the Legal System and Property Rights areas of the index. [Limited] Size of Government makes use of three measures of government spending, government consumption as a percentage of consumption, transfers and subsidies as a percentage of GDP, and government investment as a percentage of investment. These three measures make up three quarters of [Limited] Size of Government. The last quarter is the top marginal tax rate and the bracket to which it applies. Two measures, the top marginal income tax rate, and the top marginal income tax rate plus the payroll tax rate, are given half weight in the final quarter of [Limited] Size of Government.
The Legal System and Property Rights area is created, primarily, using nine variables – Judicial Independence, Impartial Courts, Protection of Property Rights, Military Interference in Rule of Law and Politics, Integrity of the Legal System, Legal Enforcement of Contracts, Regulatory Restrictions on Sale of Real Property, Reliability of Police, and Business Costs of Crime. These measures originate in the World Economic Forum's Global Competitiveness Report, the PRS Group's International Country Risk Guide, and the World Bank's Doing Business Report. The score is then adjusted with a tenth measure from Fike (Reference Fike2016) to reflect gender disparities in the treatment of individuals by governmental institutions.
The index has been investigated at length regarding its relationships to economic outcomes, especially economic growth, with De Haan et al. (Reference De Haan, Lundstrom and Sturm2006) as the primary citation demonstrating the robustness of the relationship. Similar findings that are more recent include Murphy and O'Reilly (Reference Murphy and O'Reillyforthcoming), who use Panel Vector Autoregression to show that the relationship between output per capita and economic freedom is more robust than the relationship between output per capita and democracy or between output per capita and human capital. For other similar recent literature,Footnote 2 see also Williamson and Mathers (Reference Williamson and Mathers2011), Faria et al. (Reference Faria, Montesinos-Yufa, Morales and Navarro2016), and Bennett et al. (Reference Bennett, Faria, Gwartney and Morales2017). Hall and Lawson (Reference Hall and Lawson2014) perform a literature review on the effects of economic freedom on a wide range of variables, while Lawson et al. (Reference Lawson, Murphy and Powell2018) review the causes of economic freedom. The latter finds that democracy and political rights have the most robust positive effects on economic freedom among the variables that have been studied.
Our second institutional variable originates in Murphy (Reference Murphy2019), and uses elements of EFW to measure an entirely different dimension of the quality of economic institutions.Footnote 3 This set of institutions is designated “State Economic Modernity” (SEM), and focuses on two sets of institutions: the quality of the provision of the most essential public goods, i.e. a high quality legal system and the enforcement of property rights, and a large public sector relative to the size of the economy.
The data for constructing this are already implicit in the EFW dataset. However, while EFW credits countries for keeping the size of their states small, SEM negates the [Limited] Size of Government EFW area such that countries with larger states are rated as having higher institutional quality. While EFW takes the average of its five areas, the formula for SEM is simply:

Again, to reiterate, this is such that countries with larger governments in SEM are rated more highly, while countries with smaller governments are scored more highly in EFW. Countries with large governments and strong legal systems rate the highest, while countries with small governments and weak legal systems rate the lowest. Countries with middling amounts of each rate in the middle, as do countries with weak legal systems but large governments, and countries with small governments and strong legal systems. In other words, while SEM makes use of data from EFW, it is related very weakly to it conceptually and practically.
State economic modernity is very similar conceptually to state capacity, and was intended to be. State capacity, defined as the ability of governments to raise tax revenue and execute the tasks it sets out to accomplish, has gained a following among social scientists as an important institutional dimension for developing countries, for example, see Andrews et al. (Reference Andrews, Pritchett and Woolcock2017), Besley and Persson (Reference Besley and Persson2010), Fukuyama (Reference Fukuyama2004), and Johnson and Koyama (Reference Johnson and Koyama2017). Importantly, strong and effective states are needed to define and enforce property rights (Acemoglu, Reference Acemoglu2003; Besley and Ghatak, Reference Besley, Ghatak, Rodrik and Rosenzweig2010; c.f. Acemoglu, Reference Acemoglu2005). But the other side of state capacity is fiscal capacity, or the ability to raise revenue when needed, and this is thought to be important as well for the development process (Besley and Persson, Reference Besley, Persson, Auerbach, Chetty, Feldstein and Saez2013; Dinecco and Prado, Reference Dinecco and Prado2012).
However, SEM offers two important differences worth emphasizing – its data coverage, by piggybacking off of EFW, is much more extensive than other measures of state capacity (e.g. Worldwide Governance Indicators), and it offers a conceptual difference that allows it to approximate or measure the economic institutions of social democracy much more closely than Worldwide Governance Indicators does. Measures of governance or state capacity will rate Sweden and Singapore similarly, despite their widely divergent sets of institutions as they are enacted in practice. In contrast, SEM ranks Sweden toward the very top, while it ranks Singapore toward the middle. SEM thereby captures an element of institutional quality apart from measures of governance and state capacity, and is, in practice, more distant from economic freedom than are measures of governance. Also on this point, SEM is an alternative way of addressing and thinking about Ott's (Reference Ott2018) concerns about the usefulness of including measures of the size of government when measuring economic freedom.
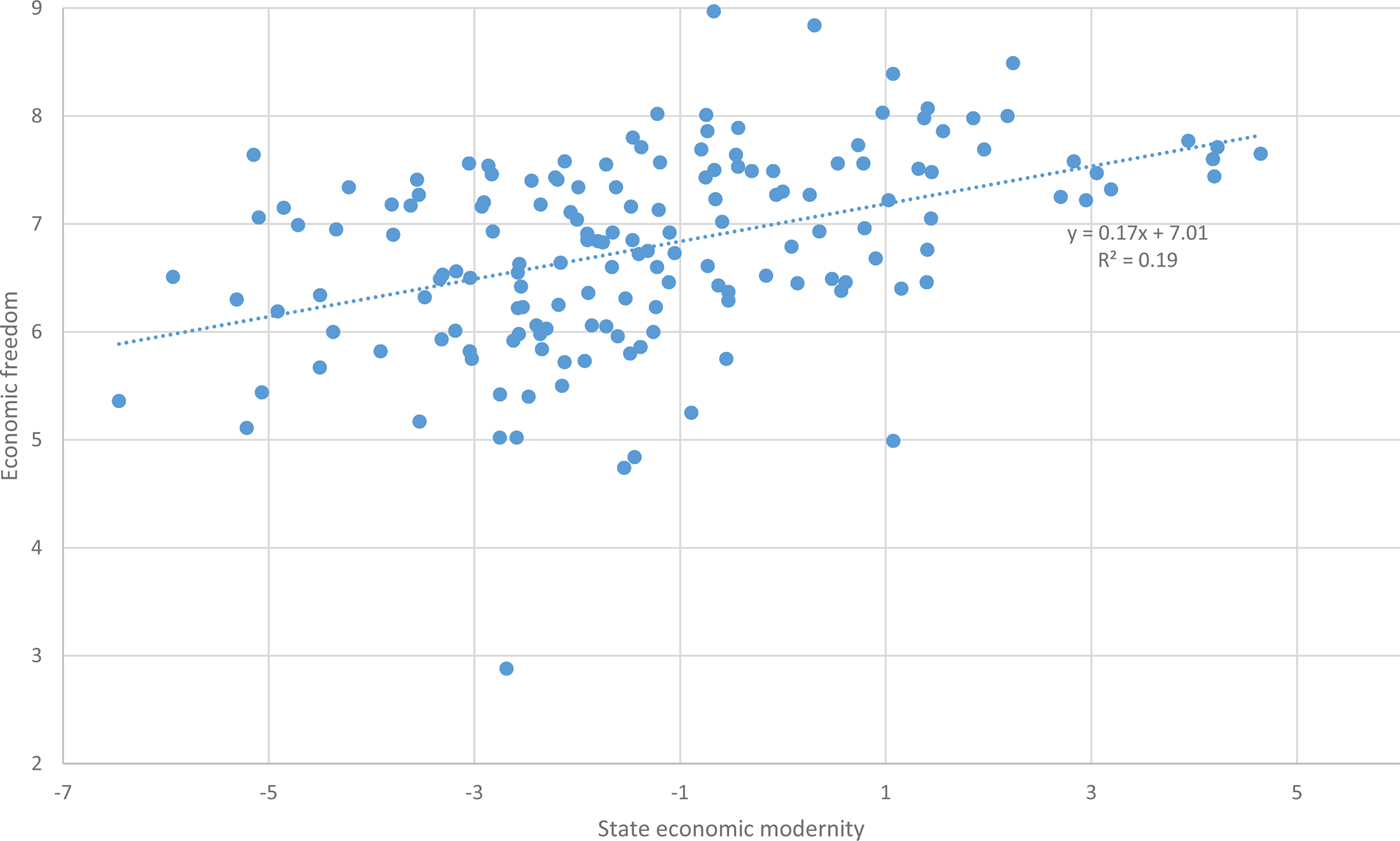
The countries with the highest scores in SEM in the 2016 data are Finland, the Netherlands, Sweden, Norway, and Luxembourg. But SEM is also intuitive in how it scores certain countries low, as certain countries that EFW rates highly nonetheless do not superficially appear to be high in institutional quality; Guatemala, which EFW rates high, is fifth from the bottom in SEM. Others similar to Guatemala include the Philippines, El Salvador, and Panama, although far more common are countries with weak institutions both in terms of EFW and SEM, such as Myanmar, Angola, and Libya. Very few, if any countries, today have both low economic freedom and high SEM. Extensive descriptions of the patterns found in the data when SEM is plotted against EFW are found in Murphy (Reference Murphy2019). Figure 1 plots the relationship between the two dimensions of institutional quality, which are much less correlated than many other measures of institutions are with one another (R = 0.44 for 2016 data; c.f. the correlations of institutional quality found in Murphy, Reference Murphy2016).
Relationship between economic freedom and state economic modernity

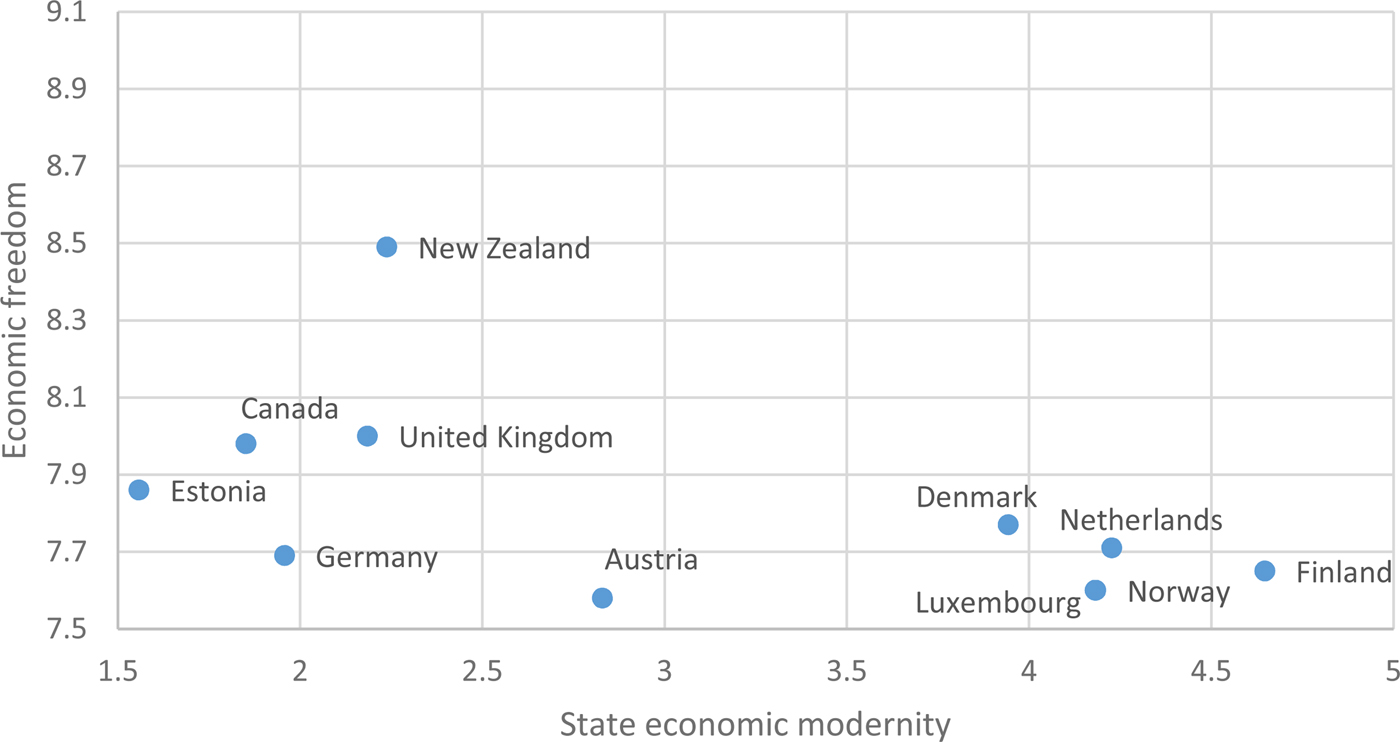
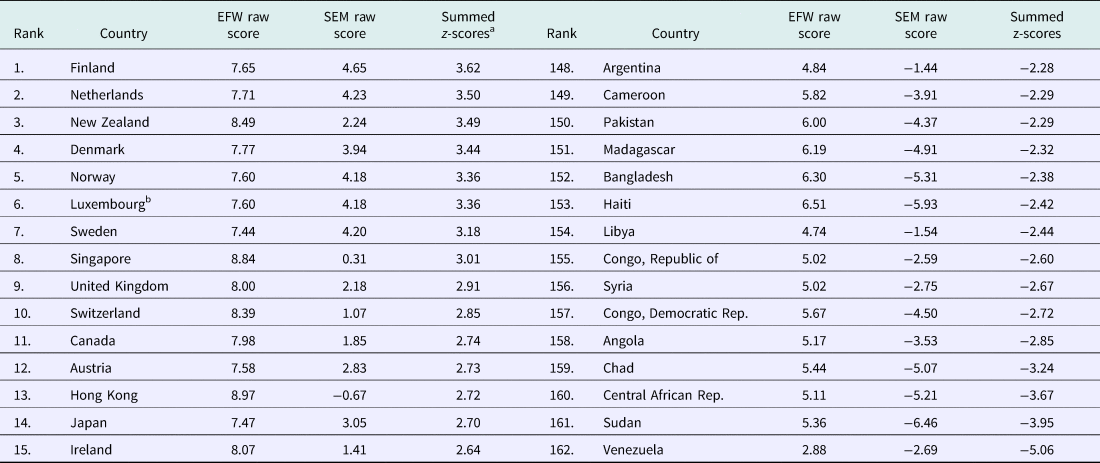
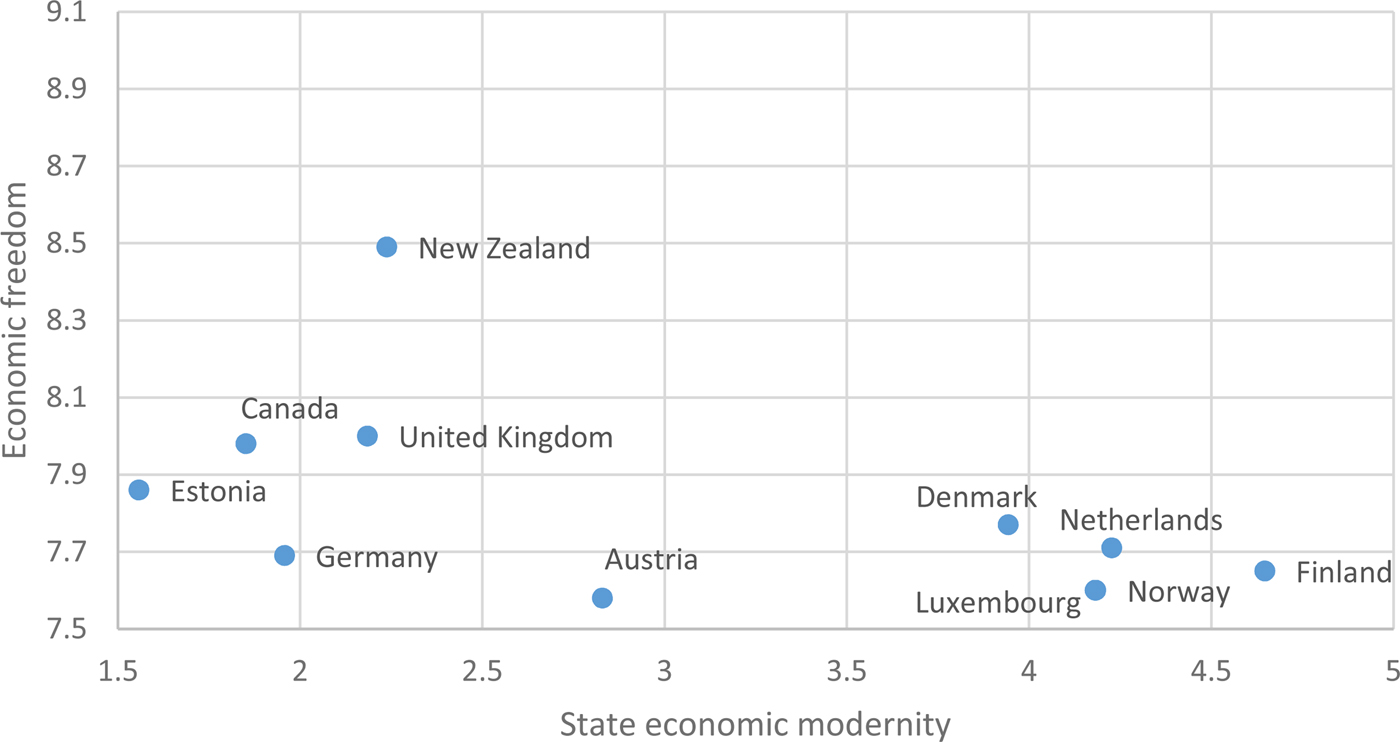
Figure 2 plots the 11 countries that EFW and SEM, used together, show to be at the institutional frontier – New Zealand, Canada, Estonia, Germany, the United Kingdom, Austria, Denmark, the Netherlands, Luxembourg, Norway, and Finland. If you were to place slightly more emphasis on SEM in defining the institutional frontier, Sweden, Japan, Belgium, Iceland, and France would be added. If you were to place slightly more emphasis on EFW, you will include Switzerland, Ireland, Australia, and (as an edge case) Portugal. The figure itself is agnostic as to what an indifference curve reflecting the relative importance of the two sets of institutions “should” look like, normatively speaking. Finally, in Table 1, I have taken the z-scores of EFW and SEM in 2016 and added them togetherFootnote 4 to provide what we can somewhat glibly call “Denmark-ness” rankings, so as to offer an additional sense of how we will be conceptualizing the development of economic institutions.
Countries that “got to Denmark”
Rankings of “Denmark-ness” of Economic Institutions (Combined EFW and SEM) by Country

a For this, I created a z-score for EFW and a separate z-score for SEM, and summed them.
b The tie across the two categories between Norway and Luxembourg is not a typo. Norway's actual summed z-score is 3.35587 and Luxembourg's is 3.35510.
In order to consider recent trends in changes to economic institutions, both SEM and EFW will make use of the “EFW Panel Dataset” found on the Fraser website (see Gwartney et al., Reference Gwartney, Lawson, Hall and Murphy2018: viii). This version of the index has much better time series properties when the time series comparisons are most salient, as they are here. The panel dataset imputes missing data values backwards instead of ignoring the fact that artificial time series variation is introduced incorrectly when new data enter the index. Initial explorations of the data for this paper were confounded by errors introduced by missing data points causing false time series variation to arise. In this context, researchers should be strongly cautioned to use the EFW Panel Dataset, not the standard dataset that does not address these issues. Additionally, the period we will focus on is the years 2000–2016. The year 2000 offers a clean cutoff, a reasonable approximation for when the onset of the slowing of frontier growth began in earnest:Footnote 5 a wide number of countries with high data quality are available through EFW for this period.
Other data used to describe patterns in the institutional data pertain to defining countries in terms of region and global income brackets. Regional definitions – Africa, Arab States, Asia & Pacific, South/Latin America, and North America – follow the definitions from the Wikimedia Meta-Wiki definitions, which in turn make use of definitions from the International Telecommunications Union.Footnote 6 Definitions for lower income, lower middle income, upper middle income, and upper income brackets were set to $1,025, $4,035, and $12,475 GNI (2015 dollars) per capita,Footnote 7 with GNI per capita data itself, primarily, from World Development Indicators, and GDP per capita data substituted for countries where GNI data were unavailable in 2000.
3. Findings and discussion
Institutional change in aggregates
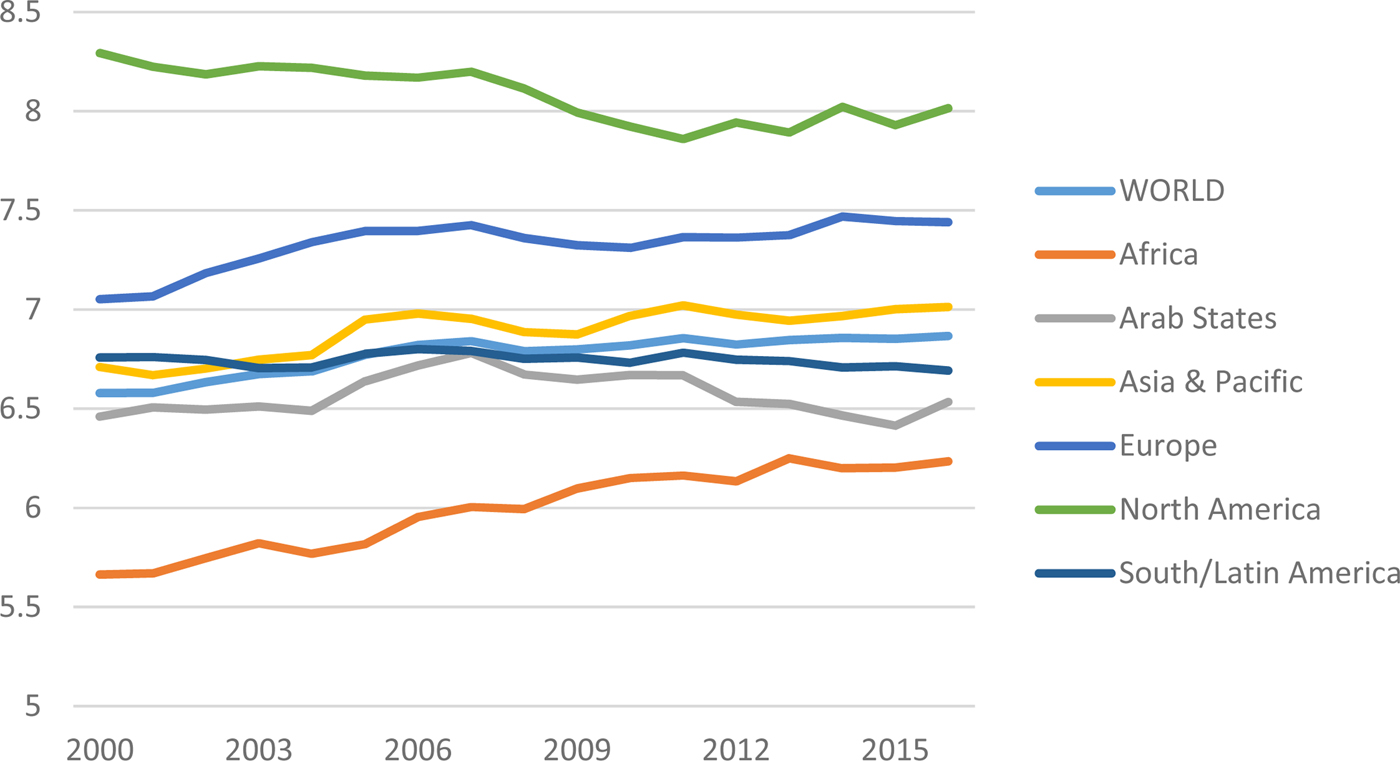
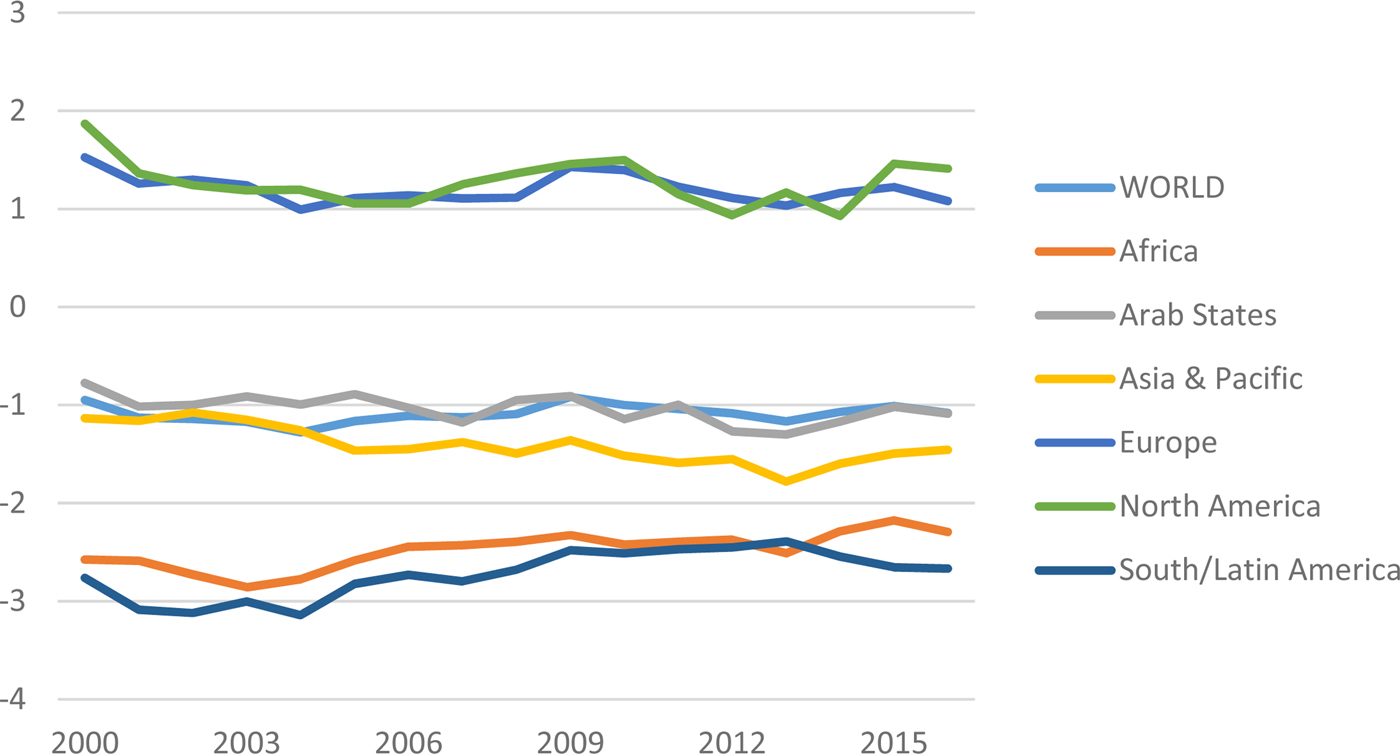
Before looking at the recent institutional changes of individual countries, consider Figures 3–6, which break down patterns in EFW and SEM from 2000–2016 by region and by income group. We first consider liberalization by region in Figure 3. The time series positioned highest in Figure 3, labeled North America, shows the collective decline and partial correction of the United States and Canada. However, liberalization as a whole has continued as a long-run trend in Europe, despite its political and economic tumult. The trend is strongly positive in Africa and weakly positive in Asia & Pacific. It is in the Arab States and South/Latin America where stagnation in liberalization has occurred. As a whole, the world trend remains positive, though with a compressed distribution.
Economic freedom by region, 2000–2016

State economic modernity by region, 2000–2016

Economic freedom by income group

STATE economic modernity by income group (2000), 2000–2016

Figure 4 presents the same period and regions for SEM. Unexpectedly, the six regions form three sets of fairly tight pairings – North America with Europe, Asia & Pacific with the Arab States, and South/Latin America with Africa. In recent years, South/Latin America has fallen behind Africa. The Asia & Pacific and Arab State pairing is right around the world average. There is no clearly discernable trend for any of the regions, except that Asia & Pacific may have fallen slightly over the period. Arguably, the lowest pairing may be converging upwards toward the middle pairing.
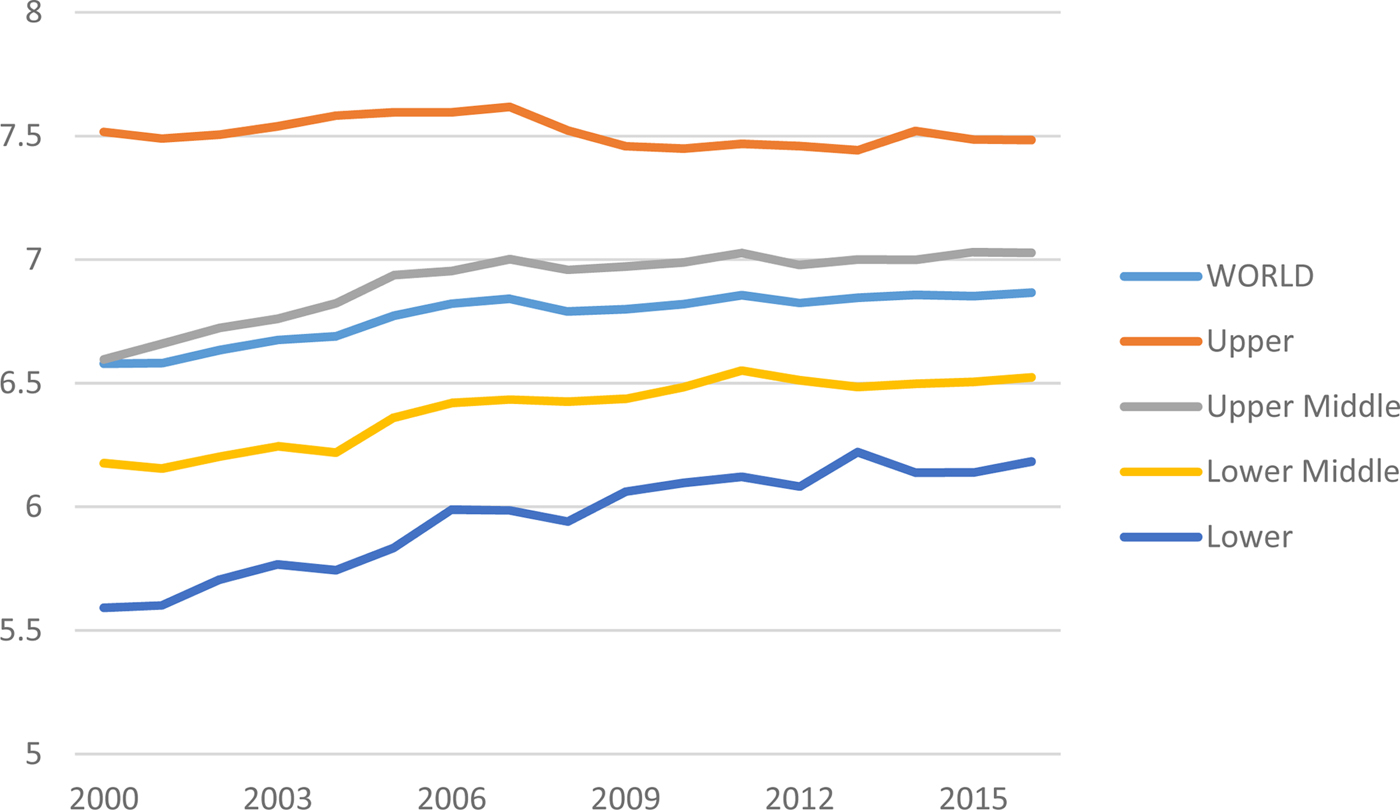
Figure 5 breaks down changes in economic freedom by country income bracket. Countries that were upper income in 2000 are overall essentially flat, while there is institutional progress for the other three groupings of countries. This is most strongly apparent among the lowest income countries. This presents a more optimistic picture if economic freedom is to be viewed as an important dimension of institutional quality. While cynicism about the prospects for economic freedom in the developed world abounds, especially in the United States following the Great Recession (e.g. Boudreaux, Reference Boudreaux2015; Stansel and Tuszynski, Reference Stansel, Tuszynski, Gwartney, Lawson and Hall2016), economic freedom in the developed world, overall, is merely stagnant, while across the developing and middle income world, institutional reform is ongoing.
Figure 5 can also be compared to Murphy (Reference Murphy2015), which found that uniform declines in the quality of the Legal System and Property Rights and Freedom to Trade Internationally took place throughout the G7, and with some exceptions, throughout the OECD, from 2000 to 2012. Since 2012, the average Legal System and Property Rights score for the G7 has fallen almost imperceptibly (-0.05), while Freedom to Trade Internationally has ticked upwards (+0.19). We do not observe long-run patterns among developed countries in their overall economic freedom, and one of the declines observed in Murphy (Reference Murphy2015) has partially corrected. Since these kinds of economic institutions are most susceptible to attack by populism, they are worth considering. We will return to this topic briefly toward the end of section 3.
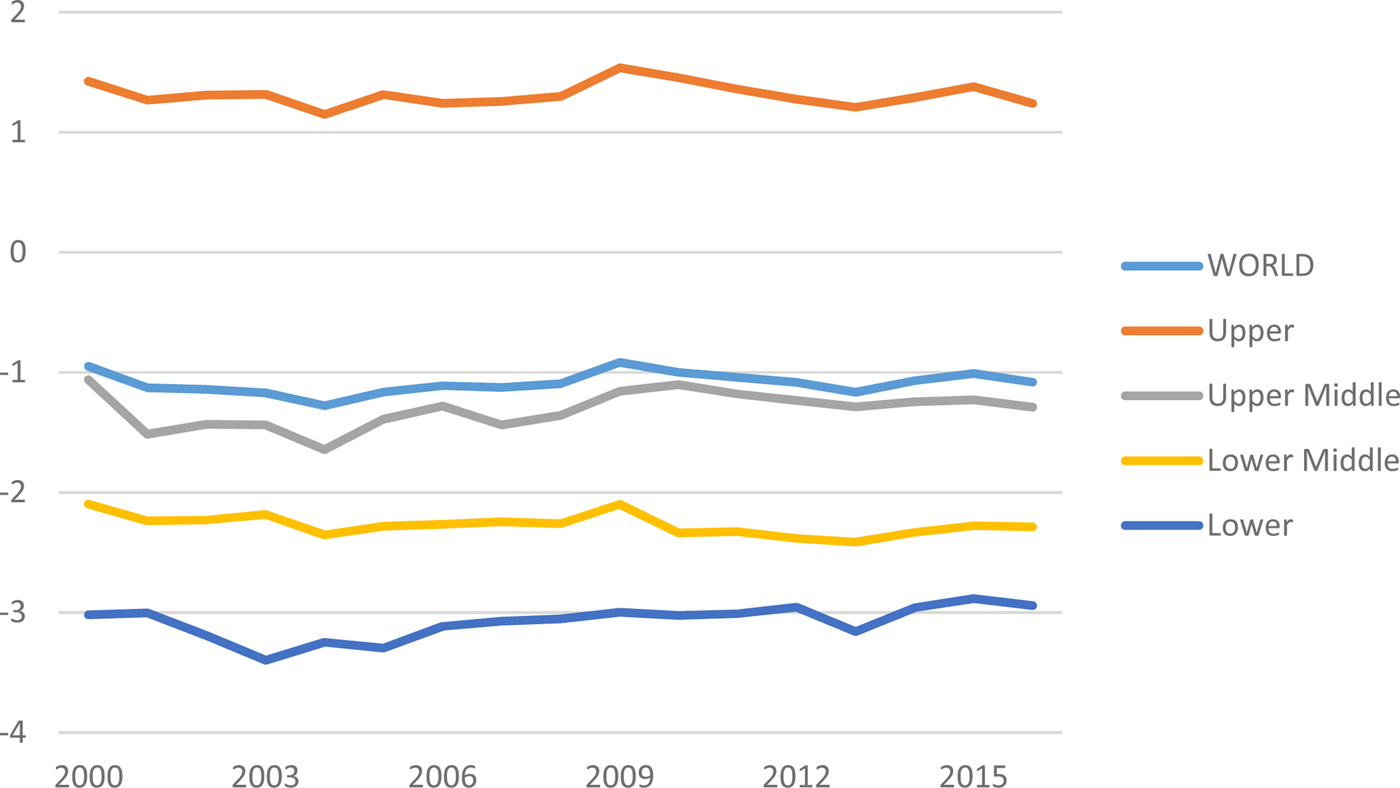
Figure 6 presents the long-run patterns in the SEM data by country income bracket. No group of countries as a whole exhibits an obvious upwards or downwards trend. As we will see, there are individual countries that have seen significant movements in their SEM score, but there is little evidence of long-run upwards convergence by lower income countries in terms of this set of institutions. This is consistent with Andrews et al. (Reference Andrews, Pritchett and Woolcock2017), which notes the lack of progress in building state capacity despite the widespread acceptance of the need and desirability for improvements in these kinds of institutions.
Conceptualizing economic institutional development
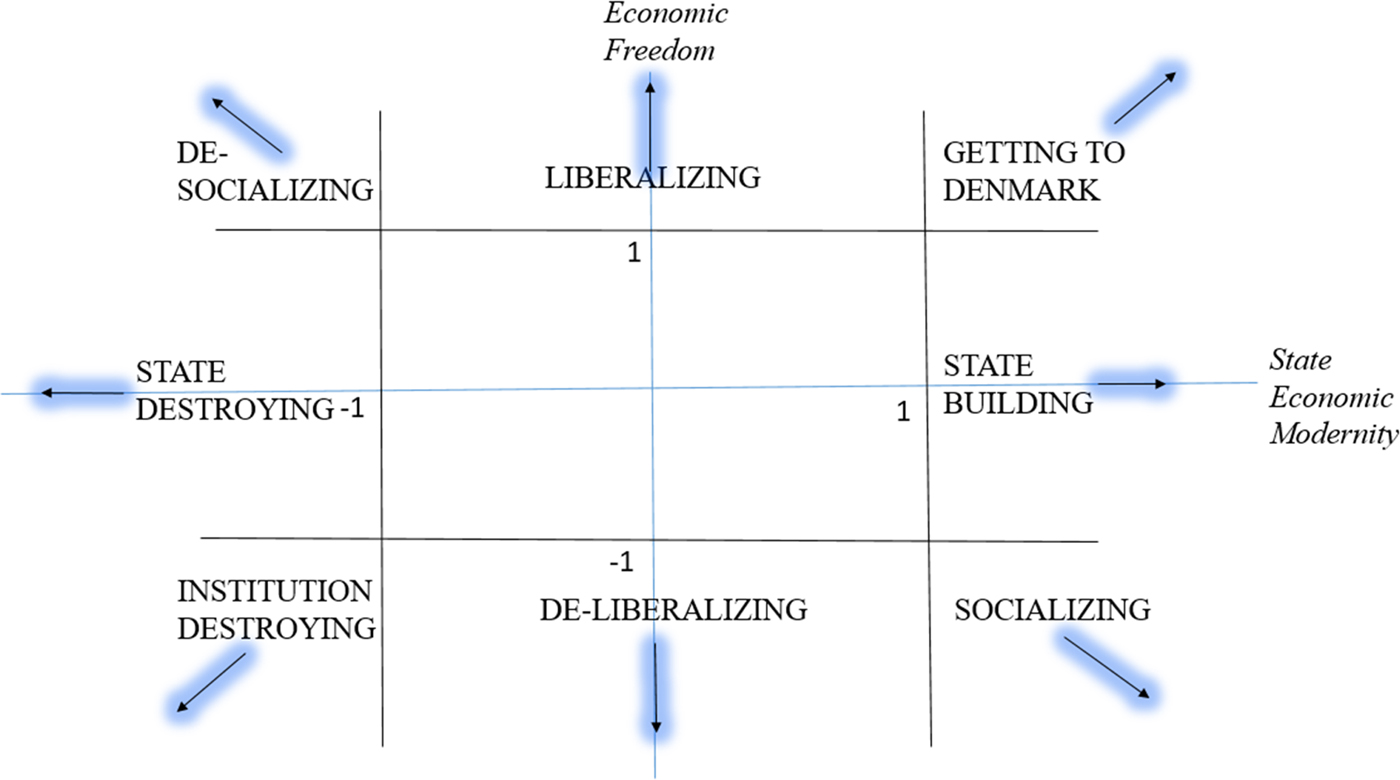
To evaluate specific countries, we turn to Figure 7. As in Figure 1, SEM appears on the x-axis and EFW appears on the y-axis. If a country moves significantly rightwards along the x-axis without significant movement along the y-axis, let that be defined as “state building.” If a country moves significantly upwards along the y-axis without significant movement on the x-axis, let that be defined as “Liberalization.” If a country moves significantly positively in both directions, lets that be defined as “Getting to Denmark” – in the sense of achieving the consensus desired bundle of economic institutions. Movements in the opposite direction of state building, liberalization, and getting Denmark are defined, in turn, as “State Destroying,” “De-Liberalization,” and “Institution Destroying.”
Definitions of institutional changes

That leaves a single pair of possible combinations – moving upwards and leftwards (liberalization plus state destroying) and moving downwards and rightwards (de-liberalization plus state building). While this is not fully straightforward, and may appear somewhat tendentious, I will label the movement upwards and leftwards as “De-Socialization” and movements downwards and rightwards as “Socialization.” Given the definitions used, movements away from socialism do not require dismantling the state, but this is what it historically has entailed. Murphy (Reference Murphy2018) considers the year 1985, a point when socialism was far more prevalent, to identify which countries combine high SEM and low EFW, as virtually no country combines low EFW and high SEM today.Footnote 8 The countries best fitting this description in 1985, among those for which data are available, were Israel, Hungary, and China. For various reasons, Murphy (Reference Murphy2018) characterizes these as the best empirical cases of “actually existing socialism.” Yet all three countries moved leftwards (dismantling their states) in conjunction with moving upwards and freeing their markets. Hence while I recognize that a host of vectors of reform could correspond to a movement in one direction or another, I will use this description unless it becomes problematic empirically.
For changes occurring over a 16-year period, I will define “significant” as one standard deviation change, with the standard deviation being measured with respect to the initial cross-section of institutions in 2000. Murphy (Reference Murphy2019) suggested that SEM may be more stubborn or static as an institutional measure, with the intuition being that SEM is more culturally determined than EFW. Although this held in Figures 3–6, it does not appear to have held below for individual countries, and several countries see their SEM change non-trivially over the period.
Recent institutional change by country
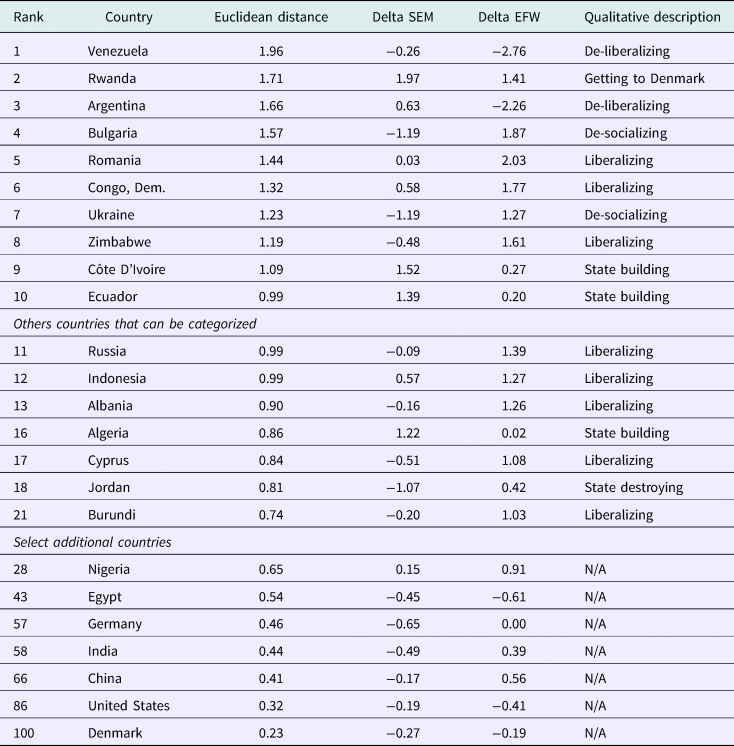
Table 2 presents countries alongside the changes in the quality of their institutions from 2000 to 2016. For the sake of consistency, standard deviations and averages of each index from 2000 were applied to both 2000 and 2016 data when standardizing them, so as to allow for apples-to-apples comparisons. I have ranked the countries by the extent of their overall change, combining the change in the standardized SEM and standardized EFW into a Euclidean distance. While the rank order is determined by overall change, whether or not a change to EFW or SEM is considered significant depends on whether the absolute value of the standardized values of either or both changes was greater than one.
Countries with the largest changes in economic institutions, 2000–2016

At the top of the list of overall institutional change is Venezuela's experience with Chavismo. The decline in EFW was so great over this period that it ranks as the greatest change in institutions even though its change in SEM was only modest. The second largest change in institutional environment is Rwanda's rapid experience with modernization, although the quality of its political institutions lags. Argentina's experience with Peronism under the Kirchners leads to its placement as third on the list (see Cachanosky, Reference Cachanosky2018).
Bulgaria and Ukraine are the two countries labeled as “de-socializing,” which fits the narrative history, if on a lag. Romania is a similar country insofar as it pursued liberalization more earnestly than Bulgaria or Ukraine, but it did not dismantle its state. In this context, it should be emphasized that certain countries – notably GeorgiaFootnote 9 – are absent from consideration because they were not scored by EFW in 2000. Rounding out the top ten are four countries with weak institutional environments, two of which have been engaged in state building (Côte D'Ivoire and Ecuador) and two of which have been liberalizing (Democratic Republic of the Congo and Zimbabwe).
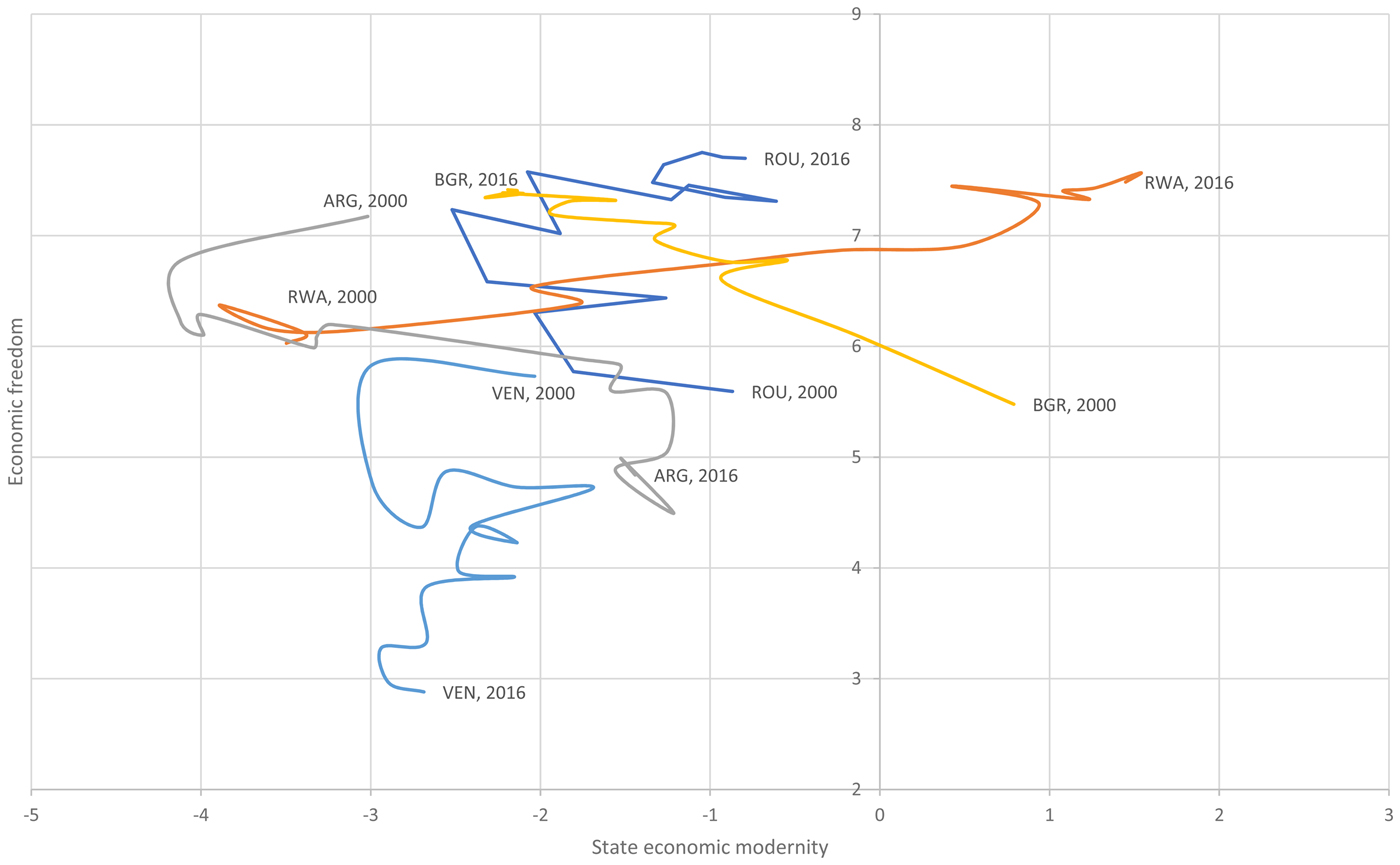
In Figure 8, the paths of the five countries with the greatest institutional change – Venezuela, Rwanda, Argentina, Romania, and Bulgaria – are given. Among these large changes, there does not appear to be any systematic way in which EFW or SEM preceded one another (as in Sobel Reference Sobel2017) regarding any other systematic characteristics. Figure 8 was limited to five countries for purposes of legibility. I should also note that the x-axis cuts off the right end of the distribution for the same reason of legibility, as none of the countries that experienced significant institutional change began or ended with especially high SEM.
The five largest changes in economic institutions, 2000–2016

Returning to Table 2, I then list additional countries that can be categorized by having at least a significant change in at least one of the two dimensions of economic institutions. Some ranks are skipped because neither of the movements of the individual institutional dimensions was large enough to warrant a classification. Russia and Albania have continued to liberalize, as other former Soviet countries Bulgaria and Ukraine did above. Cyprus is an interesting case in that it rapidly liberalized from 2000 to 2007, de-liberalized rapidly in 2013 in conjunction with its financial crisis, and has since fully recovered. Burundi has liberalized primarily by opening its markets to trade. Indonesia advanced by taming its inflation beast and doing the hard part of state building – making its legal system more functional – although this latter change has not been large enough to surpass the threshold of one standardized unit in SEM. Jordan's declines in SEM have been led by rather drastic falls in both government consumption and government investment.
Following this, Table 2 also lists recent institutional changes for a select group of other countries although their changes in institutions are not large enough to warrant classification – Nigeria, Egypt, Germany, India, China, the United States, and Denmark. India and China have moved toward liberalization in the period, but marginally so, compared to those listed above over this period. In both marginally dismantling its state and liberalizing, China has continued on the path as identified in Murphy (Reference Murphy2018). The United States has very modestly moved in the direction of institution destroying, though the extent of its de-liberalization, as previously mentioned, has been overstated.
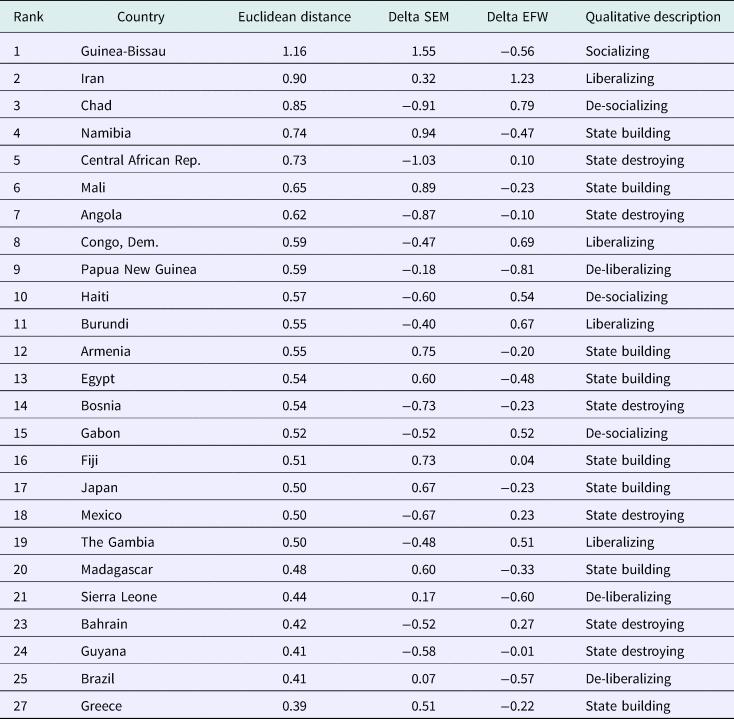
Table 3 takes another approach by zooming in on the very recent past, 2012–2016 (averages and standard deviations for standardizing the variables reflect the year 2012). Only two countries have moved by a standard deviation in either dimension, so the threshold was relaxed to a half of a standard deviation in order to consider the institutional changes of a greater number of countries. At the top of the list, Guinea-Bissau's movement toward socializing is not wholly artificial, but upon inspection of the data, it is clear that the large measured change was in part driven by the specific choice of the year 2012 as a starting point, and the way in which imputation was implemented. I will not consider the very recent changes in Guinea-Bissau further. Iran's liberalization, however, is real, although it has been driven almost wholly by getting its inflation under control, and a return to normalcy on the part of variables related to inflation (i.e. black market exchange rates and the irregular behavior of interest rates). The remaining examples of very recent institutional change are primarily various developing countries making small movements in one direction or another, mostly in positive directions. This is perhaps being reasonably described as developing countries “muddling through.” Among all countries, the two that are closest to the economic frontier, Japan and Greece, were measured as having performed state building, with modest increases in their Legal System and Property Rights scores along with larger increases in the size of government.
Countries with the largest changes in economic institutions, 2012–2016

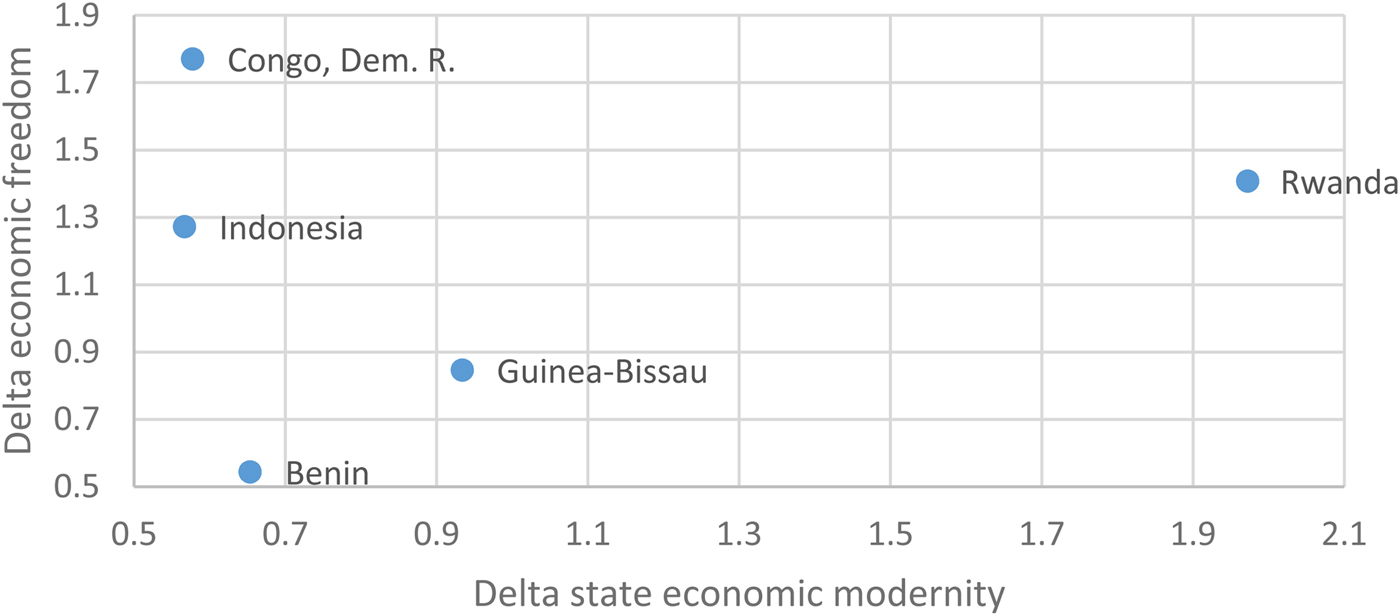
Returning to the earlier analysis of the period 2000–2016, which countries have experienced true positive institutional development? Only Rwanda has increased both its EFW and SEM by at least one standard deviation, and by that definition, it is the only country that has been “Getting to Denmark.” Figure 9 relaxes the definition of what we require a country to do so as to be moving in the direction of Denmark, to a half of a standard deviation in both dimensions of institutions. We then observe four other countries – the Democratic Republic of the Congo, Indonesia, Guinea-Bissau, and Benin – making general institutional improvement.Footnote 10 Even if many of these countries remain at a low level, institutional reform has taken place in all of them has taken place and should not be discounted.
Countries moving towards Denmark the fastest, 2000–2016

If we were to ask the opposite question – if we relax definitions, how many countries would appear to be destroying their institutions – what would the answer be? None. No country has fallen by a half standard deviation in both SEM and EFW from 2000 to 2016. Nineteen of the 123 countries fell in both categories by some amount, but in most of the 19, the declines were trivial for one or both dimensions. Countries whose declines in standardized values have summed to negative one or less are Venezuela, the Central African Republic, and Egypt, without any other examples, although with better data, Syria likely would appear on this list.Footnote 11
While we have considered recent institutional change, we have not yet focused on the topical question of the day, the effects of the rise of populism on the right. This question is more related to the literature on the dangers posed to democracy and liberalism found in the introduction. Previous research has shown the negative effects, overall, of populism on economic freedom (Rode and Revuelta, Reference Rode and Revuelta2015; c.f. Cachanosky and Padilla, Reference Cachanoksy and Padillaforthcoming). The question with respect to the recent past is considered in Table 4, which shows economic institutions in the year before (i.e. “t-1”) six right-populist leaders took power of a country in the recent past and the country's score in 2016. This is done for EFW, SEM, the Legal System and Property Rights component of EFW, and the Freedom to Trade Internationally component of EFW. Raw index scores were used instead of z-scores for each. Duterte of the Philippines, Trump of the United States, Bolsonaro of Brazil, and the Five Star Movement of Italy were not included due to their recentness.Footnote 12
Recent changes in economic institutions of countries under right-populist rule (raw index scores)

a Year does not correspond to when Putin and Erdogan took power, but when perceptions of each changed – dated using Putin's return to the presidency and Erdogan's suppression of the Gezi Park protests.
Of the six countries considered, there have been almost no aggregate movements in EFW or SEM. However, there is some apparent movement downwards in the Legal System and Property Rights and a movement upwards in Freedom to Trade Internationally. The latter movement is driven entirely, however, by Russia's recent free trade reforms. If Russia is to be discounted, then there would be some evidence that right-populism has begun harming economic institutions at the macro level (recall also Murphy, Reference Murphy2015, which focused on these latter two sets of institutions in particular). This is to say nothing, of course, about whether this trend has harmed political or social institutions.
Overall, wealthy countries have seen their institutions stagnate. Developing and middle-income countries have seen continued increases in economic freedom, but not SEM. There is considerable variation underneath these aggregates, as certain countries have moved not just in their economic freedom, but their SEM as well. Rwanda and Venezuela stand out in the extent of their changes in economic institutions in the 2000–2016 period. In the recent past, Iran has rapidly gotten control of its monetary arrangements, which not too long ago were extremely poor. In addition to Rwanda, we can point to Indonesia, Benin, Guinea-Bissau, and the Democratic Republic of the Congo, as having made tangible improvements to the economic institutions across both dimensions of institutional quality. All this comes against the headwind of both slowing growth and the worst worldwide recession in almost a century. The conclusions of this bird's eye view of institutional development could be characterized, therefore, as stagnation, but with grounds for optimism.
4. Conclusion
Following the liberal triumphalism regarding both democracy (Fukuyama, Reference Fukuyama1992) and capitalism (Yergin and Stanislaw, Reference Yergin and Stanislaw1998), institutional stagnation set in worldwide, in conjunction with first the Great Recession and then the rise of populism. While there is extensive coverage of threats to liberal democratic institutions, similar concerns have been raised about liberal economic institutions (Boudreaux, Reference Boudreaux2015; Cachanosky, Reference Cachanosky2018; Cachanosky and Padilla, forthcoming; Murphy, Reference Murphy2015). Besides liberal economic institutions, there is a perception that building state capacity has also stalled (Andrews et al., Reference Andrews, Pritchett and Woolcock2017). This paper seeks to perform a systematic analysis of how economic institutions have changed so far in the 21st century.
To do so, it makes use of the EFW index as a measure of liberal economic institutions and the SEM index, a measure of state building, capacity, or power. When paired and plotted against each other, they rapidly convey the character of a country's economic institutions. A country that is gaining economic freedom may be characterized as “de-socializing,” “liberalizing,” or “getting to Denmark” depending on whether it is losing, keeping constant, or gaining in SEM. A country that is losing economic freedom may be characterized as “institution destroying,” “de-liberalizing,” or “socializing,” depending on whether it is losing, keeping constant, or gaining in SEM. Countries that lose SEM with no change in economic freedom are characterized as “state destroying;” those that gain it with no change in economic freedom are characterized as “state building.” The characterizations throughout this paper pertain only to economic institutions, not political institutions.
Analyzing institutional development through this lens leads to a stagnation-optimist picture of development. Countries that were already at the economic frontier in 2000 should be viewed mostly as stagnating, not retrogressing, while countries below them have, as a whole, continued to liberalize. It is true that at the macro level, state building among all groups of countries has stagnated, but heterogeneity across individual countries is present. A cursory examination in the most recent trends in the election of right-populist world leaders does not yet show a degradation in the relevant countries’ economic institutions, although it is far too early to tell, and my methodology was hardly conclusive.
By far, Rwanda is the country that has done the most to build its institutions in the 21st century. Others that have tangibly made progress toward Denmark are the Democratic Republic of the Congo, Indonesia, Guinea-Bissau, and Benin. While no country fits the definition of moving oppositely, the countries that have done the most to destroy their institutions are Venezuela, Syria, Egypt, and the Central African Republic. Argentina has de-liberalized almost as extensively as Venezuela over the period, while several former members of the Soviet Union have continued to liberalize, including Russia itself. The most notable institutional change from 2012–2016 was Iran rapidly getting ahold of its monetary issues. Other recent, short-run changes can be mostly thought of as developing countries “muddling through.”
This paper offers a novel means of evaluating the evolution of economic institutions across countries and implements it. SEM and EFW, when used together, group countries together intuitively in such a way that their economic institutions can be understood rapidly. Looking at changes in the indexes, especially over long enough periods for noise and error to cancel out, provides a means of evaluating institutional evolution. Most countries have seen stagnation, but no worse than modest declines in economic freedom and SEM, including the United States. Certain countries have fundamentally changed, however, and it is useful to have a means of identifying them systematically.
Author ORCIDs
Ryan H. Murphy, 0000-0002-2596-8750.