Introduction
Metabolic syndrome (MetS) is defined as a set of cardiometabolic disorders including at least three out of the following: central obesity, hypertriglyceridemia, fasting hyperglycaemia, hyperinsulinaemia and hypertension.Reference Grundy1 These comorbidities have been more associated with individual lifestyle than with heredity because inheritance contributes less than 2% for obesity and 5%–10% for type 2 diabetes mellitus.Reference Basile, Johnson, Xia and Grant2,Reference Locke, Kahali and Berndt3 However, increasing evidence has supported that most metabolic disorders are programmed before adulthood, as consequence of environmental and nutritional insults occurring at early stages of life, such as gestation, lactation and childhood.Reference Itoh and Kanayama4,Reference Lee, Wu, Leu and Tain5 For instance, the worldwide epidemic growth of MetS has been directly associated with the exponential rise in sugar consumption during the last decades.Reference Bray, Nielsen and Popkin6,Reference Bray7 This issue is particularly important for infants and children, given that sugars are a major component of their diet, representing nearly 25% of total energy intake in the childhood.Reference Newens and Walton8 Although the accountable mechanisms are barely known, they conceptually fall within the developmental origins of health and disease (DOHaD) theory, which is currently recognised as an important contributor to the epidemic MetS.Reference Lee, Wu, Leu and Tain5
In the liver, MetS manifests as non-alcoholic fatty liver disease (NAFLD), whose prevalence reaches 25% of general population, but may affect up to 80% of obese subjects.Reference Younossi, Koenig, Abdelatif, Fazel, Henry and Wymer9 Ranging from simple steatosis to non-alcoholic steatohepatitis (NASH), NAFLD has also been correlated to the elevated dietary intake of sugars.Reference Chiu, Mulligan and Schwarz10 Sucrose consumption stimulates de novo lipogenesis (DNL), triacylglycerol (TAG) synthesis and NAFLD development through mechanisms orchestrated by two main lipogenic transcriptions factors: carbohydrate regulatory element-binding protein (ChREBP) and sterol regulatory element-binding protein 1c (SREBP1c).Reference Ipsen, Lykkesfeldt and Tveden-Nyborg11 ChREBP is directly activated by glucose and fructose, whereas SREBP1 responds to higher serum insulin levels evoked by excess sucrose intake.Reference Softic, Gupta and Wang12 In a previous report, we showed that exposure of weaned mice to an isocaloric high-sucrose diet (HSD) for 90 days increased transcriptional levels of both ChREBP and SREBP1 in a time-dependent manner with consequent NAFLD onset, but no progression into NASH.Reference Flister, Pinto and Franca13
The close relationship between obesity and NAFLD has been ascribed to the direct involvement of white adipose tissue (WAT), which releases a variety of bioactive substances, such as free fatty acids (FFA), leptin, adiponectin and inflammatory cytokines. Ultimately, these adipokines exert important paracrine and endocrine functions on energy balance and metabolic homeostasis.Reference Lafontan14 Hypertrophic WAT favours the development of local insulin resistance (IR) and consequent increase in circulating FFA, which are uptaken by the liver and esterified to directly render TAG synthesis and consequent fat accumulation into hepatocytes.Reference Fabbrini, Sullivan and Klein15 However, whether sucrose intake impacts WAT homeostasis in a way that reverberates on molecular and functional mechanisms involved in NAFLD-to-NASH progression is scarcely known.
Thus, in the current study we hypothesised that early exposure to an isocaloric 25% sucrose diet since weaning up to young adulthood disrupts WAT homeostasis generating metabolic factors involved in NAFLD-to-NASH progression. Data herein presented strongly support the triggering of IR in the WAT as a major factor for dysfunctional release of FFA towards portal circulation and consequent upregulation of DNL genes and hepatic inflammatory onset, which concurred for NAFLD-to-NASH progression in young HSD-fed mice. Furthermore, our data advocate for the urgent establishment of sucrose consumption limits worldwide, particularly at childhood, to prevent precocious onset of NAFLD in the youth.
Methods
Experimental design and diet composition
Weaned male (12.8 ± 0.3 g) Swiss mice (Mus musculus) provided by the animal facility house of the Federal University of Maranhão (UFMA) were randomised into two groups: one fed a high-sucrose but isoenergetic diet (HSD, n = 12) for 60 and 90 days, and the other fed a standard chow (CTR, n = 12 – Nuvilab®, Curitiba (PR), Brazil) for the same period. At each time-point, half the group was euthanised, resulting in six mice per time per group. HSD was adapted from de Lima et al.Reference de Lima, Silveira, Haibara and Coimbra16 and manufactured with powdered standard chow (40%), condensed milk (40%), refined sugar (8.5%) and filtered water qsp for a final mixture containing 65% total carbohydrates (25% sucrose), 12.3% proteins and 4.3% total lipids, totalling 14.6 kJ/g. The standard chow contained 55.4% total carbohydrates (10% sucrose), 21% proteins and 5.2% total lipids, totalling 14.7 kJ/g.
Animals were kept at animal facility house of Biological and Health Sciences Center (CCBS, UFMA), at three mice per cage (polycarbonate, 30 × 20 × 13 cm), at a temperature of 23 ± 2 ºC, 12-h light/dark cycle, and access to filtered water and HSD or standard chow ad libitum. Throughout experimental periods, body weight (g) and energy intake (kJ/day/10 g bw) were assessed twice a week, when the whole food (~200 g per cage) was replaced. Feed efficiency was calculated as the quotient of weekly body weight gain/weekly energy intake (g/kJ). All procedures were performed in accordance with the rules of Brazilian Council for the Control of Animal Experimentation and approved by the Ethical Committee on Animal Use and Welfare of UFMA under ruling number 23115.002832/2017-25.
Evaluation of obesity, blood and tissues collection
During every 30 days of experimental period, obesity development was assessed by Lee Index calculation, which is the quotient of the cube root of body weight (g) per naso-anal length (cm).Reference Bernardis and Patterson17 Upon 60 and 90 days on diet, animals were submitted to 9 h overnight fasting, anesthetised (10 mg/kg xylazine + 40 mg/kg ketamine, i.p.) and submitted to laparotomy for blood collection by cardiac puncture. After coagulation (30 min, 25°C), serum samples were obtained by centrifugation (1300 × g, 15 min, 4°C) and stored at −80°C for further analysis. Periepididymal and retroperitoneal WAT and interscapular brown adipose tissue (BAT) pads were removed and weighed for fat accumulation assessment. The liver was also collected, washed out with PBS and separated into four portions: one was immediately immersed in 10% formalin for histological studies and three were frozen (−80°C) for fat liver content assessment, RNA extraction and cytokines measurements.
Assessment of glucose homeostasis and serum biochemical profile
Nine-hour fasted mice (six per group) were orally administered 2 g/kg glucose for performance of oral glucose tolerance test (oGTT).Reference Suez, Korem and Zeevi18 Capillary blood drops were collected by tail cut immediately before (time 0) and 15, 30, 60 and 120 min after glucose load and blood glucose concentrations measured through glucometer (Accucheck Active®, Roche Diagnostic, Mannheim (BW), Germany). Insulin resistance was inferred from the calculation of TyG Index (TyG = Ln [fasting triglycerides (mg/dl) × fasting glucose (mg/dl)/2].Reference Simental-Mendia, Rodriguez-Moran and Guerrero-Romero19 Serum samples were used for measurement of glucose, TAG and FFA, and total cholesterol (TC) levels were measured by colorimetric method (spectrophotometry) using sensitive and specific commercial kits according to manufacturer’s instructions (Labtest®, Lagoa Santa (MG), Brazil).
Assessment of ex vivo lipolytic activity of white adipose tissue
Lipolytic activity was evaluated according to VaughanReference Vaughan20 using six animals per group. Periepididymal adipose tissue samples (~100 mg) were sectioned into small fragments and incubated in Krebs buffer (120 mM NaCl; 15 mM NaHCO3; 4.83 mM KCl; 1.2 mM MgSO4; 1.21 mM KH2PO4; 2.4 mM CaCl2; 1% BSA and 0.1% glucose after pH adjustment to 7.4) under pumping aeration for 1 h (37°C) in the absence (basal) and presence of 20 μM isoproterenol (Sigma-Aldrich, St. Louis (MO), USA) or 20 µM insulin (Sigma-Aldrich, St. Louis (MO), USA). After incubation, the reactions were stopped in ice bath and supernatant collected for glycerol concentration spectrophotometric measurement using a TAG-specific commercial kit, as described above.
Assessment of hepatic lipid profile
Liver samples (500 mg) were homogenised in 5 ml of chloroform/methanol (2:1) solution and left to stand overnight (4–8°C) for extraction of total fats. Then, the tissue was filtered off and the filtrate added 0.9% NaCl (saline 1:5 filtrate). This mixture was stirred, allowed to stand for 2 h and centrifuged (100 × g, 5 min) for separation of the methanol and chloroform phases. 1 ml of chloroform phase was collected and air-dried, leaving only the solid fat mass, which was weighed and expressed as total fat (mg) per tissue mass (g).Reference Freedman, Lee, Park and Jameson21 The solid fat mass was resuspended in 1 ml Triton-X 100/methanol (2:1) and thoroughly homogenised for the measurement of TAG and TC concentrations, as described above, whose values were extrapolated to be expressed as TAG or TC (mg) per tissue mass (g), reflecting their relative proportions in the total extracted fat.
Analysis of hepatic histology
Liver samples previously fixed in 10% formalin underwent dehydration, diaphanisation and paraffin inclusion, for posterior cut of 5 μm thickness slices using a microtome and staining with hematoxylin and eosin (H&E). The slices were analysed under light microscopy (100× and 400×) by two researchers in an independent blind manner according to the NAFLD activity score (NAS) criteria, which grade three main features [steatosis (0–3), lobular inflammation (0–3) and hepatocellular ballooning (0–2)], to reach a total score ranging from 0 to 8.Reference Kleiner, Brunt and Van Natta22 When discrepant scores were attributed to the same sample, a third pathologist gave the casting vote in a blind way. Average values for each feature were used for statistical comparison between HSD mice and its respective age-matched CTR group.
Hepatic gene expression by real-time polymerase chain reaction
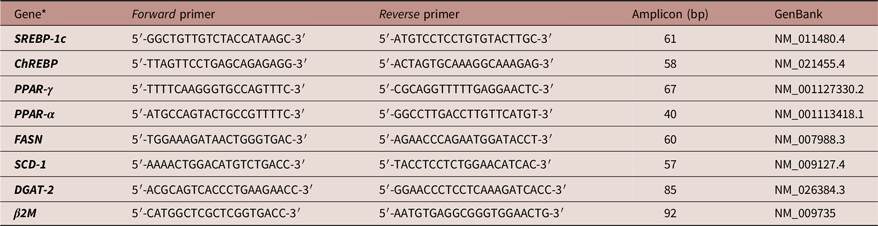
RNA samples (3 µg) were extracted from liver samples (n = 6) using Trizol reagent (Invitrogen, Germany), as per manufacturer instruction, and converted to cDNA using Super Script II Reverse Transcriptase (Invitrogen, Germany). The quantitative polymerase chain reaction (qPCR) amplification was performed by 7500 Real-Time PCR (Applied Biosystems, USA) using Platinum SYBR Green qPCR SuperMix-UDG (Invitrogen, Germany) for detection. Reactions were incubated at 50°C for 2 min and 95°C for 2 min followed by 40 cycles of 95°C for 15 s and 60°C for 1 min. To melt curve stage, reactions were incubated at 95°C for 15 s, 60°C for 60 min and 95°C for 15 s. Primers for DNL-related transcription factors and enzymes genes amplification (Table 1) were designed using Primer Express software (Applied Biosystem, USA) and manufactured by Invitrogen, Brazil. Samples were normalised to the relative levels of β-2 microglobulin (β2M), and results expressed as the fold change (FC) values of 2-ΔΔCT.
Primers sequences

* Abbreviations: SREBP-1c, sterol response element-binding protein-1c; ChREBP, carbohydrate-responsive element-binding protein; PPAR-γ, peroxisome proliferator-activated receptor-γ; PPAR-α, peroxisome proliferator-activated receptor-α; FASN, fatty acid synthase; SCD-1, stearoyl-CoA desaturase-1; DGAT-2, diacylglycerol acetyltransferase-2; β2M, beta-2-microglobulin.
Quantification of hepatic cytokines
Liver samples (~ 100 mg) were homogenised in RIPA lysis buffer (10 mM Tris HCl pH 7.5; 1% sodium deoxycholate; 1% Triton X-100; 150 mM NaCl; 0.1% SDS) plus protease inhibitors (1 mg/ml pepstatin A; 100 mM PMSF). The homogenates were centrifuged (14,000 × g, 10 min, 4 °C) and 50 μl of each sample was used for the determination of cytokines tumour necrosis factor-alpha (TNF-α), interleukin-6 (IL-6) and interleukin-10 (IL-10) by enzyme-linked immunosorbent assay (ELISA) according to the manufacturer’s instructions (R&D System, Minneapolis (MN), USA). Results were expressed as variation (Δ) of hepatic cytokines levels on HSD mice in relation to age-matched CTR mice.
Statistical analysis
Sample size was calculated using free software G * Power 3.1Reference Faul, Erdfelder, Lang and Buchner23 (Heinrich-Heine University Düsseldorf, Düsseldorf (NRW), Germany) with setting the power of study in 80%, significant level 5% and effect size determined with means and standard deviation from a previous study with HSD.Reference Pinto, Melo and Flister24 Results were expressed as mean ± standard error of the mean (SEM). Shapiro-Wilk test was applied for normality assuring. The comparisons between the two groups, in each time-point, were performed by Student’s t-test and the differences were significant when p < 0.05. All statistical analyses were performed with the software Prism 7.0 (GraphPad, San Diego (CA), USA).
Results
Obesity development
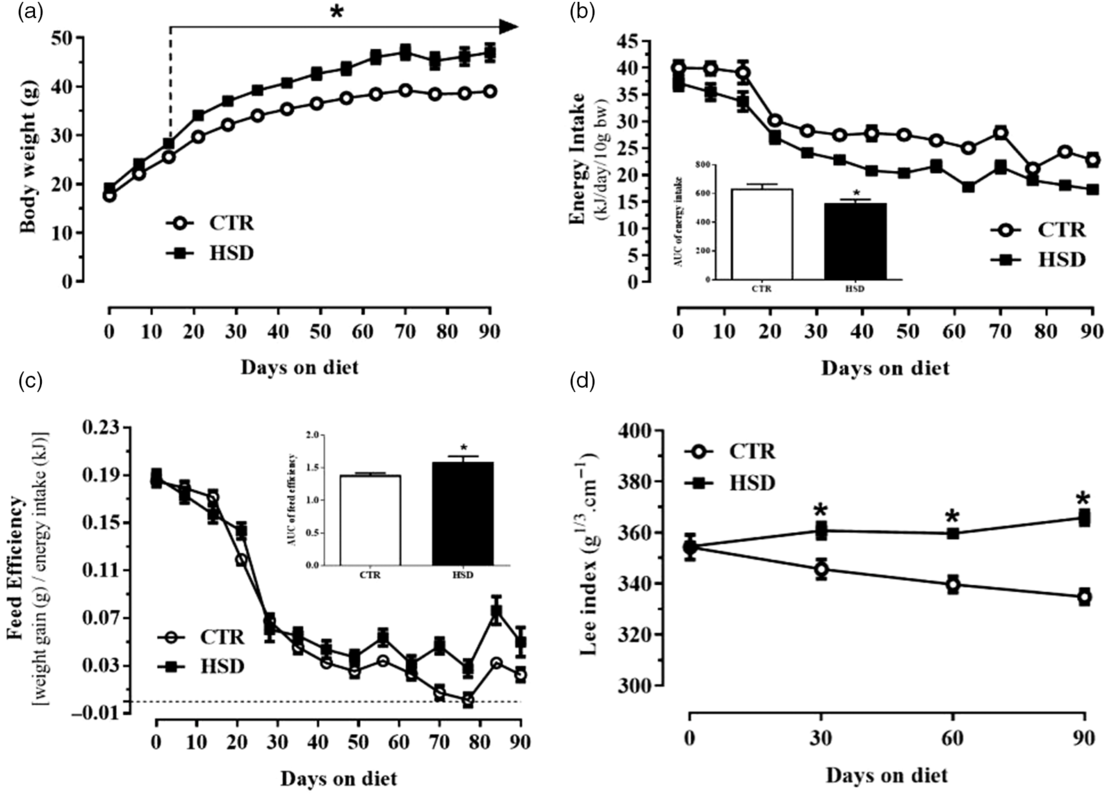
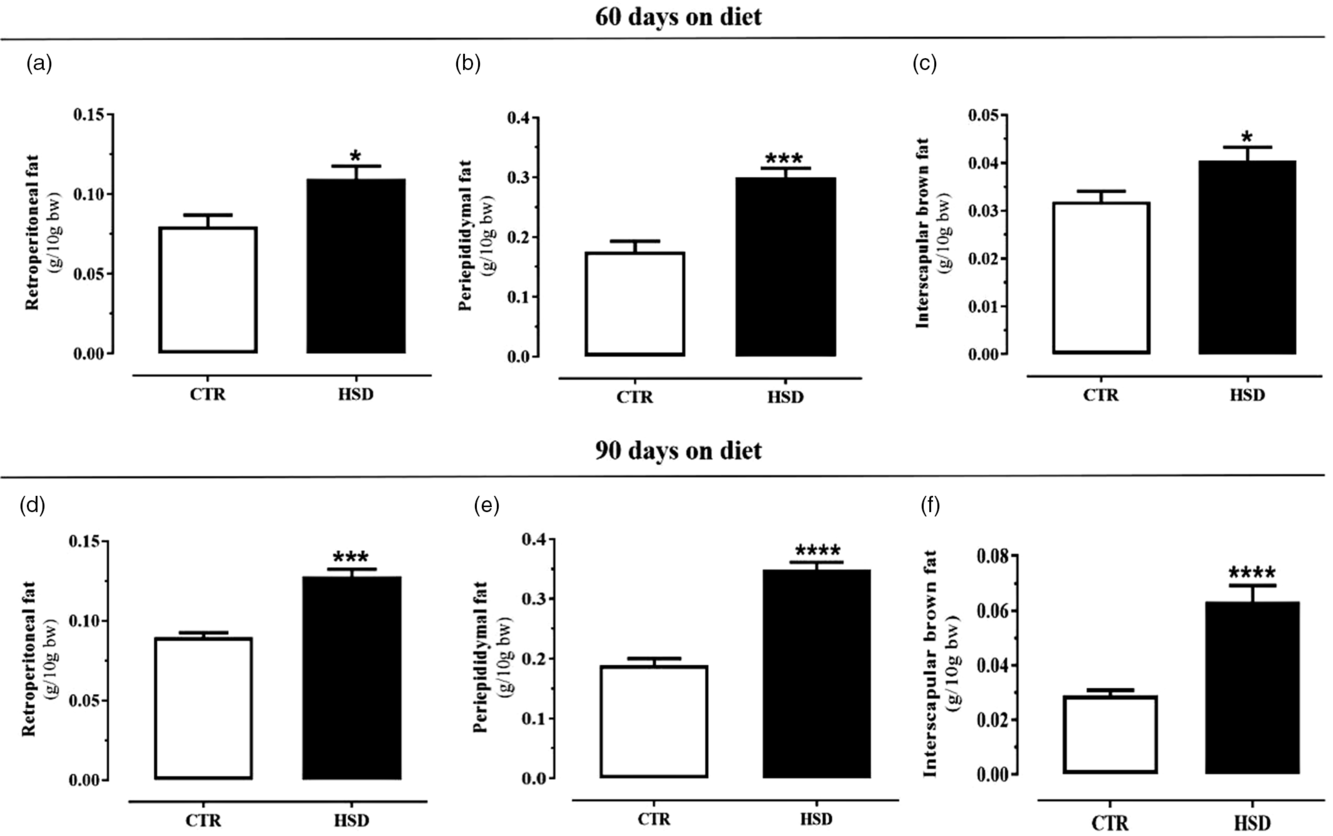
HSD mice presented higher weight gain than CTR, which started to be statistically significant by 15 days on diet and reached differences as high as 16% at 60 days and 20% at 90 days of dietary intervention (Fig. 1a). Interestingly, HSD was 20% more efficient in promoting weight gain (Fig. 1c), although energy intake by HSD mice had been 18% lower than CTR (Fig. 1b). The Lee index, which indicates mice’s body mass, was 6% higher in HSD than CTR at 30 days on diet, remaining 6% and 9% higher at 60 and 90 days of nutritional intervention, respectively (Fig. 1d). Accordingly, HSD intake resulted in greater time-dependent fat accumulation in all collected fat pads. Upon 60 days on diet, HSD mice showed retroperitoneal (Fig. 2a) and periepididymal (Fig. 2b) fat pads 26% and 70% higher than CTR, respectively, while a 33% increase was verified in interscapular BAT (Fig. 2c). Exposure to HSD for 90 days expanded those fat depots, with increases of 46%, 85% and 125% in the retroperitoneal (Fig. 2d), periepididymal (Fig. 2e) and interscapular (Fig. 2f) fat pads, respectively, as compared to CTR group.
Weight, food and morphometric monitoring. Body weight (a), energy intake (b), feed efficiency (c) and Lee index (d) were evaluated in mice fed with standard chow (CTR) or high-sucrose but isoenergetic diet (HSD) for 90 days. Dots and bars represent mean ± SEM and the differences between the groups were analysed by Student’s t-test. The dotted line indicates where the difference between the groups begins (A). *p < 0.05. n = 06 per time per group.

Adipose tissue fat pads accumulation. Relative weights of retroperitoneal (a and d) and periepididymal (b and e) white adipose tissue, as well as interscapular brown adipose tissue (c and f) pads collected from mice fed with standard chow (CTR) or high-sucrose but isoenergetic diet (HSD) for 60 or 90 days. The bars represent mean ± SEM and the differences between the groups analysed by Student’s t-test. *p < 0.05. ***p < 0.0001 vs. CTR. n = 6 per time per group.

White adipose tissue function
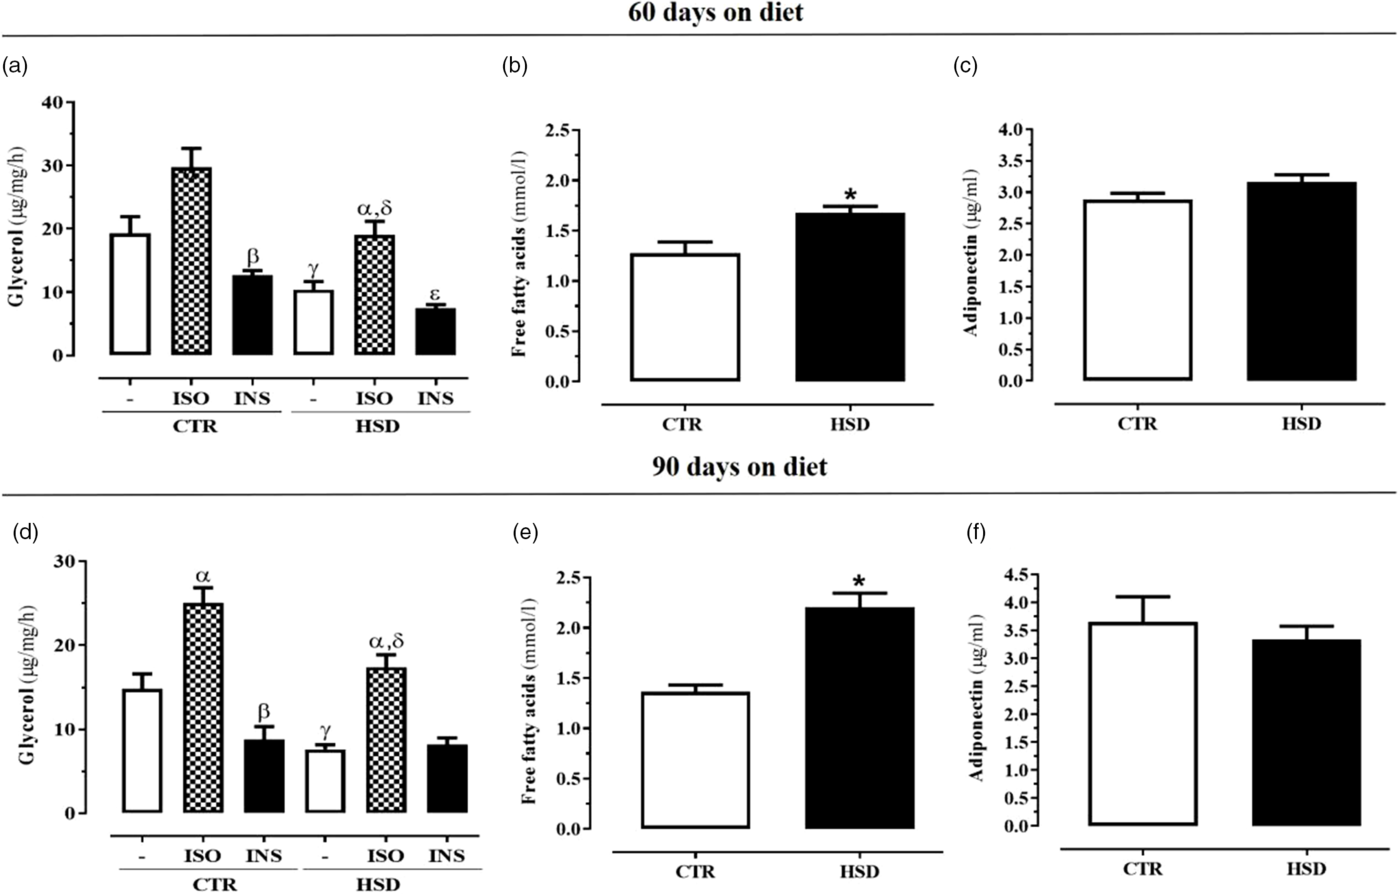
To further assess the effects of HSD on adiposity, we evaluated the lipolytic activity of periepididymal fat pad, as well as its secretory function. Assessment of ex vivo lipolytic activity showed that HSD consumption significantly impaired lipolytic response in both basal and stimulated conditions at 60 (Fig. 3a) and 90 days (Fig. 3d) on diet, as compared to CTR. This is supported by the lower glycerol release found in WAT from HSD mice when the tissue was stimulated with 20 μM isoproterenol, with reductions of 36% at 60 and 32% at 90 days on diet in relation to the response found in isoproterenol-stimulated CTR (Fig. 3a, 3d, respectively). Noteworthy, HSD mice had preserved sensitivity to anti-lipolytic effect of insulin at 60 days on diet (Fig. 3a), an effect consistently impaired at 90 days (Fig. 3d).
White adipose tissue function. Lipolytic activity of periepididymal white adipose tissue (a and d) and serum concentrations of free fatty acids (b and e) and adiponectin (c and f) of mice fed with standard chow (CTR) or high-sucrose but isoenergetic diet (HSD) for 60 or 90 days. Lipolytic activity (a and d) was evaluated by glycerol release rates of ex vivo adipose tissue isolated at baseline (-) and incubated with 20 μM isoproterenol (ISO) or 20 μM insulin (INS). The bars represent mean ± SEM and the differences between the groups analysed by Student’s t-test. *HSD vs. CTR; αISO vs. (-) and INS; βCTR + INS vs. CTR -; γHSD - vs. CTR-; δHSD + ISO vs. CTR + ISO; ϵHSD + INS vs. HSD -. *, α,β,γ,δ,ϵp < 0.05. n = 6 per time per group.

In parallel, HSD mice had serum FFA levels 30% higher than CTR (Fig. 3b) at 60 days, evolving to values 62% higher at 90 days (Fig. 3e), which implies a twofold increase of serum FFA levels within the short course of 30 days. On the contrary, there was no difference in serum adiponectin levels throughout the dietary intervention (Fig. 3c, 3f). This set of data supports an early WAT dysfunction characterised by the impairment of insulin action and consequent increase in FFA release into bloodstream; although displaying unaltered serum adiponectin levels, which suggests the absence of cytokines overflow.
Insulin–glucose axis function
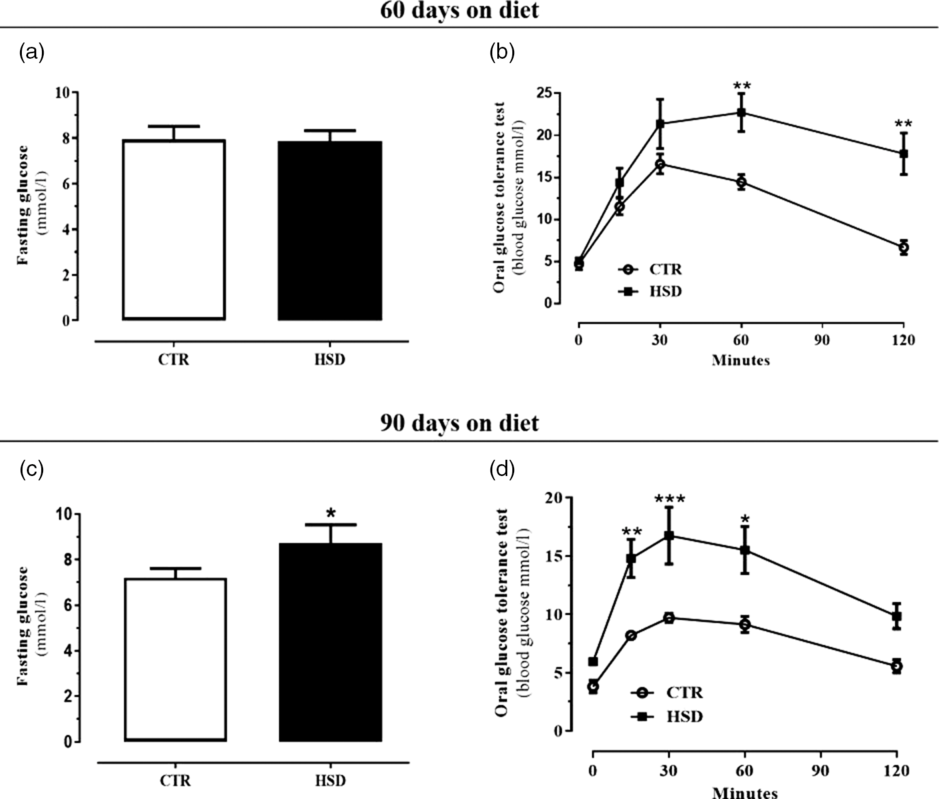
At 60 days on diet, HSD mice did not have altered fasting glycaemia (Fig. 4a), although presented glucose intolerance, depicted from the oGTT (Fig. 4b), as well as impaired peripheral insulin sensitivity, demonstrated by increased TyG Index values (Table 2). Upon additional 30-days on diet, HSD mice presented fasting serum glucose levels 20% higher than age-matched CTR mice (Fig. 4c), which coursed with deeper impairment of both glucose intolerance (Fig. 4d) and insulin sensitivity, assessed through TyG Index calculation (Table 2). Interestingly, the rising of fasting glycaemia coincided with the development of IR in the WAT (Fig. 3d), but not with the onset of peripheral IR, as presumed from TyG Index data.
Glucose homeostasis. Fasting glucose levels (a and c) and oral glucose tolerance test (oGTT) (b and d) of mice fed with standard chow (CTR) and high-sucrose but isoenergetic diet (HSD) for 60 or 90 days. oGTT (8-h fasting) was performed at 0 times (baseline) and 15, 30, 60 and 120 min after glucose bolus (2 g/kg). Dots and bars represent mean ± SEM and the differences between the groups analysed by Student’s t-test. *p < 0.05; **p < 0.01; ***p < 0.0001 vs. CTR. n = 6 per time per group.

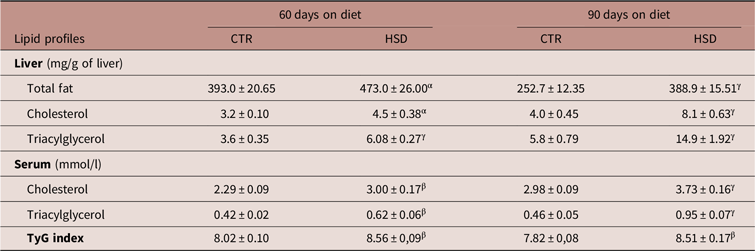
Lipid profiles of liver and serum biochemical parameters, as well as TyG index values of weaned mice fed with standard chow (CTR) or high-sucrose diet (HSD) for 60 and 90 days

Data represent mean ± SEM and were analysed by Student’s t-test. αp < 0.05; βp < 0.01 and γp < 0.0001 vs. CTR. n = 6.
Hepatic and serum lipids profile
Data on Table 2 also show that HSD intake caused intense lipid accumulation in both serum and liver. Hepatic total fat in HSD mice was augmented in both time-points, reaching levels 54% higher than CTR at 90 days on diet. Measurement of hepatic TAG and TC showed a significant increase between groups, but the relative amount in HSD versus CTR was expanded in a time-dependent manner (Table 2). In accordance, serum TAG and TC levels were proportionally augmented in HSD mice in both time-points, reaching levels 100% and 25% higher, respectively, in comparison to CTR, at 90 days on diet (Table 2). The greater effect of HSD on hepatic TAG synthesis and secretion strongly supports the establishment of IR in the liver, an outcome that corroborates TyG Index values (Table 2).
NAFLD activity score (NAS)
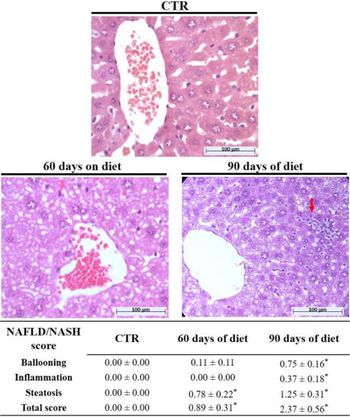
Microscopic analysis of H&E-stained liver slices according to the NAFLD activity score described by Kleiner et al.Reference Kleiner, Brunt and Van Natta22 showed that, upon 60 days on diet, HSD mice only presented simple hepatic steatosis (Fig. 5). However, at 90 days on diet it was verified the presence of hepatocyte ballooning and leukocyte inflammatory infiltration in addition to microvesicular steatosis, which characterise HSD mice as suffering from NASH (Fig. 5).
Liver histology. Liver histology from mice fed with standard chow for 90 days (CTR) or high-sucrose but isoenergetic diet (HSD) for 60 or 90 days. Representative sections (10 µm) of the liver of these animals stained with H&E are shown in the panel above. Each slide was classified according to the NAFLD/NASH score. The red arrow indicates inflammatory focus. Data are expressed as mean ± SEM and the difference between groups determined by Student’s t-test. *p < 0.05 vs. CTR. n = 6 per time per group.

Gene expression of hepatic lipid metabolism markers
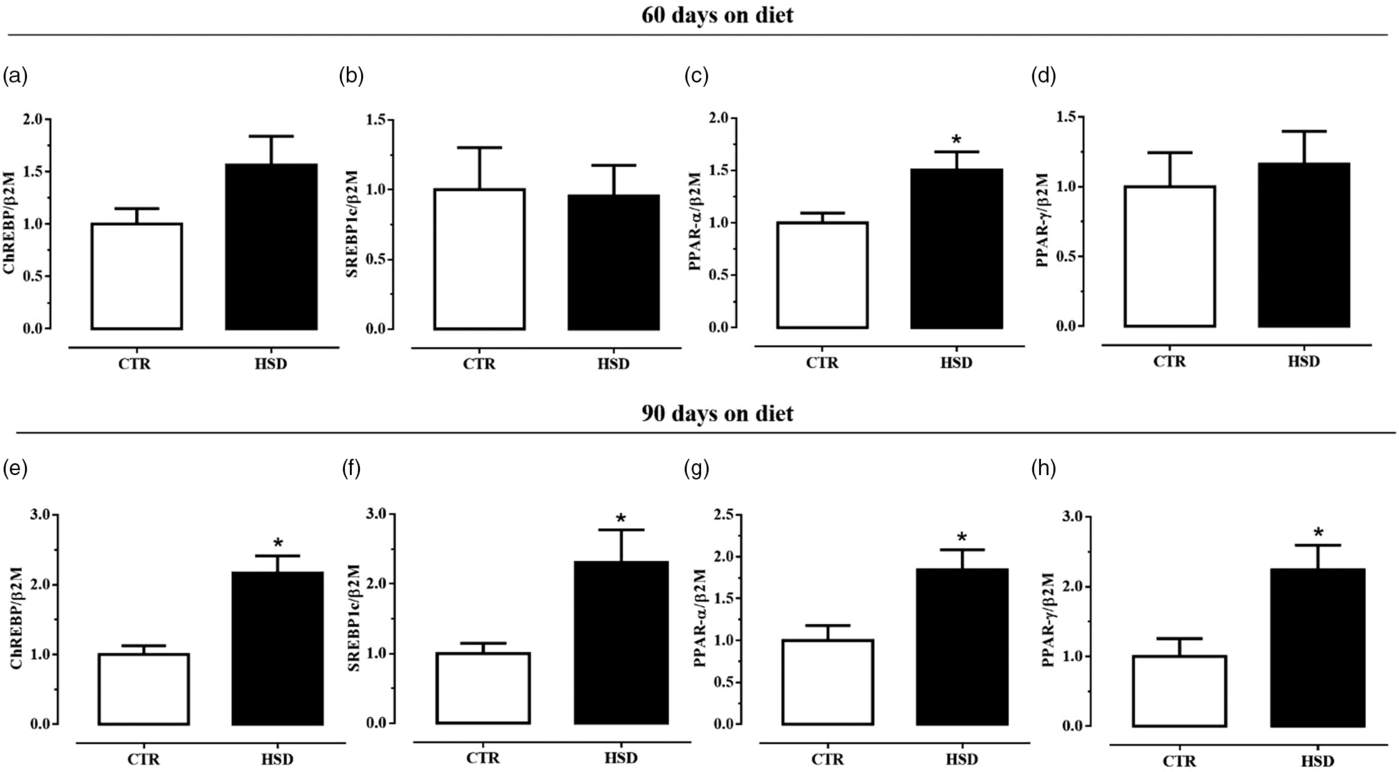
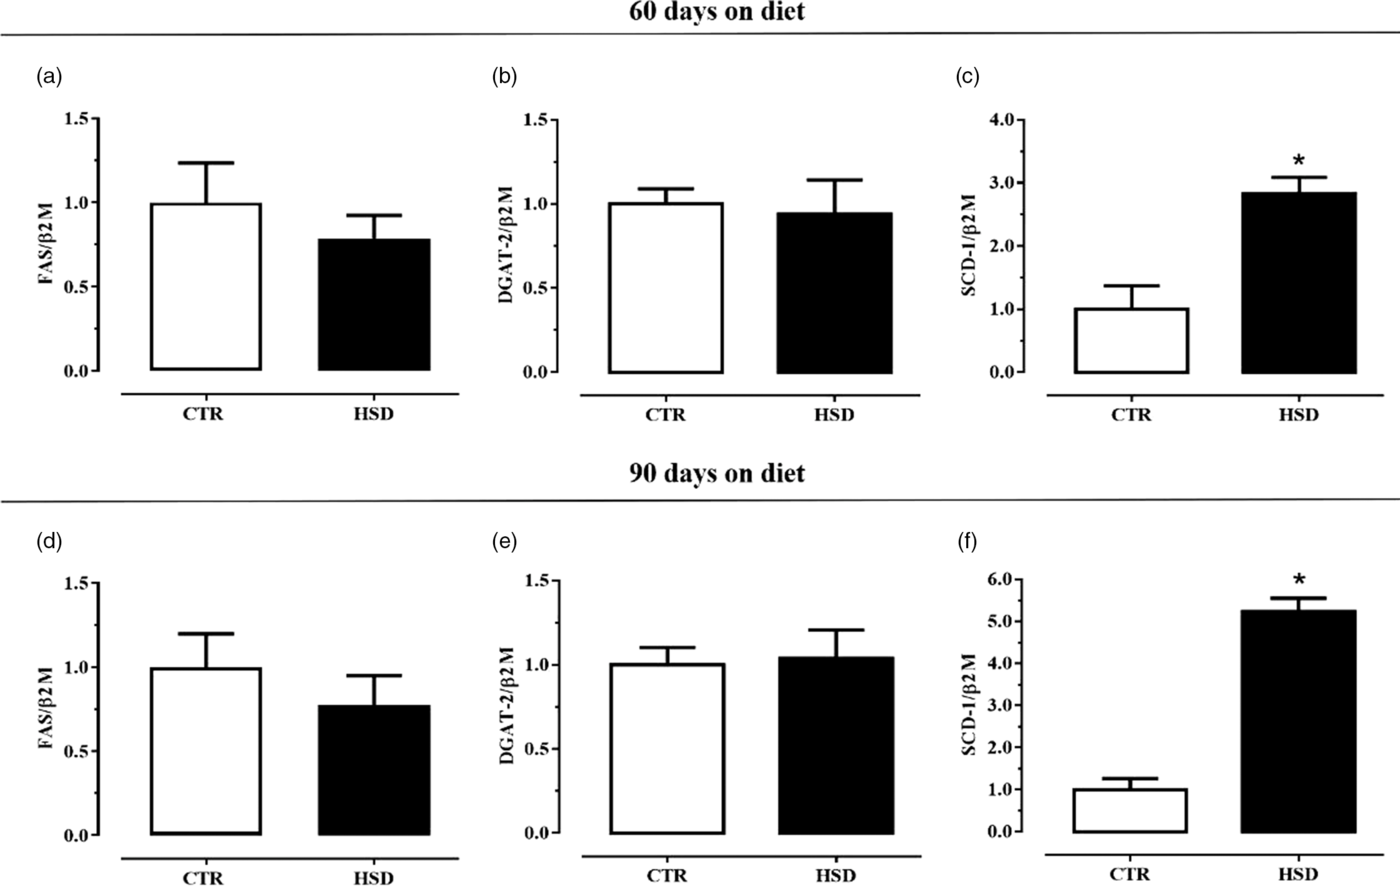
To evaluate the effects of HSD on lipid metabolism in the liver, we performed the gene expression of DNL transcription factors (Fig. 6) and enzymes (Fig. 7). At 60 days on diet, the only upregulated gene was that for peroxisome proliferator-activated receptor-α (PPAR-α) expression (Fig. 6c). However, upon 30 days of additional exposure to HSD (day 90), HSD mice showed an average twofold upregulation of all the assessed DNL transcription factors: ChREBP, SREBP-1c and peroxisome proliferator-activated receptor-γ (PPAR-γ), in addition to maintaining increased PPAR-α gene expression (Fig. 6e–h). In relation to the assessed lipogenic enzymes, the only alteration found in HSD mice was the increased expression of stearoyl-CoA desaturase-1 (SCD-1) in both times. Importantly, SCD-1 transcriptional levels expanded from a threefold increase at 60 days (Fig. 7c) to roughly more than fivefold increase at 90 days of HSD exposure (Fig. 7f), while fatty acid synthase (FASN) and diacylglycerol acetyltransferase-2 (DGAT-2) transcriptional levels did not change.
Gene expression of hepatic lipogenic transcription factors. Relative mRNA expressions of carbohydrate-responsive element-binding protein (ChREBP) (a and e), sterol response element-binding protein-1c (SREBP-1c) (b and f), peroxisome proliferator-activated receptor-α (PPAR-α) (c and g) and peroxisome proliferator-activated receptor-γ (PPAR-γ) (d and h) in livers of mice fed with standard chow (CTR) and high-sucrose but isoenergetic diet (HSD) for 60 or 90 days. All samples were normalised to the relative levels of beta-2-microglobulin (β2M), and results are expressed as the fold change values of 2-ΔΔCT as determined by qPCR. Bars represent mean ± SEM and the difference between the groups determined by Student’s t-test. * p < 0.05 vs. CTR. n = 6 per time per group.

Gene expression of hepatic lipogenic enzymes. Relative mRNA expressions of fatty acid synthase (FAS) (a and d), diacylglycerol acetyltransferase-2 (DGAT-2) (b and e) and stearoyl-CoA desaturase-1 (SCD-1) (c and f)) in livers of mice fed with standard chow (CTR) and high-sucrose but isoenergetic diet (HSD) for 60 or 90 days. All samples were normalised to the relative levels of beta-2-microglobulin (β2M), and results are expressed as the fold change values of 2-ΔΔCT as determined by qPCR. Bars represent mean ± SEM and the difference between the groups determined by Student’s t-test. * p < 0.05 vs. CTR. n = 6 per time per group.

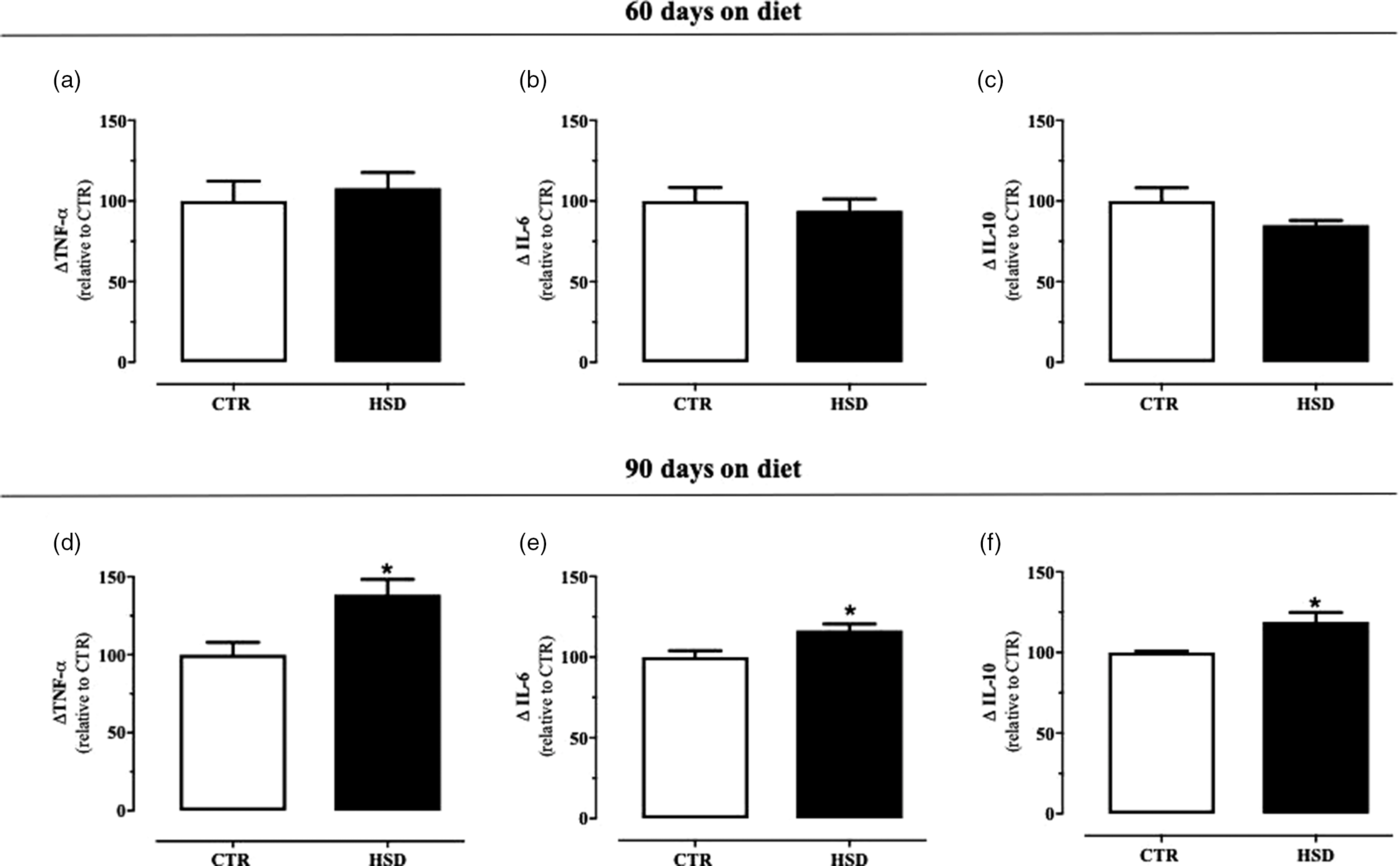
Hepatic inflammatory cytokines profile. Relative levels (Δ) of tumour necrosis factor alpha (TNF-α) (a and d), interleukin 6 (IL-6) (b and e) and 10 (IL-10) (c and f) in the liver of mice fed a high-sucrose but isoenergetic diet (HSD) as compared to standard chow-fed mice (CTR) for 60 or 90 days. The bars represent mean ± SEM and the differences between the groups were determined by Student’s t-test. * p < 0.05 vs. CTR. n = 6 per time per group.

Hepatic inflammatory cytokines profile
There was no difference in the in hepatic concentrations of TNF-α, IL-6 and IL-10 between groups at 60 days on diet, as compared to age-matched CTR group (Fig. 8a–c). However, corroborating NAS data (Fig. 5), 90 days’ exposure to HSD increased the expression of TNF-α (Fig. 8d), IL-6 (Fig. 8e) and IL-10 (Fig. 8f) in 39%, 16% and 19%, respectively, in relation (Δ) to age-matched CTR groups.
Discussion
Many studies have used sugar-rich diets to evaluate metabolic programming of offspring through dams’ exposure during gestation or lactation.Reference Lee, Wu, Leu and Tain5,Reference D’Alessandro, Oliva, Fortino and Chicco25 However, the post-weaning period is much less investigated, even being considered a critical window for developmental programming.Reference Bouwman, Fernandez-Calleja and Swarts26 Moreover, most studies using mono- or disaccharide-rich diets have focused on total energy intake instead of the nutritional composition of such diets.Reference D’Alessandro, Oliva, Fortino and Chicco25,Reference Moore, Gunn and Fielding27,Reference Kjaergaard, Nilsson, Rosendal, Nielsen and Raun28 Therefore, in this study we applied a high-sucrose but isoenergetic diet (HSD) since weaning through young adulthood to assess mid-term metabolic factors involved in NAFLD-to-NASH progression. Our data show that 60-day exposure to HSD promoted adipose tissue expansion associated with dyslipidaemia and simple hepatic steatosis. However, extending exposure time to 90 days resulted in the development of IR in the WAT, with consequent increase in FFA release, upregulation of lipogenic genes and establishment of hepatic inflammation, which led NAFLD to progress towards NASH.
Post-weaning exposure to excess sucrose promptly promoted weight gain in our HSD mice, leading them to show increased body mass by the two time-points herein determined, 60 and 90 days on diet. Distinctly from Wistar rats, which are much harder to get fatty under the same diet,Reference Pinto, Melo and Flister24,Reference de Queiroz, Coimbra and Ferreira29 Swiss mice showed themselves to be very susceptible to this dietary intervention. Interestingly, this speedy weight gain occurred despite the fact they had a lower energy intake throughout the experimental time. This is reliably explained by the action of the sucrose- and lactose-derived glucose, contained in HSD as table sugar and condensed milk, on hypothalamic hunger/satiety centres by inducing malonyl-CoA expression, which suppresses signalling pathways activated by orexigenic neuropeptides, such as neuropeptide Y and agouti-related protein.Reference Lane and Cha30 There is additional evidence that high-sucrose but not high-fat diet induces oxytocin-mediated mechanisms which suppress certain types of feeding reward, as a kind of protection against overeating carbohydrates.Reference Klockars, Levine and Olszewski31 Notwithstanding, increased body weight gain was likely maintained because of the effects of sucrose-derived fructose on both lipogenesis and adipogenesis. Fructose undergoes high uptake rate in both the hepatocytesReference Tappy and Le32 and adipocytes,Reference Masoodi, Kuda, Rossmeisl, Flachs and Kopecky33 where it is readily metabolised into TAG, an effect exacerbated by its co-ingestion with glucose such as in sucrose-rich diets.Reference Kolderup and Svihus34 In addition, fructose overload increases GLUT5 expression in WAT,Reference Legeza, Balazs and Odermatt35 concurring for WAT hyperplasia as well as adipocyte hypertrophy.Reference Hernandez-Diazcouder, Romero-Nava, Carbo, Sanchez-Lozada and Sanchez-Munoz36 Noteworthy, most HSD-induced metabolic disturbances are reversible by the withdrawal of excess dietary sucrose.Reference Sousa, Ribeiro and Pinto37
On the contrary, we cannot rule out the possible impact of the lower protein content in our HSD on body weight gain. Studies have shown that long-term exposure to diets containing distinct low-protein/high-carbohydrate ratios lead to increased body weight, adiposity and fatty liver, getting worse as protein goes down and carbohydrate goes high.Reference Solon-Biet, McMahon and Ballard38–Reference Sorensen, Mayntz, Raubenheimer and Simpson40 Our HSD has 12.3% of its energy density as protein, which makes it a mid-protein diet instead of a low-protein diet.Reference Jimenez-Gancedo, Agis-Torres, Lopez-Oliva and Munoz-Martinez41,Reference Taillandier, Bigard, Desplanches, Attaix, Guezennec and Arnal42 This mid-protein/high-sucrose ratio is expected to promote milder metabolic outcomes than those imposed by low-protein/HSDs, supporting the high-sucrose intake as the main contributor for higher adiposity in our HSD mice.
Ex vivo experiments showed that periepididymal WAT from HSD mice had decreased lipolysis at both basal and isoproterenol-stimulated conditions, which might concur for increased fat mass. Dysfunctional lipolytic response to sympathetic stimulus has already been described for rodents on either sucrose-Reference Pinto, Melo and Flister24 or fructose-richReference Rizkalla, Luo and Guilhem43 diets. Such outcome is mainly ascribed to increased catecholamine resistance on adipocyte β2-adrenoceptor that leads to increased stimulation of anti-lipolytic α2-adrenoceptors.Reference Jocken and Blaak44 Still, impairment of insulin-dependent β-adrenergic lipolysis would play an additional role.Reference Guilherme, Henriques, Bedard and Czech45 Insulin is one of the major anti-lipolytic agents acting on WAT, which acts by decreasing hormone-sensitive lipase activity in adipocytes, besides other mechanisms.Reference Masoodi, Kuda, Rossmeisl, Flachs and Kopecky33 WAT from 90-day, but not 60-day, fed HSD mice was unresponsive to insulin stimulus, denoting an additional mechanism for their adipose tissue dysfunction. Impairment of WAT insulin sensitivity is well established for both rodentsReference Samuel and Shulman46 and humansReference Stanhope, Schwarz and Keim47 suffering of MetS, which leads to lower FFA recycling inside the tissue and its increased secretion into bloodstream.Reference Masoodi, Kuda, Rossmeisl, Flachs and Kopecky33 Accordingly, relative increase in serum FFA levels in 90-day-fed HSD mice, in comparison to their age-matched CTR, was twice that seen at day 60, suggesting a worse WAT dysfunction. Late development of fasting hyperglycaemia is also supported by the concurrent onset of IR on WAT. On the contrary, HSD mice did not show altered serum levels of adiponectin at any time-point. A recent prospective study with rats fed with a high-sugar diet showed that adiponectin serum levels may or may not increase depending on the time of exposure to diet.Reference Aslam and Madhu48 Indeed, the upregulation of adiponectin expression has been associated with the onset of inflammatory response on WAT.Reference Roden and Shulman49 Despite the fact that we have not assessed inflammatory markers on WAT, which constitutes a limitation in our study, this set of data supports the hypothesis that insulin resistance-derived lipolysis is an early event, whereas inflammation with cytokine spillover constitutes late alterations in the course of WAT dysfunction.Reference Roden and Shulman49
Liver is the main recipient for FFA coming from dysfunctional WAT, where these lipids are esterified to render TAG which is stored in hepatocyte lipid droplets or incorporated into VLDL particles for secretion.Reference Neuschwander-Tetri50 VLDL particles assembly and secretion is closely regulated by insulin-dependent signalling, leading to hypertriglyceridemia upon hepatic IR.Reference Kamagate, Qu and Perdomo51 On the contrary, fructose is rapidly metabolised by hepatocytes, leading to the upregulation of hepatic DNL and ultimate conversion of fructose itself into fatty acids.Reference Softic, Gupta and Wang12 Sustained DNL activation intensifies FFA-derived ectopic lipid accumulation that also impairs insulin signalling inside a vicious cycle towards NAFLD worsening.Reference Chen, Yu, Xiong, Du and Zhu52 All the aforementioned set of predisposing factors was present after 60-day exposure to HSD diet because HSD mice presented increased serum and hepatic TAG levels, increased TyG Index value and simple steatosis, but no inflammatory response was verified, neither as hepatic leukocyte infiltration, nor as cytokines overexpression. TyG Index was first proposed in 2008 by Simental-Mendia et al.Reference Simental-Mendia, Rodriguez-Moran and Guerrero-Romero19 as a surrogate measure of peripheral IR in humans. Since then, it has been reliably validated in comparison to other methods, such as euglycaemic clamp and HOMA-IR,Reference Guerrero-Romero, Simental-Mendia and Gonzalez-Ortiz53–Reference Mohd Nor, Lee, Bacha, Tfayli and Arslanian56 and consistently applied for studies in both ratsReference Bonfleur, Borck and Ribeiro57–Reference Gonzalez-Torres, Vazquez-Velasco and Olivero-David60 and mice.Reference Flister, Pinto and Franca13,Reference Nunes-Souza, Cesar-Gomes, Da Fonseca, Guedes Gda, Smaniotto and Rabelo61–Reference Coelho, Franca and Nascimento63
Next, we sought to characterise the transcriptional profile of DNL-related genes to assess the impact of both increased portal FFA levels and hepatocyte sucrose-derived fructose uptake per se on lipid metabolism in the liver. At day 60, HSD mice showed threefold increased SCD-1 transcriptional levels, which coincided with increased gene expression of PPAR-α. SCD-1 is the rate-limiting enzyme catalysing TAG synthesis,Reference AM, Syed and Ntambi64 whereas PPAR-α plays a pivotal role against fatty acid-induced lipotoxicity by upregulating lipid β-oxidation pathways.Reference Gross, Pawlak, Lefebvre and Staels65 Such counterbalancing response probably retained steatosis worsening on HSD mice at this time-point. On the contrary, at day 90 all the assessed DNL-related transcription factors were equally upregulated on HSD mice. SREBP-1c and ChREBP are major regulators of lipid synthesis in response to hormonal and nutritional signals.Reference Softic, Gupta and Wang12 Both transcription factors were recently demonstrated to interdependently regulate lipogenic response to chronic sucrose or fructose intake.Reference Linden, Li and Choi66 In the meantime, SCD-1 overexpression was strongly augmented to levels fivefold higher than age-matched CTR mice. We have recently described this sole upregulation of SCD-1 gene expression in chronically HSD-fed mice.Reference Flister, Pinto and Franca13SCD-1 has been shown to mediate the induction of SREBP-1c expression by chronic fructose feeding, which partially activates a positive feedback loop to further induce the expression of SCD-1 gene and promote TAG synthesis.Reference Softic, Gupta and Wang12,Reference Miyazaki, Dobrzyn and Man67 However, absence of FASN and DGAT-2 induction suggests a minor role for the fructose – SCD-1 – SREBP-1c axis activation, favouring the FFA-driven SCD-1 overexpression in a SREBP-1c-independent pathway. This rationale is strongly supported by in vitro data, showing that SCD-1 expression in HepG2 cells was increased by nearly fourfold upon incubation of 0.5 mM palmitate, an increment not changed by SREBP-1c silencing.Reference Bai, Dong, Yang and Zhang68
The consistent DNL induction verified at day 90 is seemingly responsible for the robust expansion of TAG accumulation in both serum and liver, which coincided with the progression of NAFLD pattern from simple steatosis to NASH, with detectable cellular ballooning, leukocyte infiltration and local pro-inflammatory cytokines (TNF-α and IL-6) overflow. Of note, only at this time-point, HSD mice presented twofold increased hepatic transcriptional levels of PPAR-γ, whose ectopic overexpression in the liver has been associated with the expansion of TAG storage within lipid droplets,Reference Yu, Matsusue and Kashireddy69 likely to accommodate excess TAG production. Some factors are reasonably accountable for this switch. Peripheral IR per se is able to promote NAFLD-to-NASH progression,Reference Reccia, Kumar and Akladios70 but it does not seem to be the causal factor given 60-day-fed HSD mice had IR but no hepatic inflammation. Lipotoxicity-associated apoptosis promotes the release of damage-associated molecular patterns (DAMPs), which induce Kupffer and stellate cells to produce pro-inflammatory cytokines,Reference Farrell, Van Rooyen, Gan and Chitturi71,Reference Kubes and Mehal72 but hepatic caspase-3 gene expression was unchanged (data not shown). On the contrary, the consistent elevation of serum FFA levels released from the dysfunctional insulin-resistant WAT is a feasible responsible for the development of NASH, apparently mediated by greater TAG storage following SCD-1 overexpression. Sucrose and fructose have been shown to shortly and directly upregulate SCD-1 expression,Reference Miyazaki, Dobrzyn and Man67,Reference Ntambi73 but the absence of hepatic inflammation in 60-day-fed HSD mice advocates for its main role on simple steatosis onset. Contrariwise, FFA has been shown both to induce SCD-1 overexpressionReference Bai, Dong, Yang and Zhang68 and promote NASH development in chronically high-sucrose-fed mice in a way dependent on hepatic TNF-α expression.Reference Feldstein, Werneburg and Canbay74 Alike, corroborative evidence from high-fat diet-fed sirtuin 1 knockout mice demonstrated that release of FFA from mesenteric adipose tissue promotes NAFLD recrudescence by induction of hepatic lipogenesis characterised by upregulated transcriptional levels of SREBP-1c and SCD-1, but unchanged FASN and DGAT-2 levels.Reference Cheng, Liu and Hu75
In conclusion, our study supports the onset of IR in the dysfunctional WAT with consequent increase in FFA release as a major switch factor for NAFLD-to-NASH progression in mice exposed to mid-term high-sucrose feeding from weaning through young adulthood through mechanisms presumably involving SCD-1 overexpression in a SREBP1-c-independent manner. Moreover, our data are suggestive that childhood and adolescence constitute susceptible periods for fast progression of metabolic disturbances associated with added sugars consumption, as recently described for high-fat diet.Reference Cheng, Ton, Phang, Tan and Abdul Kadir76 Last but not least, our study forewarns against early introduction of added sugars in infant diet, particularly following breastfeeding cessation.
Acknowledgements
The authors are grateful to the staff of LeFisio and LIM51 for all the technical support during experimental procedures. In particular, they are thankful to Prof. Heraldo P. de Sousa, Ph.D. and Prof. Thais M. de Lima, Ph.D. for their suggestions on some experiments.
Financial Support
This work received financial support from Fundação de Amparo à Pesquisa e ao Desenvolvimento Científico, Tecnológico e Inovação do Estado do Maranhão – FAPEMA (Universal 00643/15 and Universal 01571/16) and Coordenação de Aperfeiçoamento de Pessoal de Nível Superior – Brasil (CAPES) – Finance Code 001. PS received PIBIC fellowship from National Council for Scientific and Technological Development (CNPq). AP received Researcher fellowship from FAPEMA (BEPP-02511/18) and CNPq (308163/2019-2).
Conflicts of Interest
None.
Ethical Standards
All the procedures involving mice are in accordance with National Council for the Control of Animal Experimentation (CONCEA, Brazil) and approved by the Committee for Ethics and Welfare on Animal Use (CEUA) of the UFMA under ruling No 23115.002832/2017-25.