Implications
In cattle systems, many farmers utilize feeding models to estimate protein requirements. However, most models recognize the importance of urea nitrogen (N) recycling in the rumen, but not all account for it. In such situation, a tendency to oversupply dietary CP may occur, leading to higher feed costs and N excretion. As N excreted can contribute to air and water pollution, more efficient feeding strategies are required to maximize N utilization. In this study, we used a meta-analytical approach to obtain models that could be useful to improve the knowledge on N utilization and to decrease N losses and negative impacts on the environment.
Introduction
Urea recycling to the rumen is an evolutionary advantage for ruminants because it provides a source of N for microbial protein synthesis and enhances survival (Reynolds and Kristensen, Reference Reynolds and Kristensen2008). Even in ruminants with high CP intake, urea recycling is important to maintain a positive N balance (Lapierre and Lobley, Reference Lapierre and Lobley2001). Urea kinetics have been measured successfully in a range of studies on ruminants by using a relatively non-invasive technique developed for sheep (Sarraseca et al., Reference Sarraseca, Milne, Metcalf and Lobley1998; Lobley et al., Reference Lobley, Bremner and Zuur2000). This procedure involves infusion or injection of (15N15N)-urea in the jugular vein followed by measurement of the enrichment of (15N14N)- and (15N15N)-urea excreted in the urine as well as fecal 15N excretion. However, the original method does not measure the ruminal microbial incorporation of recycled urea N. Supplemental methodologies have been described to measure the ruminal capture of recycled urea N through measurement of 15N enrichment in bacterial and plasma urea N (PUN; Marini and Van Amburgh, Reference Marini and Van Amburgh2003) or in bacterial and duodenal N (Wickersham et al., Reference Wickersham, Titgemeyer, Cochran and Wickersham2009a).
Urea N recycling and assimilation by ruminal microbes are influenced by dietary and ruminal factors, and intakes of CP and digestible organic matter (OM) are major factors (Harmeyer and Martens, Reference Harmeyer and Martens1980; Kennedy and Milligan, Reference Kennedy and Milligan1980). A better understanding of the relationships between dietary factors and urea kinetics and microbial usage of recycled urea would allow for a more accurate estimation of N supply and N requirements by current feeding models. Therefore, we evaluated urea kinetics and microbial assimilation of recycled urea N by ruminants according to N intake and dietary protein concentration using a meta-analytical approach.
Material and methods
Data acquisition
The database used was collected from 25 experiments published from 2001 to 2016, including a total of 107 treatment means. The list of references used for the meta-analysis is given in the Supplementary Material S1. The prerequisites for a study to be included in the data set were an evaluation of the nutritional characteristics (i.e. dry matter (DM) intake, CP or N intake, OM intake and digestibility or digestible OM (DOM)) and an evaluation of urea kinetics using the model developed by Lobley et al. (2000) (i.e. urea N entry rate (UER, g/d), urinary urea N elimination (UUE, g/g UER), gastrointestinal entry rate of urea N (GER, g/g UER), re-entry to ornithine cycle (ROC, g/g GER), urea N to fecal excretion (UFE, g/g GER), and urea N utilized for anabolism (UUA, g/g GER)), and microbial incorporation of recycled urea according to methods validated by Wickersham et al. (Reference Wickersham, Titgemeyer, Cochran and Wickersham2009a) (i.e. microbial N from recycled urea N (MNU, g/g GER)). In addition, although there are recent studies involving the arterio-venous technique (Kristensen et al., Reference Kristensen, Storm and Larsen2010; Røjen et al., Reference Røjen and Kristensen2011; Røjen and Kristensen, Reference Røjen, Theil and Kristensen2012), we decided to use in the data set only experiments with the isotope method (Lobley et al., Reference Lapierre and Lobley2001), because it permits evaluation of all urea fates.
The data set encompassed information from different animal species and categories (growing beef cattle, dairy cattle and sheep). Information concerning N intake, UER and GER (g/d) was scaled to BW0.75 to allow comparisons of different species and categories, considering that metabolic processes may be described as a function of metabolic BW (Brody, Reference Brody1945). We tried to collect additional information from the data set that might be useful in describing the responses, such as dietary concentrations of ruminally degradable protein, ruminally undegradable protein and starch. However, most of these data were either absent or incomplete, which compromised the inferences. Therefore, such information was not included in the data set.
Statistical methods
The data were analyzed by meta-analysis techniques (St-Pierre, Reference St-Pierre2001; Van Houwelingen et al., Reference Van Houwelingen, Arends and Stijen2002), using the mixed procedures of SAS (version 9.4; SAS Institute Inc., Cary, NC, USA) for non-linear (NLMIXED) and linear (MIXED) models (Littell et al., Reference Littell, Milliken, Stroup, Wolfinger and Schabenberger2006). The random effect of the different subjects (experiments) was considered in the regression parameters for both linear and non-linear models. For the linear models, the adequacy of the models and the best covariance structures were evaluated using the corrected Akaike’s information criterion. All variance components in the linear models were estimated using the restricted maximum likelihood method.
For the non-linear models, the random variance representative of the variation among experiments was associated to each parameter of the model. When this random variance associated to the experiments was found non-significant (P>0.05) for a specific parameter of the model, a new model was then adjusted, excluding that specific random effect. The dual quasi-Newton method was used as the optimization technique. In addition, the integration was performed using the adaptive Gaussian quadrature (Littell et al., Reference Littell, Milliken, Stroup, Wolfinger and Schabenberger2006). For selecting a linear or non-linear model for a specific relationship, a graphic analysis of the ordinary residuals was performed. The structure of models was also determined based on biological meaning of the parameters and curve shape. The coefficients of determination (r 2/R 2) of adjusted models were calculated as the square of the correlation between predicted and observed values.
When non-linear models were adjusted, two specific evaluations were performed to improve the biological interpretation of data. For non-linear exponential models without an asymptotic value, the point of maximum curvature was evaluated. This point indicates the value of the independent variable where there is a modification of the response pattern with a more prominent increase or decrease in the first derivative of the adjusted model. This specific point is defined as the point with the maximum distance between the adjusted model and a straight line linking the predicted response for minimum and maximum values of the independent variable. For non-linear models with an asymptotical response, it was identified the point where the response become stable as the value of the independent variable where the adjusted model enters the asymptotic 95% confidence interval for the asymptote (Valente et al., Reference Valente, Detmann, Queiroz, Valdares Filho, Gomes and Figueiras2011). All statistical evaluations were considered significant at P⩽0.05 as the critical (asymptotical) level for the occurrence of type I error.
Results
Description of the database
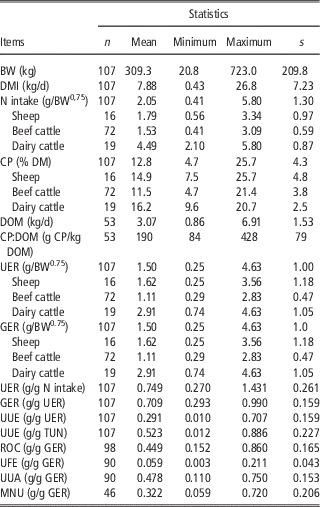
A description of the animal factors, dietary characteristics, urea kinetics and microbial incorporation of recycled urea N in the current meta-analysis is shown in Table 1. There were broad ranges of dietary characteristics: dietary CP ranged between 4.7% and 25.7% of DM, and the ratio of CP to DOM (CP:DOM), an indicator of dietary protein:energy, ranged from 84 to 428 g CP/kg DOM. Thus, the data set included a range of low- to high-protein diets. In this study, information regarding N intake, UER and GER as a function of BW0.75 was compared across species/categories to evaluate if they could be analyzed as a homogenous data set. However, there was a significant difference between species for all these variables (data not shown). The N intake, UER and GER in a BW0.75 basis and UER and GER per unit of N intake were greater for sheep compared with growing beef cattle and dairy cattle (P<0.001), although all these relationships were found similar for cattle categories (P⩾0.52). Because the number of treatment means for sheep was quite low (n=16), accurate models could not be obtained for sheep, so only the data sets from beef and dairy cattle were used in the meta-analysis.
Statistical description of the data set used for the analysis of urea kinetics and microbial use of recycled urea in ruminants

s=standard deviation; DMI=dry matter intake; CP=dietary CP concentration (% of DM); DM=dry matter; DOM=digestible organic matter intake; CP:DOM=ratio between intakes of CP and digestible organic matter; UER=urea N entry rate; GER=gastrointestinal entry rate of urea N; UUE=urinary urea N elimination; TUN=total urinary N; ROC=urea N re-entry to ornithine cycle; UFE=urea N to fecal excretion; UUA=urea N utilized for anabolism; MNU=microbial incorporation of recycled urea N.
Urea kinetics
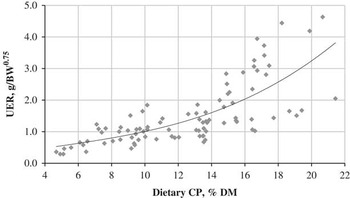
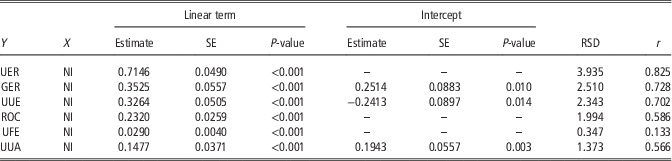
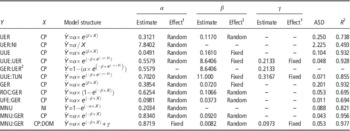
Urea N synthesized in the liver was positively correlated with N intake (P<0.05). From the linear regression between N intake and UER, net urea N release by the liver accounted for 71.5% of N intake in cattle (Table 2). In addition, the intercept of the linear regression was not significant (P>0.05) and the intercept was set to 0. The UER, on a g/BW0.75 basis, increased exponentially (P<0.05) according to dietary CP concentration (Table 3 and Figure 1). Maximum curvature analysis indicated that above 17% of dietary CP the hepatic synthesis of urea N may have become more prominent than below 17% CP. Although above 16% of dietary CP there was a separation in two groups, they were not homogenous (i.e. above the fitted line are dairy cattle and below the fitted line are beef cattle; Figure 1). There was no relationship between UER and CP:DOM ratio. The UER expressed as a fraction of N intake (UER:NI, g UER/g N intake) was inversely associated with the dietary CP concentration (P<0.05) and the relationship was described by a hyperbolic model (Table 3). According to the adjusted model it should be necessary fed a diet with at least 7.84% of CP to obtain a UER:NI <1.
Relationship between dietary CP concentration and urea N entry rate (UER) in cattle. Details of the model are in Table 3. DM=dry matter.

Summary of the linear models for describing the pattern of urea kinetics in function of N intake in cattle

UER=urea N entry rate (g/BW0.75); NI=N intake (g/BW0.75); GER=gastrointestinal entry rate of urea N (g/BW0.75); UUE=urinary urea N elimination (g/BW0.75); ROC=urea N re-entry to ornithine cycle (g/BW0.75); UFE=urea N to fecal excretion (g/BW0.75); UUA=urea N utilized for anabolism (g/BW0.75).
Summary of the non-linear models for describing the pattern of urea kinetics and microbial use of recycled urea in cattle

ASD=asymptotic SD of the relationship; UER=urea N entry rate (g/BW0.75); CP=dietary CP concentration (% of dry matter); UER:NI=UER to N intake ratio (g UER/g N intake); UUE=urinary urea N elimination (g/BW0.75); UUE:UER=urinary urea N elimination relative to entry rate of urea N (g UUE/g UER); UUE:TUN=urinary urea N elimination relative to total urinary N excretion (g UUE/g TUN); GER=gastrointestinal entry rate of urea N (g/BW0.75); ROC:GER=urea N re-entry to ornithine cycle relative to gastrointestinal entry rate of urea N (g ROC/g GER); UFE:GER=urea N to fecal excretion relative to gastrointestinal entry rate of urea N (g UFE/g GER); MNU=microbial incorporation of recycled urea N (g/BW0.75); NI=N intake (g/BW0.75); MNU:GER=microbial incorporation of recycled urea N relative to gastrointestinal entry rate of urea N (g MNU/g GER); CP:DOM=ratio between dietary CP and digestible organic matter concentrations (g CP/kg digestible organic matter).
1 A random effect type means that a random variance component was associated to the parameter (P<0.05). A fixed effect type indicates that the random variance (among experiments) was not significant (P>0.05).
2 This model has been parameterized as the complement of the model adjusted for the relationship between UUE:UER and CP.
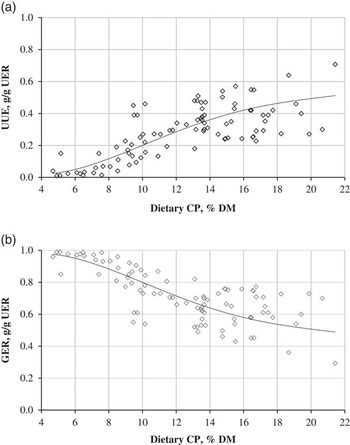
The fraction of UER as UUE (UUE:UER, g UUE/g UER) was positively associated with CP concentration (P<0.05) and was described by a Gompertz function (Table 3; Figure 2a). From the model-predicted, UUE:UER reached the asymptotic confidence interval (1–α=0.95) for the asymptote of the model at 17.6% CP. From the linear relationship between UUE and NI (g/BW0.75), increases in UUE accounted for 32.6% of increases in N intake in cattle with an intercept differing of zero (Table 2). Regarding the amount of urinary urea N excretion, there was an exponential increase (P<0.05) with dietary CP levels (Table 3). For this exponential relationship, the maximum curvature was at 14.8% dietary CP. Considering a broad range of dietary CP, we observed that the contribution of urea N to total urinary N (UUE:TUN) was positively associated with dietary CP (P<0.05) and the fitted model was a Gompertz function (Table 3). Considering the asymptotic confidence interval (1–α=0.95) from this equation, UUE:TUN was not different from plateau (0.70) when dietary CP reached 15.9%, which yielded a UUE:TUN ratio of 0.65.
Relationship between dietary CP concentration and the fraction of urea N entry rate (UER) in cattle (a) eliminated in the urine (UUE); and (b) recycled to the gastrointestinal tract via epithelium and saliva (GER). Details of the model are in Table 3. DM=dry matter.

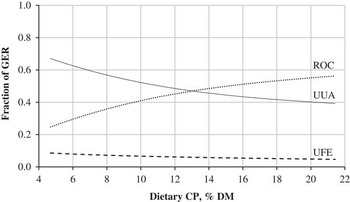
In the current meta-analysis, increases of N intake were linearly associated (P<0.001) with increases in the amount of urea N recycled and the intercept was significant (P=0.01), with the increases in recycling accounting for about 35% of increases in N intake (Table 2). In addition, the amount of urea N recycled increased exponentially (P<0.05) as the CP of the diet increased (Table 3). The ROC linearly increased with N intake, accounting for about 23% of N intake (Table 2). In addition, ROC as a fraction of GER (ROC:GER, g ROC/g GER) exponentially increased (P<0.05) with dietary CP concentration (Table 3 and Figure 3). Nevertheless, a relationship between ROC (g/BW0.75) and dietary CP could not be identified. Prediction models for relationships between fecal urea N excretion as a fraction of GER (UFE:GER, g/g GER) and dietary CP showed exponential decreases (P<0.05) with greater provision of CP (Table 3). There was an increase on the total amount of UFE with NI (g/kg0.75), corresponding to about 2.9% of increases in N intake (Table 2). Nevertheless, these models did not explain most of the variation in the amount of UFE with R 2=0.133 (Table 2). UUA as a fraction of GER (UUA:GER, g/g GER) presented an exponential relationship with the dietary CP concentration, decreasing as CP increased (P<0.05). Regarding the relationship between UUA and N intake (g/BW0.75), intercept was significant (P<0.01) and increases of N intake were linearly associated (P<0.001) with increases in UUA, showing increases that were 14.8% of the increases in N intake (Table 2). However, there was no relationship found between UUA (g/BW0.75) and dietary CP concentration.
Relationship between dietary CP concentration and the fraction of gastrointestinal entry rate of urea N (GER) that re-entered the ornithine cycle (ROC), was used for anabolism (UUA), and was excreted in the feces (UFE) in cattle. Details of the models are in Table 3, except for UUA. DM=dry matter.

Microbial use of recycled urea N
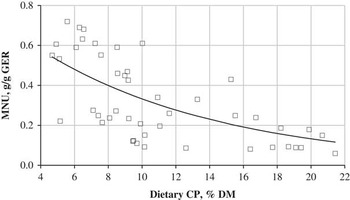
In our meta-analysis, MNU as a fraction of GER (MNU:GER, g/g GER) exponentially decreased (P<0.05) with increasing dietary CP concentrations (Figure 4) and CP:DOM (Table 3). For the relationship between MNU:GER and CP:DOM, the asymptotic confidence interval (P>0.05) was reached at 194 g CP/kg DOM (MNU:GER is 0.18). It was not found a linear (P>0.05) relationship between MNU and N intake in a BW0.75 basis, although a non-linear model was fitted for describing the pattern between these variables. From the adjusted model, MNU (g/BW0.75) exponentially increased (P<0.05) with increasing N intake (Table 3), showing a prominent decrease on the total amount of MNU above 2.4 g/BW0.75 of N intake (from evaluation of the maximum curvature).
Relationship between dietary CP concentration and the fraction of urea N recycled to the gastrointestinal tract (GER) that was incorporated into microbial N in the rumen (MNU) in cattle. Details of the model are in Table 3. DM=dry matter.

Discussion
Urea kinetics
Urea N entry rate
The linear regression between N intake and UER showed that net urea N release by the liver accounted for 71.5% of N intake in cattle. The slope estimate was close to those reported by Reynolds and Kristensen (Reference Reynolds and Kristensen2008), which was 72% for growing cattle and 60.2% for dairy cows. However, the intercept of the linear regression observed by these authors was significant, whereas in this current meta-analytical approach it was not significant. According to Harmeyer and Martens (Reference Harmeyer and Martens1980), N intake is the major factor influencing UER; they observed a correlation of 0.88 between these variables, which was similar to the current study (r=0.91). These authors found that the feeding schedule (twice daily or feeding hourly), site of N supplied to the animal (oral or abomasal), and type of N fed (non-protein N v. true protein) did not affect significantly the amount of urea synthesized in the liver. In studies on trans-hepatic veno-arterial differences across a range of BW and diet types (high forage or high concentrate), correlations between N intake and liver production of urea N varied between 0.57 (for sheep) and 0.98 (for beef and dairy cattle; Huntington and Archibeque, Reference Huntington and Archibeque1999; Lapierre and Lobley, Reference Lapierre and Lobley2001).
Under normal feeding situations, Parker et al. (Reference Parker, Lomax, Seal and Wilton1995) reported that ammonia (NH3) absorbed into the portal vein is efficiently extracted by the liver and detoxified by conversion to urea or glutamine. These authors stated that, over a wide range of portal NH3 concentrations, the liver is able to extract about 82% of portal NH3 resulting in a hepatic removal that is, on average, very slightly higher (4%) than portal absorption. In this situation, arterial NH3 concentrations are maintained constant even when portal NH3 absorption varies threefold (Parker et al., Reference Parker, Lomax, Seal and Wilton1995). This demonstrates the ability of NH3 detoxification in ruminants under feeding conditions. However, some authors have used broken-line models to describe ruminal NH3 concentration according to dietary CP (Satter and Slyter, Reference Satter and Slyter1974; Detmann et al., Reference Detmann, Paulino, Mantovani, Valadares Filho, Sampaio, Souza, Lazzarini and Detmann2009). In those approaches, there is a threshold point from which NH3 accumulation becomes more intense, which has been attributed to the saturation of microbial NH3 uptake. Considering the exponential relationship between UER and dietary CP, it is possible that the maximum curvature point (17% CP) verified in this current study is associated with the saturation of NH3 utilization in the rumen and, consequently, a more prominent release of NH3 to the liver.
Urinary urea N elimination
The UUE is one of the fates of the urea synthesized in the liver and released into blood, and factors such as N intake relative to nutritional requirements affect it (Huntington and Archibeque, Reference Huntington and Archibeque1999). According to Harmeyer and Martens (Reference Harmeyer and Martens1980), the kidney has specific mechanisms that modify urinary urea N excretion (or reabsorption). The amount of urea excreted by the kidneys may be influenced by three main factors: changes of PUN and corresponding changes in filtered urea loads, variations of the glomerular filtration rates, and modifications of tubular reabsorption of urea (Harmeyer and Martens, Reference Harmeyer and Martens1980). According to these authors, the quantity of urea reabsorbed in the tubules increases with increased PUN and that the percentages of filtered loads of urea reabsorbed remain constant. In addition, specific mechanisms of the kidneys for saving urea (e.g. glomerular filtration rate, tubular reabsorption) from being excreted with urine may be triggered when N intake is lowered further and when N supply to the animal remains inadequate for several months (Harmeyer and Martens, Reference Harmeyer and Martens1980).
The UUE:TUN may indicate the priority for excretion of excess N in relation to muscle mass, muscle growth or perhaps acid–base regulation (Huntington and Archibeque, Reference Huntington and Archibeque1999). Considering a broad range of dietary CP, UUE:TUN in ruminants increases with dietary CP concentration (Lapierre and Lobley, Reference Lapierre and Lobley2001; Marini and Van Amburgh, Reference Marini and Van Amburgh2003; Reynolds and Kristensen, Reference Reynolds and Kristensen2008; Wickersham et al., Reference Wickersham, Titgemeyer and Cochran2008). In accordance with these authors, we observed that UUE:TUN was positively associated with dietary CP and reached a plateau when dietary CP reached 15.9% of dietary DM.
The relationship of UUE:UER to dietary CP may be dependent on UER being a function of dietary CP concentration. As previously discussed, levels of CP in the diet above 17% reflect an excess of dietary N (in terms of ruminal microbial use). Close to this value, at 15.9% dietary CP, we observed UUE:UER nearly reaching its maximal ratio (from the asymptotic confidence interval). Related to dietary CP, the kidney has specific mechanisms to alter the tubular permeability and modify excretion or retention of urea (Harmeyer and Martens, Reference Harmeyer and Martens1980). Then, for cattle-fed diets >17% CP, reabsorption of urea from renal tubules may be limited, which would be reflected by a constant UUE:UER. However, as dietary CP concentration increases there is an increase in the total amounts of urea N reabsorbed and excreted, as corroborated by Harmeyer and Martens (Reference Harmeyer and Martens1980). This seems to indicate that when dietary CP is >17%, the excess of N intake decreases the efficiency of renal urea reabsorption and therefore decreases the efficiency of urea N recycling, with a resulting increase in the amount of urinary urea N excreted. These results emphasize the inherent ability of ruminants to salvage urea N for recycling and subsequent anabolic purposes when dietary protein is limited (Reynolds and Kristensen, Reference Reynolds and Kristensen2008).
Gastrointestinal entry rate of urea N
The amount of urea N transferred to the gastrointestinal tract (GIT) (g/d) is determined as the difference between UER and UUE (Lobley et al., Reference Lapierre and Lobley2001), and the fraction of UER that is recycled to GIT it is GER:UER (g GER/g UER). Accordingly, relationship between dietary CP and GER:UER was determined as unity minus the model for UUE:UER (Table 3). Thus, the relationships of UUE:UER and GER:UER with dietary CP vary in a reciprocal manner (Figure 2a and b), as highlighted by Reynolds and Kristensen (Reference Reynolds and Kristensen2008). According to the models, GER:UER was negatively associated with dietary CP concentration. Similar to the UUE:UER model, at a dietary CP concentration of 17.6% and above, the fraction of recycled urea N (GER:UER) was not different from plateau.
Urea N recycling provides a continuous source of NH3 to support microbial fermentation in the rumen as well as other regions of the GIT (Huntington and Archibeque, Reference Huntington and Archibeque1999). Ruminal NH3 concentration, DOM and PUN concentration are the principal factors affecting urea recycling from blood to the lumen of the GIT (Kennedy and Milligan, Reference Kennedy and Milligan1980). Ruminal concentrations of NH3 and OM digestion tend to be inversely related to each other, whereas GER is negatively related to ruminal NH3 concentration, and positively related to PUN concentration.
When cattle are fed with low-protein diets, urea N recycling can be considered a high-priority metabolic function, because a continuous N supply for microbial growth in the rumen is a strategy for animal survival (Egan, Reference Egan1965; Van Soest, Reference Van Soest1994). In such situation, the animal is able to decrease urinary urea N excretion (Figure 2a) and increase the fraction of urea N recycled to the rumen (Figure 2b). The low UUE:UER at low dietary CP concentrations demonstrates the remarkable ability of ruminants to conserve N through urea recycling mechanisms in the face of a severe N deficiency (Wickersham et al., Reference Wickersham, Titgemeyer, Cochran and Wickersham2009a). In addition, when N and/or energy availability is deficient, tissue protein mobilization can increase the N pool available for urea N synthesis and subsequent recycling (National Research Council (NRC), 1985; Batista et al., Reference Batista, Detmann, Titgemeyer, Valadares Filho, Valadares, Prates, Rennó and Paulino2016).
In cattle-fed diets >12% of CP, the amount of N recycled (g/d) through the rumen wall may be relatively constant (Marini and Van Amburgh, Reference Marini and Van Amburgh2003; Maltby et al., Reference Maltby, Reynolds, Lomax and Beever2005; Reynolds and Kristensen, Reference Reynolds and Kristensen2008). Nevertheless, in the current analysis, amount of urea N recycled were linearly associated with increases of N intake, with the increases in recycling accounting for about 35% of increases in N intake. This difference compared from others studies may be due to the wide range associated with a greater number of observations in our data set and/or the absent of difference between animal categories.
Urea recycling into the ruminant GIT is likely to be through facilitative urea transporters proteins (UT-A and UTB) from the mucosal to the serosal side of the ruminal epithelium (Ritzhaupt et al., Reference Ritzhaupt, Breves, Schroder, Winckler and Shirazi-Beechey1997; Stewart et al., Reference Stewart, Graham, Cattell, Smith, Simmons and Smith2005). However, it seems that expression of UT-B in ruminal epithelium is more affected by dietary carbohydrate (Simmons et al., Reference Simmons, Chaudhry, Graham, Scriven, Thistelthwaite, Smith and Stewart2009; Walpole et al., Reference Walpole, Schurmann, Górka, Penner, Loewen and Mutsvangwa2015) than dietary protein concentration (Marini and Van Amburgh, Reference Marini and Van Amburgh2003; Røjen et al., Reference Røjen and Kristensen2011). Recently, Walpole et al. (Reference Walpole, Schurmann, Górka, Penner, Loewen and Mutsvangwa2015) demonstrated that aquaporins (AQP), which are a family of membrane-spanning proteins (e.g. AQP-3, AQP-7 and AQP-10) mainly involved in the water passage are also permeable to urea, and they contribute to urea transport across the ruminal epithelium. However, it still remains to be shown how dietary CP intake modifies expression and activity of UT or AQP. Nevertheless, the existence of these epithelial transport proteins facilitating the transfer of urea N from the blood to the GIT provides some hope that we will be able to manipulate the urea N recycling by dietary management or genetic means in the near future (Calsamiglia et al., Reference Calsamiglia, Ferret, Reynolds, Kristensen and van Vuuren2010).
As highlighted by Calsamiglia et al. (Reference Calsamiglia, Ferret, Reynolds, Kristensen and van Vuuren2010), a better understanding of key processes as urea N recycling and efficiency of N capture in the rumen should allow the development of strategies to improve the efficiency of N utilization in ruminants. To take full advantage of urea N recycling it is necessary to reduce N intake at the same proportion that increased the urea N recycled to the rumen. If everything else remains unchanged, then metabolizable N flow and production performance will be maintained whereas total N intake and UUE will be reduced. Nevertheless, decreasing dietary N intake may not always result in an increase in GER (Calsamiglia et al., Reference Calsamiglia, Ferret, Reynolds, Kristensen and van Vuuren2010).
Urea N returned to ornithine cycle
The observed increases of ROC with a greater CP concentration (Figure 3) can be explained by the greater rumen NH3 concentration with increasing CP supply. According to Holder et al. (Reference Holder, Tricarico, Kim, Kristensen and Harmon2015), when rumen NH3 concentration is maintained at high concentrations, then more of the NH3 generated from urea hydrolysis would be returned to the ornithine cycle for re-synthesis of urea, resulting in greater ROC:GER. In addition, urea may be hydrolyzed by ruminal microbes at the epithelial border, and the resulting NH3 may never enter the rumen pool resulting in increased ROC (Kristensen et al., Reference Kristensen, Storm and Larsen2010).
Urea N to fecal excretion
According to Lapierre and Lobley (Reference Lapierre and Lobley2001), the loss of urea N in feces is influenced by the supply of fermentable energy to the lower GIT, suggesting that hindgut usage of urea N involves only catabolic fates, at least in terms of amino acids supply to the animal. Much of UFE would represent undigestible N present in ruminally synthesized microbial cell mass (Van Soest, Reference Van Soest1994). Thus, the decrease in UFE:GER with increasing protein in the diet (Figure 3) may be a result of lower proportion of recycled urea N being captured as bacterial N.
Urea N utilized for anabolism
Lobley et al. (Reference Lobley, Bremner and Zuur2000) defined anabolic utilization of recycled urea N as the portion of urea N recycled to the GIT that is used to support anabolism. It is calculated as GER minus ROC and UFE. From models presented in Table 3 for ROC:GER and UFE:GER, the following model can be described for UUA:GER:
 $$\eqalignno{{\rm UUA\,\colon\,GER}{\,\equals\,}1{\minus}\left[ {0.625{\times}\left( {1{\minus}e^{{\left( {{\minus}0.107{\times}{\rm CP}} \right)}} } \right)} \right] \cr {\minus}\left[ {0.098{\times}e^{{\left( {{\minus}0.037{\times}{\rm CP}} \right)}} } \right]$$
Because almost all urea N synthesized in the liver is recycled to the GIT in ruminants-fed low-protein diets (Figure 2b), UUA:GER is typically greater for low-protein diets than for high-protein diets (Reynolds and Kristensen, Reference Reynolds and Kristensen2008), as presented in the Figure 3. At least partially, the efficient reuse of N in ruminants-fed low-CP diets occurs because urea N atoms can return to the GIT more than once, which increases the overall probability of sequestration toward an anabolic fate. This multiple-recycling process can result in improvements in UUA:GER of 22% to 32% in cattle (Lapierre and Lobley, Reference Lapierre and Lobley2001).
In theory, UUA:GER would predominantly represent recycled urea N that was incorporated into microbial AA, intestinally absorbed, and used for net deposition of body protein. For this reason, UUA:GER and MNU:GER presents a similar pattern with the dietary CP concentration (Figures 3 and 4). Nevertheless, as described by Wickersham et al. (Reference Wickersham, Titgemeyer and Cochran2008), UUA includes some urea N that, subsequent to GIT entry, is excreted in the urine in forms other than urea, because the urinary excretion of label in forms other than urea is not measured by the methodology described by Lobley et al. (Reference Lapierre and Lobley2001). Indeed, several studies have reported that MNU:GER is frequently less than UUA:GER (Wickersham et al., Reference Wickersham, Titgemeyer and Cochran2008 and Reference Wickersham, Titgemeyer, Cochran, Wickersham and Gnad2009b; Davies et al., Reference Davies, McKinnon and Mutsvangwa2013; Batista et al., Reference Batista, Detmann, Titgemeyer, Valadares Filho, Valadares, Prates, Rennó and Paulino2016) demonstrating that UUA:GER is not a measure of ruminal microbial incorporation of urea N.
Microbial use of recycled urea N
Although urea N recycling can occur across the entire GIT, only urea N that is recycled into the rumen can potentially be incorporated in microbial protein and contribute amino acids to the host animal (Davies et al., Reference Davies, McKinnon and Mutsvangwa2013). In our analysis, there was a decrease on MNU:GER when increase dietary CP concentrations (Figure 4). For cattle fed with a diet of 5% CP, 53% of recycled urea N was predicted to be assimilated by ruminal microbes, whereas a diet with 15% CP was predicted to lead to only 21% of recycled urea N being incorporated into ruminal microbial N. Ruminants-fed low-protein diets incorporated more recycled N into microbial products likely because ruminal NH3 concentration was limiting and the efficiency of N utilization for microbial N synthesis is greater (Firkins et al., Reference Firkins, Yu and Morrison2007). On the other hand, as dietary CP supply increases (i.e. ruminally degradable protein), therefore, ruminal bacteria become less dependent on recycled urea N as a source of NH3 (Davies et al., Reference Davies, McKinnon and Mutsvangwa2013).
According to Brake et al. (Reference Brake, Titgemeyer, Jones and Anderson2010), efficiency of microbial capture of recycled urea N is associated with the availability of fermentable energy to the ruminal microbes, the fraction of GER recycled to the rumen, and the availability of competing N sources within the rumen. Theoretically, increases in the proportion of GER being recycled to the rumen, rather than to postruminal segments of the GIT, would increase the opportunity of ruminal microbes to assimilate recycled urea N. The fraction of recycled urea N assimilated by ruminal microbes (i.e. MNU:GER) appeared to be dependent on the ruminal NH3; when ruminal NH3 increased the efficiency of recycled N assimilation by microbes decreased (Brake et al., Reference Brake, Titgemeyer, Jones and Anderson2010). In addition, urea N can be recycled to the postruminal GIT. However, urea N recycled to the hindgut involves only catabolic fates considering MP provision to the ruminant (Lapierre and Lobley, Reference Lapierre and Lobley2001).
The models described to MNU (Table 3), could be utilized by current feeding models to calculate urea N recycled and microbial use of recycled urea N, and may improve the N utilization. The main reason is because most models acknowledged the importance of urea N recycling in the rumen, but not all accounted for it (e.g. National Research Council, 1996 and 2001), or the models utilized were generated from a limited numbers of observations (NRC, 1985). For that reason, the equations developed in this meta-analysis can be used to estimate urea kinetics and develop appropriate feeding strategies to reduce N excretion and improve N utilization.
Conclusions
Based on the present meta-analysis, the amounts of urea N synthesized in the liver and recycled to the GIT were linearly related to N intake. However, increasing dietary CP intake (dietary CP concentration and CP relative to DOM) led to decreases in the fractions of urea N recycled to the GIT and of recycled urea N incorporated into microbial N. Urea recycling to the GIT and microbial assimilation of recycled urea N in ruminants can be predicted using dietary CP content. These models could be utilized in current feeding models to improve the knowledge on N utilization, optimize urea recycling, and consequently reduce N losses that contribute to air and water pollution.
Acknowledgments
The authors thank Coordenação de Aperfeiçoamento de Pessoal de Nível Superior (CAPES, Brazil), Fundação de Apoio à Pesquisa de Minas Gerais (FAPEMIG, Brazil), Conselho Nacional de Desenvolvimento Científico e Tecnológico (CNPq, Brazil) and Instituto Nacional de Ciência e Tecnologia de Ciência Animal (INCT – Ciência Animal, Brazil) for financial support.
Supplementary material
To view supplementary material for this article, please visit https:/doi.org/10.1017/S1751731116002822