1 Introduction
Interaction of elastic structures with multiphase flows is of utmost importance in different fields of science and technology, ranging from biological applications (Freund Reference Freund2014) to energy harvesting (McKinney & DeLaurier Reference McKinney and DeLaurier1981). Materials for which the constitutive behaviour is only a function of the current state of deformation are generally known as elastic. When the work done by the stresses during the object deformation is function only of the initial and final configurations, the behaviour of the material is path independent and a stored strain energy function or elastic potential can be defined (Bonet & Wood Reference Bonet and Wood1997). These so-called hyper-elastic materials show nonlinear stress–strain curves and are generally used to describe rubber-like materials. The aim of this work is to gain fundamental understanding of the interaction between the particle-laden turbulent flow and hyper-elastic walls.
1.1 Turbulent channel flow of finite-size particles
Suspensions of solid particles are relevant in many environmental and industrial processes (Guazzelli & Morris Reference Guazzelli and Morris2011) such as sediment transport in estuaries (Mehta Reference Mehta2014), blood flow in the human body, pyroclastic flows and pulp fibres in the paper making industry (Lundell, Söderberg & Alfredsson Reference Lundell, Söderberg and Alfredsson2011).
The first simulations of finite-size particles in a turbulent channel flow were performed by Pan & Banerjee (Reference Pan and Banerjee1996). These authors revealed that turbulent fluctuations and stresses increase in the presence of the solid phase. Matas, Morris & Guazzelli (Reference Matas, Morris and Guazzelli2003), Loisel et al. (Reference Loisel, Abbas, Masbernat and Climent2013), Yu et al. (Reference Yu, Wu, Shao and Lin2013) reported a decrease of the critical Reynolds number for transition to turbulence in the semi-dilute regime with neutrally buoyant spherical particles. The simulations by Shao, Wu & Yu (Reference Shao, Wu and Yu2012) revealed a decrease of the fluid streamwise velocity fluctuations due to an attenuation of the large-scale streamwise vortices in a turbulent channel flow. Indeed, when the Reynolds number is sufficiently high, the flow becomes turbulent, with chaotic and multi-scale dynamics. In this regime, the presence of particles in the flow can alter the turbulent structures (Naso & Prosperetti Reference Naso and Prosperetti2010; Vreman Reference Vreman2015; Gualtieri, Battista & Casciola Reference Gualtieri, Battista and Casciola2017), leading to turbulence modulation at large enough volume fractions (Lucci, Ferrante & Elghobashi Reference Lucci, Ferrante and Elghobashi2010; Tanaka & Teramoto Reference Tanaka and Teramoto2015). Lashgari et al. (Reference Lashgari, Picano, Breugem and Brandt2014, Reference Lashgari, Picano, Breugem and Brandt2016) documented the existence of three different regimes when changing the volume fraction
 $\unicode[STIX]{x1D719}$
of neutrally buoyant spherical particles and the Reynolds number
 $Re$
: a laminar-like regime at low
 $Re$
and low to intermediate
 $\unicode[STIX]{x1D719}$
where the viscous stress dominates the total dissipation, a turbulent-like regime at high Reynolds number and low to intermediate
 $\unicode[STIX]{x1D719}$
where the turbulent Reynolds stress plays the main role in the momentum transfer across the channel and a third regime at higher
 $\unicode[STIX]{x1D719}$
, denoted as inertial shear thickening, characterized by a significant enhancement of the wall shear stress due to particle-induced stresses. Picano, Breugem & Brandt (Reference Picano, Breugem and Brandt2015) investigated dense suspensions in turbulent channel flow up to a volume fraction of
 $20\,\%$
. Their study revealed that the overall drag increase is due to the enhancement of the turbulence activity up to a certain volume fraction (
 $\unicode[STIX]{x1D719}\leqslant 10\,\%$
) and to significant particle-induced stresses at higher concentrations. Costa et al. (Reference Costa, Picano, Brandt and Breugem2016) explained that the turbulent drag of sphere suspensions is always higher than what predicted by only accounting for the effective suspension viscosity. They attributed this increase to the formation of a particle-wall layer, a layer of spheres forming near the wall in turbulent suspensions. Based on the thickness of the particle-wall layer, they proposed a relation able to predict the friction Reynolds number as a function of the bulk Reynolds number. Indeed, the particle-wall layer has been found to have a significant effect on the modulation of the near-wall turbulence, as confirmed in the case of non-spherical particles (Ardekani et al.
Reference Ardekani, Costa, Breugem, Picano and Brandt2017; Eshghinejadfard, Hosseini & Thévenin Reference Eshghinejadfard, Hosseini and Thévenin2017; Ardekani & Brandt Reference Ardekani and Brandt2019) where the absence of this layer leads to attenuation of the turbulence activity, resulting in drag reduction. Picano et al. (Reference Picano, Breugem and Brandt2015) attribute the formation of the near-wall layer of spherical particles to the strong wall–particle lubrication interaction that stabilizes the particle wall-normal position, forcing it to roll on the wall. As a consequence, a complex wall might change the particle dynamics in this region, affecting the formation of this layer. Motivated by this, we study here the effect of hyper-elastic walls on the formation of the particle-wall layer and on the near-wall multi-phase turbulence.
1.2 Flow over deformable compliant surfaces
Many applications involve flow over complex walls that cannot be assumed to be smooth flat surfaces. The study of the flow over these complex walls can be dated back to the pioneering work of Nikuradse (Reference Nikuradse1933, Reference Nikuradse1950), who presented a large number of experimental measurements in pipes with walls covered by sand grains. Many studies have been performed since then on the turbulent flow over rough surfaces (Antonia & Krogstad Reference Antonia and Krogstad2001; Cabal, Szumbarski & Floryan Reference Cabal, Szumbarski and Floryan2002; Belcher, Jerram & Hunt Reference Belcher, Jerram and Hunt2003; Leonardi et al. Reference Leonardi, Orlandi, Smalley, Djenidi and Antonia2003, Reference Leonardi, Orlandi, Djenidi and Antonia2004) as well as over porous walls (Beavers, Sparrow & Magnuson Reference Beavers, Sparrow and Magnuson1970; Breugem, Boersma & Uittenbogaard Reference Breugem, Boersma and Uittenbogaard2006; Tilton & Cortelezzi Reference Tilton and Cortelezzi2006; Suga et al. Reference Suga, Matsumura, Ashitaka, Tominaga and Kaneda2010; Rosti, Cortelezzi & Quadrio Reference Rosti, Cortelezzi and Quadrio2015). These have shown the destabilizing effect of the wall on the flow, the disruption of the high- and low-speed streaks close to the wall and increased wall-normal velocity fluctuations at the interface.
The two-way coupling between the flow and the dynamics of a deformable wall distinguishes these types of walls from the above-mentioned complex rigid surfaces (e.g. rough and permeable walls). This coupling allows for non-zero wall-normal velocities at the interface, due to the wall movement. The early experimental studies of Lahav, Eliezer & Silberberg (Reference Lahav, Eliezer and Silberberg1973), Krindel & Silberberg (Reference Krindel and Silberberg1979) showed a significant decrease of the critical Reynolds number for transition to turbulence of the flow in gel-coated tubes. Several studies have been then devoted to the linear stability of the fluid flow through channels and pipes with elastic and hyper-elastic walls (Kumaran Reference Kumaran1995; Srivatsan & Kumaran Reference Srivatsan and Kumaran1997; Kumaran Reference Kumaran1998a ,Reference Kumaran b ; Kumaran & Muralikrishnan Reference Kumaran and Muralikrishnan2000), reporting the possibility of the flow being unstable even in the absence of fluid inertia. These authors attribute the instabilities to the energy transfer from the mean flow to the fluctuations due to the deformation work at the interface (Shankar & Kumaran Reference Shankar and Kumaran1999).
The effect of elastic surfaces on a fully developed turbulent flow has been more seldom considered in the literature. Luo & Bewley (Reference Luo and Bewley2003, Reference Luo and Bewley2005) considered a new class of compliant surfaces, called tensegrity fabrics: a pre-tensioned network of compressive members interconnected by tensile ones. These authors reported a large drag increase and a turbulence activity enhancement, following a resonating condition between the wall deformation and the turbulent flow. Recently, Rosti & Brandt (Reference Rosti and Brandt2017) performed the first direct numerical simulations of turbulent channel flow, bounded by an incompressible hyper-elastic wall. Their study revealed that the skin friction increases monotonically with the material elastic modulus, while the turbulent flow is affected by the moving wall even at low values of elasticity. These authors show how the elasticity is the key parameter determining the turbulent flow modulation and the wall deformation.
As concerns multiphase flows, several recent studies consider a single object interacting with a soft wall (Skotheim & Mahadevan Reference Skotheim and Mahadevan2004; Salez & Mahadevan Reference Salez and Mahadevan2015; Saintyves et al. Reference Saintyves, Jules, Salez and Mahadevan2016; Rallabandi et al. Reference Rallabandi, Saintyves, Jules, Salez, Schönecker, Mahadevan and Stone2017), while there is no study in the literature on the suspensions of rigid particles in a channel flow with elastic walls. Therefore, in this study, we investigate the effect of wall elasticity on the particles dynamics and document the resulting alterations in the transport properties of the suspension.
1.3 Outline
In this work, we present the first direct numerical simulations of turbulent channel flow with hyper-elastic walls laden with finite-size rigid spherical particles. The governing equations and the flow geometry are introduced in § 2, followed by the results of the numerical simulations in section § 3. The main conclusions are finally drawn in § 4.
2 Methodology
In this work we study the turbulent flow of an incompressible viscous fluid through a channel with incompressible hyper-elastic walls, laden with non-Brownian neutrally buoyant finite-size rigid spherical particles. To this purpose, the numerical method in Sugiyama et al. (Reference Sugiyama, Ii, Takeuchi, Takagi and Matsumoto2011), Rosti & Brandt (Reference Rosti and Brandt2017) based on a fully Eulerian formulation is employed to account for the fluid–structure interaction at the interfaces ; this is combined with a direct-forcing immersed boundary method (IBM) (Uhlmann Reference Uhlmann2005; Breugem Reference Breugem2012) to model the coupling between the fluid and the particles. The IBM is complemented by lubrication, friction and collision models for short-range particle–particle interactions (Costa et al. Reference Costa, Boersma, Westerweel and Breugem2015; Ardekani et al. Reference Ardekani, Costa, Breugem and Brandt2016), while a sub-grid force (Bolotnov et al. Reference Bolotnov, Jansen, Drew, Oberai, Lahey and Podowski2011; De Vita et al. Reference De Vita, Rosti, Caserta and Brandt2019) is used to model the particle–interface interactions (interactions between the solid spheres and the elastic walls). A brief description of the numerical method is given below in § 2.1.
2.1 Governing equations & the numerical scheme
For the fluid–structure interaction at the interface, we use the so called one-continuum formulation (Tryggvason, Sussman & Hussaini Reference Tryggvason, Sussman and Hussaini2007), solving only one set of equations for the conservation of momentum and the incompressibility constraint in the fluid phase and the elastic layer,
 $$\begin{eqnarray}\displaystyle & \displaystyle \unicode[STIX]{x2202}_{t}u_{i}+\unicode[STIX]{x2202}_{j}u_{i}u_{j}=\frac{1}{\unicode[STIX]{x1D70C}}\unicode[STIX]{x2202}_{j}\unicode[STIX]{x1D70E}_{ij}, & \displaystyle\end{eqnarray}$$
 $$\begin{eqnarray}\displaystyle & \displaystyle \unicode[STIX]{x2202}_{i}u_{i}=0. & \displaystyle\end{eqnarray}$$
Here,
 $u_{i}$
is a monolithic velocity vector field, volume averaged (Quintard & Whitaker Reference Quintard and Whitaker1994) between the fluid phase and the elastic layer across the interface and
 $\unicode[STIX]{x1D70C}$
is the density, assumed to be the same in both phases. Using a volume of fluid (VoF) approach (Hirt & Nichols Reference Hirt and Nichols1981; Rosti & Brandt Reference Rosti and Brandt2017), the Cauchy stress tensor
 $\pmb{\unicode[STIX]{x1D70E}}$
can be written as
 $$\begin{eqnarray}\displaystyle \unicode[STIX]{x1D70E}_{ij}=(1-\unicode[STIX]{x1D709})\unicode[STIX]{x1D70E}_{ij}^{f}+\unicode[STIX]{x1D709}\unicode[STIX]{x1D70E}_{ij}^{e}, & & \displaystyle\end{eqnarray}$$
where the superscripts
 $^{f}$
and
 $^{e}$
denote the fluid and the elastic material, respectively;
 $\unicode[STIX]{x1D709}$
is the local solid volume fraction, changing smoothly from
 $0$
in the fluid phase to
 $1$
in the elastic layer within a few Eulerian grid cells. In particular, the isoline at
 $\unicode[STIX]{x1D709}=0.5$
represents the interface. The scalar
 $\unicode[STIX]{x1D709}$
is transported by the local velocity via an advection equation
 $$\begin{eqnarray}\displaystyle \unicode[STIX]{x2202}_{t}\unicode[STIX]{x1D709}+u_{i}\unicode[STIX]{x2202}_{i}\unicode[STIX]{x1D709}=0. & & \displaystyle\end{eqnarray}$$
The Cauchy stress tensor
 $\pmb{\unicode[STIX]{x1D70E}}$
for a Newtonian fluid and an incompressible viscous hyper-elastic material can be written, respectively, as
 $$\begin{eqnarray}\displaystyle & \displaystyle \unicode[STIX]{x1D70E}_{ij}^{f}=-p\unicode[STIX]{x1D6FF}_{ij}+\unicode[STIX]{x1D707}^{f}(\unicode[STIX]{x2202}_{j}u_{i}+\unicode[STIX]{x2202}_{i}u_{j}), & \displaystyle\end{eqnarray}$$
 $$\begin{eqnarray}\displaystyle & \displaystyle \unicode[STIX]{x1D70E}_{ij}^{e}=-p\unicode[STIX]{x1D6FF}_{ij}+\unicode[STIX]{x1D707}^{e}(\unicode[STIX]{x2202}_{j}u_{i}+\unicode[STIX]{x2202}_{i}u_{j})+GB_{ij}, & \displaystyle\end{eqnarray}$$
where
 $p$
is the pressure,
 $\unicode[STIX]{x1D6FF}_{ij}$
the Kronecker delta and
 $\unicode[STIX]{x1D707}$
the dynamic viscosity;
 $G\boldsymbol{B}$
is the hyper-elastic contribution for a neo-Hookean material, satisfying the incompressible Mooney–Rivlin law, with
 $G$
the modulus of transverse elasticity and
 $\boldsymbol{B}$
the left Cauchy–Green deformation tensor. The tensor
 $\boldsymbol{B}$
is updated by the following transport equation
 $$\begin{eqnarray}\displaystyle \unicode[STIX]{x2202}_{t}B_{ij}+u_{k}\unicode[STIX]{x2202}_{k}B_{ij}=B_{kj}\unicode[STIX]{x2202}_{k}u_{i}+B_{ik}\unicode[STIX]{x2202}_{k}u_{j}, & & \displaystyle\end{eqnarray}$$
where the right-hand side of the equation describes the stretching of the elastic material due to the straining action of the flow.
Following the formulations above and taking into account the IBM force, exerted on the fluid phase by the particles, equation (2.1) can be rewritten in its final non-dimensional form,
 $$\begin{eqnarray}\displaystyle \unicode[STIX]{x2202}_{t}u_{i}+\unicode[STIX]{x2202}_{j}u_{i}u_{j}=-\unicode[STIX]{x2202}_{i}p_{e}-\unicode[STIX]{x2202}_{i}p+\frac{(1-\unicode[STIX]{x1D709})+\unicode[STIX]{x1D709}\unicode[STIX]{x1D707}^{e/f}}{Re_{b}}\unicode[STIX]{x2202}_{j}\unicode[STIX]{x2202}_{j}u_{i}+\unicode[STIX]{x1D709}G^{\ast }\unicode[STIX]{x2202}_{j}B_{ij}+f_{i}, & & \displaystyle\end{eqnarray}$$
where
 $\unicode[STIX]{x2202}_{i}p_{e}$
is the external uniform pressure gradient that drives the flow with a constant bulk velocity
 $U_{b}$
,
 $p$
is the modified pressure (the total pressure minus
 $p_{e}$
),
 $Re_{b}$
is the bulk Reynolds number,
 $\unicode[STIX]{x1D707}^{e/f}$
denotes the dynamic viscosity ratio and
 $G^{\ast }$
is the non-dimensional elastic modulus, normalized by
 $\unicode[STIX]{x1D70C}U_{b}^{2}$
. The additional term,
 $\boldsymbol{f}$
, on the right-hand side of equation (2.8), is the IBM acceleration field, active in the immediate vicinity of a particle surface to enforce the no-slip and no-penetration boundary conditions.
The flow field is resolved numerically on a uniform (cubic), staggered, Cartesian grid while particles are represented by a set of Lagrangian points, uniformly distributed on the surface of each particle. The governing differential equations are discretized using a second-order central finite-difference scheme, except for the advection terms in equations (2.4) and (2.7) where the fifth-order weighted essentially non-oscillatory (WENO) scheme is applied (Sugiyama et al.
Reference Sugiyama, Ii, Takeuchi, Takagi and Matsumoto2011; Rosti & Brandt Reference Rosti and Brandt2017; Izbassarov et al.
Reference Izbassarov, Rosti, Ardekani, Sarabian, Hormozi, Brandt and Tammisola2018). An explicit third-order Runge–Kutta scheme (Breugem Reference Breugem2012) is used for the time integration of all terms in equations (2.4), (2.7) and (2.8) without considering the IBM acceleration field
 $\boldsymbol{f}$
, except for the solid hyper-elastic contribution, which is advanced in time with the Crank–Nicolson method (Min, Yoo & Choi Reference Min, Yoo and Choi2001). The first prediction velocity obtained after the time integration step is then used to compute the point forces
 $\boldsymbol{F}_{l}$
(normalized by
 $\unicode[STIX]{x1D70C}\unicode[STIX]{x0394}V_{l}$
, with
 $\unicode[STIX]{x0394}V_{l}$
being the volume of each Lagrangian grid point, equal to the volume of an Eulerian grid cell) at each Lagrangian point on the surface of the particles, based on the difference between the particle surface velocity and the interpolated first prediction velocity at that point. The singular forces
 $\boldsymbol{F}_{l}$
are then spread into the IBM acceleration field
 $\boldsymbol{f}$
using the regularized Dirac delta function
 $\unicode[STIX]{x1D6FF}_{d}$
of Roma, Peskin & Berger (Reference Roma, Peskin and Berger1999);
 $\boldsymbol{f}$
is then added to the first prediction velocity followed by the pressure-correction scheme used in Breugem (Reference Breugem2012) to project the velocity field in the divergence-free space. More details and validations of the numerical scheme can be found in Breugem (Reference Breugem2012), Ardekani et al. (Reference Ardekani, Costa, Breugem and Brandt2016), Rosti & Brandt (Reference Rosti and Brandt2017), Izbassarov et al. (Reference Izbassarov, Rosti, Ardekani, Sarabian, Hormozi, Brandt and Tammisola2018), Rosti, Brandt & Mitra (Reference Rosti, Brandt and Mitra2018a
).
Taking into account the inertia of the fictitious fluid phase trapped inside the particle volumes, the motion of the rigid particles is described by the Newton–Euler Lagrangian equations,
 $$\begin{eqnarray}\displaystyle & \displaystyle \unicode[STIX]{x1D70C}_{p}V_{p}\frac{\text{d}\boldsymbol{u}_{p}}{\text{d}t}=-\unicode[STIX]{x1D70C}\mathop{\sum }_{l=1}^{N_{L}}\boldsymbol{F}_{l}\unicode[STIX]{x0394}V_{l}+\unicode[STIX]{x1D70C}\frac{\text{d}}{\text{d}t}\left(\int _{V_{p}}\boldsymbol{u}\,\text{d}V\right)+(\unicode[STIX]{x1D70C}_{p}-\unicode[STIX]{x1D70C})V_{p}\boldsymbol{g}+\boldsymbol{F}_{c}, & \displaystyle\end{eqnarray}$$
 $$\begin{eqnarray}\displaystyle & \displaystyle \boldsymbol{I}_{p}\frac{\text{d}\pmb{\unicode[STIX]{x1D6FA}}_{p}}{\text{d}t}=-\unicode[STIX]{x1D70C}\mathop{\sum }_{l=1}^{N_{L}}\boldsymbol{r}_{l}\times \boldsymbol{F}_{l}\unicode[STIX]{x0394}V_{l}+\unicode[STIX]{x1D70C}\frac{\text{d}}{\text{d}t}\left(\int _{V_{p}}\boldsymbol{r}\times \boldsymbol{u}\,\text{d}V\right)+\boldsymbol{T}_{c}, & \displaystyle\end{eqnarray}$$
with
 $\boldsymbol{u}_{p}$
and
 $\pmb{\unicode[STIX]{x1D6FA}}_{p}$
being the translational and the angular velocity of the particle;
 $\unicode[STIX]{x1D70C}_{p}$
,
 $V_{p}$
and
 $\boldsymbol{I}_{p}$
are the particle mass density, volume and moment-of-inertia tensor; and
 $\boldsymbol{g}$
the gravity vector. The first term on the right-hand side of the equations above describes the IBM force and torque as the summation of all the point forces
 $\boldsymbol{F}_{l}$
on the surface of the particle, the second term accounts for the inertia of the fictitious fluid phase trapped inside the particle and
 $\boldsymbol{F}_{c}$
and
 $\boldsymbol{T}_{c}$
are the force and the torque due to the particle–particle interactions.
When the distance between the particles is smaller than one Eulerian grid cell, the lubrication force is under-predicted by the IBM. To compensate for this inaccuracy and to avoid computationally expensive grid refinements, a lubrication correction model based on the asymptotic analytical expression for the normal lubrication force between spheres (Jeffrey Reference Jeffrey1982) is used. A soft-sphere collision model with Coulomb friction takes over the interaction when the particles touch. The restitution coefficients used for normal and tangential collisions are
 $0.97$
and
 $0.1$
, with the Coulomb friction coefficient set to
 $0.15$
. More details about these models can be found in Costa et al. (Reference Costa, Boersma, Westerweel and Breugem2015), Ardekani et al. (Reference Ardekani, Costa, Breugem and Brandt2016).
A sub-grid repulsive lubrication-like force
 $\boldsymbol{F}_{r}$
(Clift, Grace & Weber Reference Clift, Grace and Weber2005; Bolotnov et al.
Reference Bolotnov, Jansen, Drew, Oberai, Lahey and Podowski2011; De Vita et al.
Reference De Vita, Rosti, Caserta and Brandt2019) is employed to model the particle–interface interactions when the distance between a particle and the interface is less than
 $1.5$
Eulerian grids. This sub-grid repulsive force is written as
 $$\begin{eqnarray}\displaystyle \boldsymbol{F}_{r}=\frac{1}{2}\unicode[STIX]{x1D707}^{f}U_{b}D_{p}\left(\frac{a_{1}}{d_{w}}+\frac{a_{2}}{d_{w}^{2}}\right)\boldsymbol{n}_{w}, & & \displaystyle\end{eqnarray}$$
with
 $a_{1}$
and
 $a_{2}$
being two coefficients, set to
 $550$
and
 $55$
in this study,
 $\boldsymbol{n}_{w}$
is the unit vector normal to the wall and
 $d_{w}$
is the distance from the interface;
 $\unicode[STIX]{x1D707}^{f}$
is the fluid viscosity in this formulation (De Vita et al.
Reference De Vita, Rosti, Caserta and Brandt2019).
2.2 Flow geometry
We perform direct numerical simulations of pressure-driven, particulate turbulent channel flow, bounded by two incompressible hyper-elastic walls at
 $y=0$
and
 $y=2h$
, with
 $h$
being half of the distance between the two interfaces. A computational domain of size
 $L_{x}=6h$
,
 $L_{y}=2(h+h_{e})$
and
 $L_{z}=3h$
is considered in the streamwise, wall-normal and spanwise directions, where
 $h_{e}=0.25h$
is the height of the elastic walls in the flat unstressed condition. Two impermeable walls are located at
 $y=-h_{e}$
and
 $y=2h+h_{e}$
with no-slip and no-penetration (n.s./n.p.) boundary conditions, while the flow is considered periodic in the two wall-parallel directions. The bulk velocity
 $U_{b}$
is fixed to guarantee a constant bulk Reynolds number
 $Re_{b}\equiv 2hU_{b}/\unicode[STIX]{x1D708}_{f}=5600$
. This corresponds to an average friction Reynolds number of
 $Re_{\unicode[STIX]{x1D70F}}\equiv u_{\unicode[STIX]{x1D70F}}h/\unicode[STIX]{x1D708}_{f}\approx 180$
in the case of unladen flow over flat rigid walls (Kim, Moin & Moser Reference Kim, Moin and Moser1987) with
 $\unicode[STIX]{x1D708}_{f}$
and
 $u_{\unicode[STIX]{x1D70F}}$
being the fluid kinematic viscosity and the friction velocity, respectively. The same viscosity is considered in this study for the elastic layer and the fluid phase (
 $\unicode[STIX]{x1D708}^{f}=\unicode[STIX]{x1D708}^{e}$
), as it was shown before that the elasticity modulus
 $G$
is the key parameter affecting the interface and the flow dynamics (Rosti & Brandt Reference Rosti and Brandt2017).
Four different moduli of transverse elasticity
 $G$
are studied here, ranging from an almost rigid interface,
 $G^{\ast }=2$
, to a highly elastic case of
 $G^{\ast }=0.25$
. Particulate cases are simulated at each
 $G^{\ast }$
with a particle volume fraction
 $\unicode[STIX]{x1D719}=10\,\%$
and the results are compared to the unladen flow with the same wall elasticity. We consider non-Brownian neutrally buoyant rigid spherical particles with diameter
 $D_{p}=h/9$
. This corresponds to
 $5000$
particles inside the computational domain at
 $\unicode[STIX]{x1D719}=10\,\%$
, see Picano et al. (Reference Picano, Breugem and Brandt2015). The effect of volume fraction is further studied at a moderate wall elasticity of
 $G^{\ast }=0.5$
, by decreasing and increasing the particle volume fraction to
 $\unicode[STIX]{x1D719}=5\,\%$
and
 $20\,\%$
.
Two additional numerical experiments are performed to gain a better understanding of the flow: (i) a simulation, denoted
 $G1_{FW}$
(fixed wall), where an instantaneous configuration of the deformed interface, extracted from the case with the highest wall elasticity, is frozen so as to distinguish the effect on the near-wall turbulence of wall elasticity from the modulation caused by random roughness and (ii) case
 $G4_{NPWL}$
(no particle-wall layer), where particles are forced to bounce back towards the core region of the channel before approaching the deformable walls; this is achieved by numerical collisions with the two virtual walls located at a distance of
 $h/10$
from the two undeformed interfaces. A summary to the simulated cases is given in table 1.
Summary of the simulations performed in this study, all for a bulk Reynolds number
 $Re_{b}=5600$
. Here,
 $h_{e}$
is the height of the elastic walls in the flat unstressed condition,
 $G^{\ast }$
is the non-dimesionalized modulus of transverse elasticity,
 $\unicode[STIX]{x1D719}$
denotes the particle volume fraction and
 $N_{p}$
the number of the particles inside the domain with diameter
 $D_{p}=h/9$
. All simulations are performed on a computational domain of size
 $6h\times 2(h+h_{e})\times 3h$
in the streamwise, wall-normal and spanwise directions, discretized with
 $1296\times 540\times 648$
grid cells.
 $Re_{\unicode[STIX]{x1D70F}}$
is the resulting mean friction Reynolds number, reported here for all the simulated cases.

The simulations are performed on a uniform Cartesian grid of size
 $1296\times 540\times 648$
, corresponding to a resolution of
 $24$
grid points per particle diameter
 $D_{p}$
in the particulate cases. The number of Lagrangian points
 $N_{L}$
on the surface of each particle is set to
 $N_{L}=1721$
. All cases are started from a fully developed turbulent channel flow in the fluid region (
 $y=0$
to
 $2h$
) with a perfectly flat interface (initially) and a random distribution of the particles. The statistics are collected for approximately
 $600h/U_{b}$
after the flow has reached a statistical steady state. The pressure gradient, required to maintain the constant bulk velocity
 $U_{b}$
, is monitored in time and used as a criterion for deciding a statistically steady state condition. A Courant–Friedrichs–Lewy number of
 $0.2$
is used to guarantee the numerical stability of the method. It should be noted here that the simulations with the most elastic walls (
 $G^{\ast }=0.25$
) are slightly under-resolved due to the considerably smaller viscous length scale for these cases, however the results are reported here to show the trend against the wall elasticity.
Instantaneous snapshots of the streamwise velocity
 $u$
on
 $x$
–
 $y$
and
 $y$
–
 $z$
planes for (a)
 $G^{\ast }=0.25$
(case
 $G1$
), (b)
 $G^{\ast }=0.25$
at
 $\unicode[STIX]{x1D719}=10\,\%$
(case
 $G1_{10\,\%}$
), (c)
 $G^{\ast }=1$
(case
 $G3$
) and (d)
 $G^{\ast }=1$
at
 $\unicode[STIX]{x1D719}=10\,\%$
(case
 $G3_{10\,\%}$
). For clarity, only the particles cutting the selected
 $x$
–
 $y$
plane are displayed. The colour scale for the streamwise velocity ranges from
 $0$
(dark green) to
 $1.5u/U_{b}$
(white). The elastic walls are represented by the isosurfaces of
 $\unicode[STIX]{x1D709}=0.5$
, coloured by the wall-normal distance, ranging from
 $-0.15h$
(white) to
 $0.15h$
(black).

3 Results
3.1 Drag & deformation
VoF function
 $\unicode[STIX]{x1D709}$
versus the normalized distance from the interface
 $y/h$
, showing the wall deformation for the different cases under investigation: (a) mean values and (b) root-mean-square (r.m.s.) of the fluctuations in
 $\unicode[STIX]{x1D709}$
. The blue, red, green and magenta solid lines are used for the cases
 $G1$
to
 $G4$
, respectively, while the particulate cases
 $G1_{10\,\%}$
to
 $G4_{10\,\%}$
are indicated with dashed lines of the same colour. The insets in (a) show the maximum and minimum position of the interface for different wall elasticities.

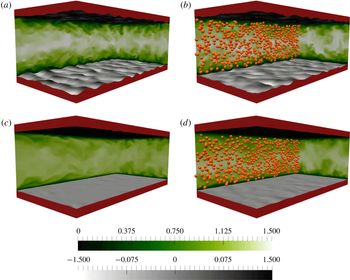
We first display snapshots of the flow and particles in figure 1, where the instantaneous streamwise velocity
 $u$
is depicted on
 $x$
–
 $y$
and
 $y$
–
 $z$
planes for the cases with
 $G^{\ast }=0.25$
and
 $1$
at
 $\unicode[STIX]{x1D719}=0$
and
 $10\,\%$
. For clarity, just a fraction of the particles (those cutting the visualized
 $x$
–
 $y$
plane) are displayed. Comparing with respect to the single-phase flow at the same wall elasticity (figure 1
a), particles are observed to decrease the wall deformation and turbulence activity in
 $G1_{10\,\%}$
(figure 1
b). However, the opposite effect is observed in
 $G3_{10\,\%}$
(figure 1
c,d), where the wall deformation is slightly increased in the presence of the particles. Also interesting to note is the spanwise coherency of the wall deformation in figure 1(a), which is broken into a less correlated pattern in the particulate case
 $G1_{10\,\%}$
(see figure 7 for a quantitative comparison).
To provide a quantitative measure of the wall deformation, the mean (
 $\overline{\unicode[STIX]{x1D709}}$
) and root-mean-square (
 $\unicode[STIX]{x1D709}^{\prime }$
) profiles of the VoF function
 $\unicode[STIX]{x1D709}$
representing the elastic walls are depicted in figure 2 versus the normalized distance from the interface
 $y/h$
. The maximum and minimum of the interface position, corresponding to the highest crests and the lowest troughs of the wavy interface, defined by the locations where
 $\overline{\unicode[STIX]{x1D709}}$
attains the values
 $0.999$
and
 $0.001$
, are reported in the insets of figure 2(a) for the different wall elasticities considered.
The results show an expected decrease of wall deformation with increasing
 $G^{\ast }$
for both single-phase and particulate cases. However, the effect of the particles on the wall deformation is non-monotonic: we find a slight decrease with respect to the single-phase flow in the cases with highly elastic walls (
 $G1_{10\,\%}$
and
 $G2_{10\,\%}$
), and a larger interface deformation for the cases with less wall elasticity in the presence of particles (
 $G3_{10\,\%}$
and
 $G4_{10\,\%}$
). Although the particles do not significantly change the maximum amplitude of the deformation, the approach of
 $\overline{\unicode[STIX]{x1D709}}$
to zero and one (insets of figure 2
a) is considerably modified: the data reveal the less frequent occurrence of large deformations in the particulate case at low
 $G^{\ast }$
and the opposite behaviour at high
 $G^{\ast }$
. The profiles of
 $\unicode[STIX]{x1D709}^{\prime }$
, depicted in figure 2(b), The peak value at
 $y=0$
indicates the degree of waviness at the interface. Given that
 $\overline{\unicode[STIX]{x1D709}}=0.5$
at the
 $y=0$
plane, the peak of
 $\unicode[STIX]{x1D709}^{\prime }$
is bounded between
 $\unicode[STIX]{x1D709}^{\prime }=0.5$
, where all the grid points in the
 $y=0$
plane are located inside the fluid region or in the elastic layer, and
 $\unicode[STIX]{x1D709}^{\prime }=0$
, where the interface is undeformed everywhere. The results show a decrease of the interface waviness by the presence of the particles in highly elastic walls, while the opposite is evident in the less deformable cases. This behaviour is attributed to the particle migration towards the centre of the channels with highly elastic walls and its resulting turbulence attenuation (see the next sections for the details).
(a) Mean velocity profiles, normalized by the bulk velocity
 $U_{b}$
. The colour scheme is the same as figure 2 with two extra black lines, pertaining to the results for rigid walls (Ardekani et al.
Reference Ardekani, Costa, Breugem, Picano and Brandt2017): a solid line for single-phase flow and a dashed line for particulate flow at
 $\unicode[STIX]{x1D719}=10\,\%$
. The inset displays the increase of the mean velocity in the core of the channel. (b) The friction Reynolds number
 $Re_{\unicode[STIX]{x1D70F}}$
versus the modulus of transverse elasticity
 $G^{\ast }$
. The black and red dashed horizontal lines in (b) represent
 $Re_{\unicode[STIX]{x1D70F}}$
for the single-phase and the particulate flow over smooth rigid walls.

The mean velocity profiles, obtained by averaging in the fluid phase, are presented in figure 3(a), together with two extra lines, pertaining to the results for rigid walls (Ardekani et al.
Reference Ardekani, Costa, Breugem, Picano and Brandt2017). Note that the mean velocity inside the elastic walls is equal to zero. The results show that the mean velocity increases with the wall elasticity at the channel centreline for both particulate and single-phase cases, whereas it decreases close to the interface. Similarly to the flow over rigid walls (Picano et al.
Reference Picano, Breugem and Brandt2015; Ardekani et al.
Reference Ardekani, Costa, Breugem, Picano and Brandt2017), particles are observed to increase the core velocity, except for the cases with highly elastic walls (
 $G1_{10\,\%}$
and
 $G2_{10\,\%}$
), where the core velocity is reduced in their presence. We note here that unlike the single-phase flows over rigid walls, the mean velocity reduction close to the interface should not be interpreted as a sign of drag reduction. In fact, the friction Reynolds number
 $Re_{\unicode[STIX]{x1D70F}}$
, depicted in figure 3(b), indicates a significant drag increase with growing wall elasticity. Note that,
 $Re_{\unicode[STIX]{x1D70F}}$
is calculated using the mean pressure gradient needed to keep
 $U_{b}$
constant. Therefore, we find drag reduction with respect to the single-phase flow for same wall elasticity only for the particulate cases with highly elastic walls. Results concerning the case
 $G4_{NPWL}$
with artificially removed particle-wall layer and the cases with different volume fractions,
 $G2_{5\,\%}$
and
 $G2_{20\,\%}$
, will be discussed in § 3.3 and § 3.4. A comparison is made in appendix A between the results, pertaining to the single-phase flow and the case
 $G1_{FW}$
to distinguish the main effects of wall elasticity on the near-wall turbulence from the modulation caused by the roughness.
To better understand the overall drag, we perform a momentum budget analysis. In particulate turbulent flows with rigid walls, the particle-induced stress contributes to the mean momentum transfer, in addition to the viscous and Reynolds shear stresses. Here, we extend the formulation proposed by Zhang & Prosperetti (Reference Zhang and Prosperetti2010), Picano et al. (Reference Picano, Breugem and Brandt2015) for the momentum balance in particulate flows, by taking the hyper-elastic contribution into account (Rosti & Brandt Reference Rosti and Brandt2018). The mean momentum balance in the channel then reads
 $$\begin{eqnarray}\displaystyle \unicode[STIX]{x1D70C}u_{\unicode[STIX]{x1D70F}}^{2}\left(1-\frac{y}{h}\right)=\unicode[STIX]{x1D707}(1-\unicode[STIX]{x1D6F7})\frac{\text{d}U}{\text{d}y}-\unicode[STIX]{x1D70C}[\unicode[STIX]{x1D6F7}\langle u_{p}^{\prime }v_{p}^{\prime }\rangle +(1-\unicode[STIX]{x1D6F7})\langle u^{\prime }v^{\prime }\rangle ]+\langle \unicode[STIX]{x1D709}GB_{xy}\rangle +\unicode[STIX]{x1D6F7}\langle \unicode[STIX]{x1D70E}_{xy}^{p}\rangle ,\qquad & & \displaystyle\end{eqnarray}$$
where the first term on the right-hand side is the viscous shear stress, denoted
 $\unicode[STIX]{x1D70F}_{V}$
, the second and the third terms indicate the turbulent Reynolds shear stress of the combined phases,
 $\unicode[STIX]{x1D70F}_{T}$
, the fourth term is the contribution of the hyper-elastic wall,
 $\unicode[STIX]{x1D70F}_{E}$
and the fifth term is the particle-induced stress
 $\unicode[STIX]{x1D70F}_{P}$
;
 $\unicode[STIX]{x1D70E}_{xy}^{p}$
in the equation above indicates the stress in the particle phase, normal to the streamwise plane and pointing in the wall-normal direction,
 $\unicode[STIX]{x1D6F7}$
is the mean local particle volume fraction as a function of the wall-normal distance and
 $u^{\prime }$
and
 $v^{\prime }$
are the velocity fluctuations in the streamwise and wall-normal directions with the subscript
 $_{p}$
denoting the particle phase. Here,
 $\unicode[STIX]{x1D70C}$
and
 $\unicode[STIX]{x1D707}$
are the density and viscosity, assumed equal in the fluid and the elastic layer. Note that in the absence of particles (
 $\unicode[STIX]{x1D6F7}=0$
) and the elastic layer (
 $\unicode[STIX]{x1D709}=0$
), this equation reduces to the classic momentum balance for single-phase turbulent channel flow (Pope Reference Pope2000).
The wall-normal profiles of each term in the momentum transfer, normalized by
 $\unicode[STIX]{x1D70C}u_{\unicode[STIX]{x1D70F}}^{2}$
, are displayed in figure 4(a–d) for the cases
 $G1$
,
 $G1_{10\,\%}$
,
 $G4$
and
 $G4_{10\,\%}$
. Note that the particle stress
 $\unicode[STIX]{x1D70F}_{P}$
is computed by subtracting the three other stresses from the total stress. Close to the interface, the contribution from the viscous stress
 $\unicode[STIX]{x1D70F}_{V}$
is reduced significantly with increasing wall elasticity, as the mean velocity is shown to decrease in this region (figure 3
a). The hyper-elastic stress,
 $\unicode[STIX]{x1D70F}_{E}$
, instead, takes over the momentum transfer, growing linearly within the elastic layer, where all other terms in equation (3.1) tend to zero. Note that, this line can be extrapolated to calculate the exact wall drag at
 $y=0$
, obtaining a drag which is consistent with the ones reported above based on the mean pressure gradient. Far from the interface region, the Reynolds stress,
 $\unicode[STIX]{x1D70F}_{T}$
, plays the main role in momentum transfer. The relative importance of the particle stress
 $\unicode[STIX]{x1D70F}_{P}$
is observed to increase with the wall elasticity, while the peak close to the interface disappears.
Momentum budget, normalized with
 $\unicode[STIX]{x1D70C}u_{\unicode[STIX]{x1D70F}}^{2}$
, for (a)
 $G1$
, (b)
 $G1_{10\,\%}$
, (c)
 $G4$
and (d)
 $G4_{10\,\%}$
. Here,
 $\unicode[STIX]{x1D70F}$
is the total stress,
 $\unicode[STIX]{x1D70F}_{V}$
the viscous shear stress,
 $\unicode[STIX]{x1D70F}_{T}$
the turbulent Reynolds shear stress of the combined phases,
 $\unicode[STIX]{x1D70F}_{E}$
the hyper-elastic contribution and
 $\unicode[STIX]{x1D70F}_{P}$
the particle induced stress. Panels (e) and (f) show the total contribution of each stress to the drag, normalized by the wall shear stress of the single-phase flow with rigid walls,
 $\unicode[STIX]{x1D70F}_{RW}$
(the dashed line in the figure).
 $RW$
and
 $RW_{10\,\%}$
are the cases with rigid walls taken by Ardekani et al. (Reference Ardekani, Costa, Breugem, Picano and Brandt2017).

Integrating equation (3.1) from
 $0$
to
 $h$
leads to the contribution of each stress to the total
 $\unicode[STIX]{x1D70F}_{w}$
, which can be written as
 $$\begin{eqnarray}\displaystyle \unicode[STIX]{x1D70F}_{w}=\frac{2}{h}[\unicode[STIX]{x1D6F4}\unicode[STIX]{x1D70F}_{V}+\unicode[STIX]{x1D6F4}\unicode[STIX]{x1D70F}_{T}+\unicode[STIX]{x1D6F4}\unicode[STIX]{x1D70F}_{E}+\unicode[STIX]{x1D6F4}\unicode[STIX]{x1D70F}_{P}]. & & \displaystyle\end{eqnarray}$$
Each contribution, multiplied by
 $2/h$
and normalized with the wall shear stress of the single-phase flow over rigid walls (
 $\unicode[STIX]{x1D70F}_{RW}$
), is reported in figure 4(e,f) for the single-phase and the particulate cases with different wall elasticities;
 $RW$
and
 $RW_{10\,\%}$
are obtained from the simulations with rigid walls presented in Ardekani et al. (Reference Ardekani, Costa, Breugem, Picano and Brandt2017). Overall, we observe that the increase in drag with wall deformability can be attributed to an increase of the turbulence activity, as also discussed in Rosti & Brandt (Reference Rosti and Brandt2017). In other words, the turbulence activity increases with respect to the reference
 $RW$
for all cases. The contribution of the viscous shear stress to the total drag is in general reduced with increasing wall elasticity, whereas the particle stress
 $\unicode[STIX]{x1D6F4}\unicode[STIX]{x1D70F}_{P}$
monotonically increases with decreasing
 $G^{\ast }$
. This can be explained by the rigid particles opposing any deformation, while experiencing stronger forces on their surfaces due to the growing turbulence activity with decreasing
 $G^{\ast }$
. We also note a non-monotonic variation of
 $\unicode[STIX]{x1D6F4}\unicode[STIX]{x1D70F}_{T}$
and
 $\unicode[STIX]{x1D6F4}\unicode[STIX]{x1D70F}_{E}$
in the particle-laden cases when comparing the results with the single-phase flows of the same wall elasticity: turbulence attenuation for highly elastic walls, while increasing the turbulence activity in the cases of less deformable walls.
3.2 Turbulence modulation
Root-mean-square velocity fluctuations and Reynolds shear stress: (a) streamwise
 $\langle |u^{\prime }|\rangle$
; (b) wall normal
 $\langle |v^{\prime }|\rangle$
; (c) spanwise
 $\langle |w^{\prime }|\rangle$
and (d) Reynolds shear stress. Panels (e) and (f) show
 $\langle |u^{\prime }|\rangle$
and
 $\langle |v^{\prime }|\rangle$
, scaled in internal units. The colour scheme is the same as in figures 2 and 3(a).

In this section we take a closer look at the turbulence modulation caused by the simultaneous presence of the particles and deformable walls. We first examine the root-mean-square velocity fluctuations and the Reynolds shear stress profiles, depicted in figure 5. The velocity fluctuations are strongly affected by the elastic layer, lingering inside as the wall elasticity increases. The wall-normal velocity fluctuation
 $v^{\prime }$
is the most affected by the wall elasticity, owing to the weakening of the wall blocking and wall-induced viscous effects (Perot & Moin Reference Perot and Moin1995a
,Reference Perot and Moin
b
). The same effect is also observed in turbulent boundary-layer flows over rough (Krogstadt & Antonia Reference Krogstadt and Antonia1999) and porous walls (Rosti, Brandt & Pinelli Reference Rosti, Brandt and Pinelli2018b
). In addition, we note that
 $\langle |v^{\prime }|\rangle$
attains a secondary peak in the vicinity of the interface, associated with the oscillatory interface motion. As the wall elasticity increases, this secondary peak moves farther from the interface, becomes stronger than the classical turbulent peak and the fluctuations are larger at the interface. In addition, we note that the peak of the streamwise velocity fluctuations,
 $u^{\prime }$
, increases with increasing wall elasticity considerably less than in the other two directions, which we attribute to the quenching of the near-wall streaky structures close to the deformable interface (Breugem et al.
Reference Breugem, Boersma and Uittenbogaard2006; Rosti & Brandt Reference Rosti and Brandt2017; Rosti et al.
Reference Rosti, Brandt and Pinelli2018b
). This behaviour is particularly evident in figure 5(e,f), where the profiles of
 $\langle |u^{\prime }|\rangle$
and
 $\langle |v^{\prime }|\rangle$
are depicted in internal units.
The magnitude of the velocity fluctuations increases in the presence of particles for low wall deformabilities while it decreases for high elasticity, except for the peaks of
 $\langle |u^{\prime }|\rangle$
which are always reduced with respect to their single-phase counterparts. Despite the strong velocity fluctuations also inside the highly elastic walls, the Reynolds shear stress (see figure 5
d) is zero within these layers, indicating a decorrelation of
 $u^{\prime }$
and
 $v^{\prime }$
. The Reynolds shear stress increases in the particulate cases, except in the presence of highly elastic walls, as observed for the r.m.s. velocities, where a significant attenuation is instead observed (also shown in figure 4
f).
Instantaneous contours of the streamwise velocity fluctuations
 $u^{\prime }$
in the wall-parallel plane
 $x-z$
at
 $y/h=0.1$
. The colour scale goes from
 $-0.5U_{b}$
(blue) to
 $0.5U_{b}$
(yellow). (a,c,e,g) indicates the single-phase flow cases (
 $G1$
to
 $G4$
) and (b,d,f,h), the particulate ones (
 $G1_{10\,\%}$
to
 $G4_{10\,\%}$
), with
 $G^{\ast }$
increasing from (a–h).

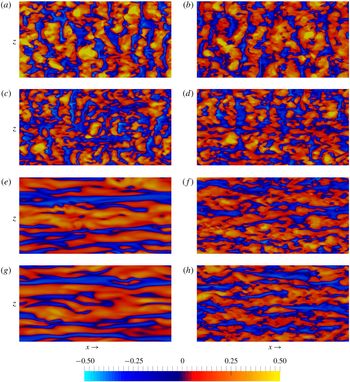
Next, we take a closer look at the turbulent flow near the deformable walls, see figure 6 where we report instantaneous snapshots of the streamwise velocity fluctuations,
 $u^{\prime }$
, in the wall-parallel plane at
 $y/h=0.1$
. The so-called high- and low-speed streaks, characteristic of wall-bounded turbulence, can be directly recognized near the less elastic walls. As the wall elasticity increases (from bottom to top), these streamwise streaky structures appear as less elongated and more fragmented, broken into smaller pieces by the interface motion. Further increasing the wall elasticity results in the formation of relatively large structures, now correlated in the spanwise direction (a), similar to those observed by Rosti & Brandt (Reference Rosti and Brandt2017). These spanwise structures have been observed before in the turbulent flow over porous walls (Breugem et al.
Reference Breugem, Boersma and Uittenbogaard2006; Rosti et al.
Reference Rosti, Cortelezzi and Quadrio2015, Reference Rosti, Brandt and Pinelli2018b
), rough surfaces (Raupach, Antonia & Rajagopalan Reference Raupach, Antonia and Rajagopalan1991; Jiménez et al.
Reference Jiménez, Uhlmann, Pinelli and Kawahara2001) and plant canopies (Finnigan Reference Finnigan2000). Breugem et al. (Reference Breugem, Boersma and Uittenbogaard2006) relates these elongated structures to a Kelvin–Helmholtz-type instability that is triggered by the inflection point of the mean velocity profiles (Rayleigh’s criterion, see Drazin & Reid Reference Drazin and Reid2004), creating spanwise vortices or rollers. Snapshots of
 $u^{\prime }$
in the flow laden with particles are shown in figure 6(b,d,f,h). Particles can be observed to break both the streamwise and the spanwise structures into less elongated and more fragmented patches.
Line and colour contours of the one-dimensional autocorrelation of (a) the streamwise velocity fluctuations as a function of the spanwise spacing (
 $R_{uu}^{z}(y,\unicode[STIX]{x0394}z)$
) and (b) the wall-normal velocity fluctuations as a function of the streamwise spacing for different
 $y/h$
(
 $R_{vv}^{x}(y,\unicode[STIX]{x0394}x)$
). The solid lines correspond to positive values, ranging from
 $0$
to
 $0.8$
with a step of
 $0.2$
between two neighbouring lines, whereas dashed and dotted lines indicate the isolines at
 $-0.1$
and
 $-0.2$
, respectively. Results, pertaining to the single-phase flow (cases
 $G1$
to
 $G4$
), are shown in the first row of each panel, while the autocorrelations for the particulate cases (cases
 $G1_{10\,\%}$
to
 $G4_{10\,\%}$
) are depicted in the second row.
 $G^{\ast }$
increases from left to right. Internal units are indicated on the top and on the right side of each panel.

To gain a better understanding of the turbulence structures and in order to quantify the observations in figure 6, we compute the two-point spatial correlation of the streamwise and the wall-normal velocity fluctuations as a function of the spanwise and streamwise spacing, respectively as
 $$\begin{eqnarray}\displaystyle & \displaystyle R_{uu}^{z}(y,\unicode[STIX]{x0394}z)=\frac{\langle u^{\prime }(x,y,z,t)u^{\prime }(x,y,z+\unicode[STIX]{x0394}z,t)\rangle }{{u^{\prime }}^{2}}, & \displaystyle\end{eqnarray}$$
 $$\begin{eqnarray}\displaystyle & \displaystyle R_{vv}^{x}(y,\unicode[STIX]{x0394}x)=\frac{\langle v^{\prime }(x,y,z,t)v^{\prime }(x+\unicode[STIX]{x0394}x,y,z,t)\rangle }{{v^{\prime }}^{2}}. & \displaystyle\end{eqnarray}$$
Line and colour contours of
 $R_{uu}^{z}(y,\unicode[STIX]{x0394}z)$
and
 $R_{vv}^{x}(y,\unicode[STIX]{x0394}x)$
are presented in figure 7(a,b) for the different cases under investigation. It is known that in a single-phase turbulent flow the spanwise correlation of the streamwise velocity fluctuations exhibits a negative local minimum in the near-wall region at around
 $\unicode[STIX]{x0394}z^{+}\approx 50{-}60$
(Pope Reference Pope2000), which indicates half of the spacing between two neighbouring streaks. A similar spacing is obtained in figure 7(a) for the cases with less elastic walls
 $G3$
and
 $G4$
(top right), as these display a local minimum at
 $\unicode[STIX]{x0394}Z^{+}\approx 55$
and
 $\unicode[STIX]{x0394}Z^{+}\approx 58$
, respectively. The figure shows clearly the disruption of the high- and low-speed streaks, when increasing the wall elasticity, and how they shift away from the interface region. The absence of high- and low-speed streaks, close to the highly elastic walls, can be attributed to (i) a strong reduction of the mean shear (see figure 3
a), an important ingredient in the streaks formation mechanism (Lee, Kim & Moin Reference Lee, Kim and Moin1990; Brandt Reference Brandt2014) and (ii) strong wall-normal velocity fluctuations preventing the development of elongated structures. A region of positive values of
 $R_{uu}^{z}$
can be observed instead, at
 $y/h\approx 0.1$
and
 $0.07$
for the highly elastic cases,
 $G1$
and
 $G2$
: this indicates the emergence of structures elongated in the spanwise direction (as expected from the visualizations in figure 6) with an approximate length of
 $0.7{-}0.8h$
.
The correlation
 $R_{uu}^{z}$
pertaining to the particulate cases is given in the second row of figure 7(a). The addition of particles shortens the spanwise length of the structures in the cases
 $G1_{10\,\%}$
and
 $G2_{10\,\%}$
; the wall elasticity disrupts and displaces the high- and low-speed streaks towards the channel centre. The disruption of the near-wall streaks has been reported before for turbulent channel flows of finite-size spherical particles (Picano et al.
Reference Picano, Breugem and Brandt2015; Costa et al.
Reference Costa, Picano, Brandt and Breugem2018; Wang, Abbas & Climent Reference Wang, Abbas and Climent2018; Ardekani & Brandt Reference Ardekani and Brandt2019).
Next, we show the autocorrelations of the wall-normal velocity fluctuations along the streamwise direction
 $R_{vv}^{x}(y,\unicode[STIX]{x0394}x)$
, see figure 7(b). The results clearly reveal that the long quasi-streamwise vortices, associated with the presence of streaks, vanish when increasing the wall elasticity and are replaced by roller-type vortices, elongated in the spanwise direction. The active range of these vortical structures grows with the wall elasticity, reaching a size of approximately
 $140^{+}$
in the most elastic case
 $G1$
. In the particle-laden flows, the height of these vortices reduces in the highly elastic cases, whereas the quasi-streamwise vortices characteristic of the less deformable cases become shorter and more irregular. Breaking the large spanwise vortices near highly elastic walls results in less wall deformation and thus, an overall attenuation of the turbulent activity (see also figure 1
b); however, it should be also noted that breaking the quasi-streamwise vortices does not necessarily decrease the turbulent activity. Indeed, it has been shown before that spherical particles with the same size and volume fraction as considered here induce an increase of the turbulent activity near rigid walls (Picano et al.
Reference Picano, Breugem and Brandt2015; Ardekani et al.
Reference Ardekani, Costa, Breugem, Picano and Brandt2017), similarly to what observed in this study for the less elastic cases (see figure 5
d).
Contours of the weighted Reynolds shear stress at
 $y/h=0.05$
, given by multiplying the absolute value of the Reynolds shear stress by the joint probability density of its occurrence in the
 $u^{\prime }{-}v^{\prime }$
plane for: (a) the single-phase flow cases
 $G1$
to
 $G4$
, (b) the particulate cases
 $G1_{10\,\%}$
to
 $G4_{10\,\%}$
and (c) spherical shells 5 % larger than the particles in
 $G1_{10\,\%}$
to
 $G4_{10\,\%}$
.
 $G^{\ast }$
increases from left to right and the colours go from yellow to black (maximum).

So far we have presented a picture of the turbulence coherent structures near elastic walls, including the presence of finite-size particles; however, the way these structures contribute to the enhancement or attenuation of the Reynolds shear stress is yet to be understood. To this purpose, we compute the weighted Reynolds shear stress, obtained by multiplying the absolute value of Reynolds shear stress with the joint probability density of its occurrence in the
 $u^{\prime }{-}v^{\prime }$
plane (Zhou et al.
Reference Zhou, Adrian, Balachandar and Kendall1999). This analysis indicates the turbulent events that contribute the most to the Reynolds shear stress, dividing them into the four quadrants of the
 $u^{\prime }{-}v^{\prime }$
plane, denoted
 $Q_{1}$
to
 $Q_{4}$
. In particular,
 $Q_{2}$
(ejections:
 $u^{\prime }<0$
,
 $v^{\prime }>0$
) and
 $Q_{4}$
(sweeps:
 $u^{\prime }>0$
,
 $v^{\prime }<0$
) events result in turbulence production, while
 $Q_{1}$
and
 $Q_{3}$
are responsible for damping.
Contours of the weighted Reynolds shear stress are depicted in figure 8 for a wall-parallel plane slightly above the elastic wall
 $y/h=0.05$
;
 $y/h=0.05$
approximately matches the particle radius and is chosen to indicate the effect of the particles close to the wall on the near-wall turbulence. Panel (a) shows the results for the single-phase cases with elasticity decreasing from left to right. The major contribution to the turbulence production near the highly elastic walls comes from ejection events with significantly large values of
 $v^{\prime }$
and small negative
 $u^{\prime }$
; the contribution of sweeps comes from the events with an opposite combination, i.e. small negative
 $v^{\prime }$
and a relatively large positive
 $u^{\prime }$
. This observation reveals the mechanism by which the spanwise vortices, forming close to the highly elastic walls, contribute to the turbulence production: these vortices bring down the high momentum flow towards the elastic wall with a weak wall-normal velocity due to the decreased wall-blocking effect of the elastic layer, thus deforming the interface. The interface then releases this elastic energy by pushing the flow with a strong wall-normal velocity towards the centre of the channel, contributing to the turbulence production and regeneration of new spanwise vortical structures. The low magnitude of
 $u^{\prime }$
in the ejection events is believed to be due to the blocking effect from the upstream deformed interface. This is consistent with the asymmetric shape of the deformed wall (steeper slope for wall retraction), previously shown in figure 1(a). As the wall elasticity decreases, the distribution of the strong ejection events over the
 $u^{\prime }{-}v^{\prime }$
plane appears to become less elongated in the vertical direction (
 $v^{\prime }$
axis), while stretching along the
 $u^{\prime }$
axis. The relative contribution of sweep events increases when lowering the wall elasticity, although with smaller magnitudes of
 $u^{\prime }v^{\prime }$
. The distribution for the least elastic case (b) is similar to what found in turbulent flows in the vicinity of rigid walls (Kim et al.
Reference Kim, Moin and Moser1987), where the sweep events are slightly more powerful than the ejections.
The results pertaining to the particulate cases are depicted in figure 8(b). The shapes of the distribution are similar to the ones of the single-phase flow cases, except for an increase (
 $G3_{10\,\%}$
and
 $G4_{10\,\%}$
) or a reduction (
 $G1_{10\,\%}$
and
 $G2_{10\,\%}$
) in the magnitude of
 $v^{\prime }$
. To gain a better understanding of the particles role, we repeat the same analysis in figure 8(c), now sampling only the fluid inside a spherical shell which is
 $5\,\%$
larger than the particles (particles cutting the wall-normal plane
 $y/h=0.05$
). For the cases with highly elastic walls, the particles approach the interface region and are trapped inside strong sweep events with a relatively large streamwise velocity. The asymmetry in the magnitude of the wall-normal fluctuations (larger magnitudes for positive
 $v^{\prime }$
) causes the particles to move away from the wall considerably faster than when approaching it. Therefore, it is more likely to sample particles which are slowly approaching the wall, surrounded by
 $Q_{4}$
events. It should be noted here that the particle concentration is low in the vicinity of highly elastic walls as we will discuss later in § 3.3 and thus, the strong sweep events around the particles do not contribute significantly to the turbulent production. Indeed, particles reduce the active range of the large spanwise vortices, causing smaller wall deformation and in turn a turbulence attenuation. In addition to sweeps, stronger
 $Q_{1}$
events appear in the flow surrounding the particles when the wall elasticity decreases. This is due to particles with large streamwise velocity bouncing back from the less deformable walls. Even though
 $Q_{1}$
events damp the turbulence activity, the increase in the wall-normal velocity fluctuations and also stronger sweeps close to the wall result in an overall enhancement of the turbulent activity. The same conclusion can be drawn from figure 9, where the Reynolds shear stress is conditionally averaged and depicted for the second (
 $Q_{2}$
) and the fourth (
 $Q_{4}$
) quadrants of the
 $u^{\prime }{-}v^{\prime }$
plane against
 $y/h$
. Interestingly, both ejection and sweep events are damped in the presence of the particles for the highly elastic walls; while for the less elastic cases, turbulence is enhanced through sweep events and ejections are almost unchanged with respect to the single-phase cases.
Reynolds shear stress, conditionally averaged for (a) the second (
 $Q_{2}$
) and (b) the fourth (
 $Q_{4}$
) quadrant of
 $u^{\prime }{-}v^{\prime }$
plane.

3.3 Particle dynamics
The mean local volume fraction
 $\unicode[STIX]{x1D6F7}$
is depicted in figure 10(a). Spherical particles in the turbulent flow with rigid walls (case
 $RW_{10\,\%}$
) display a local maximum at a distance slightly larger than one particle radius from the wall. Picano et al. (Reference Picano, Breugem and Brandt2015) attributed this local maximum to the formation of a particle layer at the wall due to the wall–particle interactions that stabilize the particle position. Costa et al. (Reference Costa, Picano, Brandt and Breugem2016) further explained that the presence of this particle layer always results in drag increase with respect to the single-phase flow. Interestingly, the local maximum for
 $\unicode[STIX]{x1D6F7}$
is observed to reduce and move farther away from the wall when increasing the wall elasticity. The migration of the particles from the interface region can be explained by the presence of the strong ejection events with large
 $v^{\prime }$
in the flow in the case of highly elastic walls (see figure 8). Indeed, the strong asymmetry in the magnitude of the wall-normal velocity fluctuations, which favours positive
 $v^{\prime }$
, pushes the inertial particles towards the channel centre. However, as the wall elasticity decreases, a more symmetric distribution of
 $v^{\prime }$
allows the particles to form a layer close to the interface, similarly to the rigid wall cases. This particle-wall layer contributes to the turbulent production by increasing the cross-flow velocity fluctuations, as shown in the previous subsection.
To study the particle dynamics, we display in figure 10(b) the ratio between the turbulent kinetic energy of the fluid and that of the particle phase,
 $K_{f}^{\prime }/K_{p}^{\prime }=\langle {u^{\prime }}^{2}+{v^{\prime }}^{2}+{w^{\prime }}^{2}\rangle /\langle {u_{p}^{\prime }}^{2}+{v_{p}^{\prime }}^{2}+{w_{p}^{\prime }}^{2}\rangle$
. For the particle statistics presented in this figure the rigid body motion of the particles is taken into account. The local velocity of the particle phase is computed at each point by
 $\boldsymbol{u}_{p}+\pmb{\unicode[STIX]{x1D6FA}}_{p}\times (\boldsymbol{x}-\boldsymbol{x}_{c})$
, with
 $\boldsymbol{x}$
and
 $\boldsymbol{x}_{c}$
denoting an arbitrary point inside the particle and the particle centre, respectively. Particle velocities are observed to fluctuate less than the fluid at the same wall-normal distance, except for a tiny region close to the wall (
 $y/h\lessapprox 0.05$
), where the ratio is below
 $1$
for all the cases. The high particle fluctuation level in this region suggests that this is the cause of the near-wall enhancement of the fluid velocity fluctuations, observed in the cases with less elastic walls. The ratio between the two energies increases with the wall elasticity at
 $y=0$
, reaching
 $0.6$
in the most elastic case, when fewer particles can be found in this region. Particle–wall/particle collisions are observed to play an important role in increasing the fluctuations near the wall. Indeed, the particles in this region have a mean velocity larger than the surrounding fluid, due to their size and the fact that they can have a relative tangential motion at the wall. Therefore, any collision between the particles can result in strong velocity fluctuations. Figure 10(c) depicts the mean particle velocity profiles, normalized by the bulk velocity
 $U_{b}$
. Comparing the profiles with the mean velocity in figure 3(a) reveals that the particle and fluid phase have the same mean velocity throughout the channel, except for a small layer close to the wall with the width of approximately one particle diameter
 $D$
, where particles experience a larger mean velocity. The slip velocity at
 $y=0$
is observed to increase as the wall elasticity decreases.
Profiles of particle-phase averaged data versus
 $y/h$
: (a) mean local volume fraction, (b) the ratio between the turbulent kinetic energy of the fluid and of the particle phase and (c) mean particle velocity profiles, normalized by the bulk velocity
 $U_{b}$
.
 $RW_{10\,\%}$
refers to the case with rigid walls from the study of Ardekani et al. (Reference Ardekani, Costa, Breugem, Picano and Brandt2017). (d) Overall average particle velocity versus the modulus of transverse elasticity
 $G^{\ast }$
. The average of the particle velocity for
 $RW_{10\,\%}$
is indicated with a dotted line.

The overall average particle velocity is displayed in figure 10(d) versus the modulus of transverse elasticity
 $G^{\ast }$
. It can be observed in this figure that increasing the wall elasticity results in a faster transport of the solid phase as the averaged velocity increases from approximately
 $1.06U_{b}$
in the case of rigid walls (shown with a dotted horizontal line) to
 $1.14$
in the flow over the most elastic walls. This increase in the averaged velocity is due to the migration of the particles away from the interface region.
(a) Root-mean-square velocity fluctuations
 $u^{\prime }$
,
 $v^{\prime }$
and
 $w^{\prime }$
in the streamwise, ——, wall-normal, - - - and spanwise, …, directions and (b) Reynolds shear stress, scaled in outer units for the cases
 $G4$
,
 $G4_{10\,\%}$
and
 $G4_{NPWL}$
.
To show the importance of the particle-wall layer in the enhancement of the velocity fluctuations in this region, we perform a numerical experiment where we artificially remove this layer. In this simulation, denoted
 $G4_{NPWL}$
(no particle-wall layer), particles bounce back towards the core region of the channel before approaching the elastic walls, colliding with two virtual walls located at a distance
 $h/10$
from the two real interfaces (
 $y/h=0.1$
). The elasticity of the wall is set to
 $G^{\ast }=2$
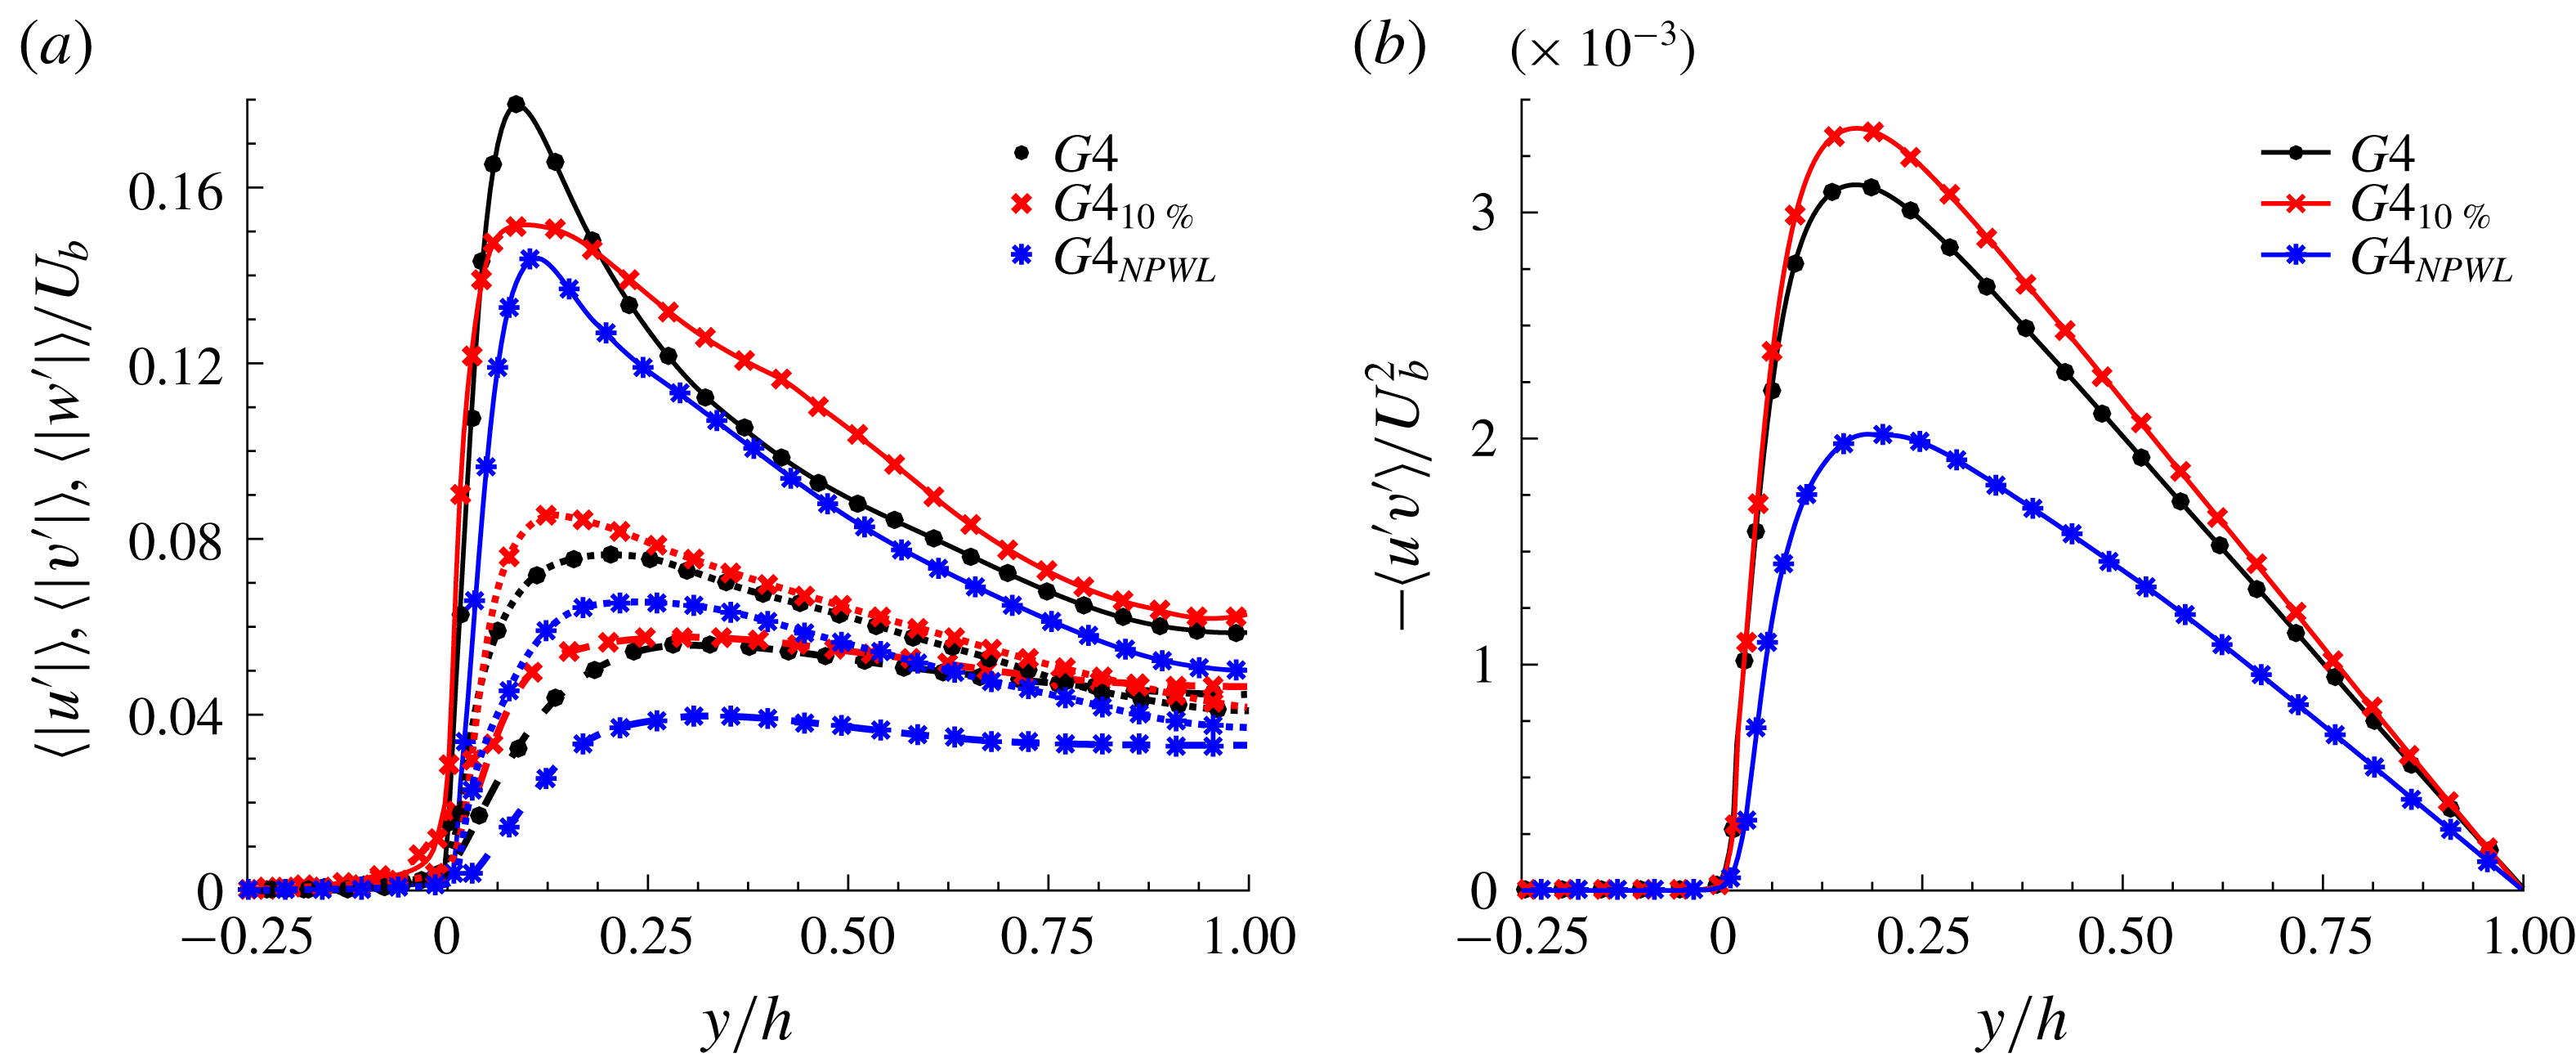
, i.e. the less deformable elastic wall previously considered, the case where the effect of the particle-wall layer is more pronounced. The velocity fluctuations and the Reynolds shear stress pertaining to this additional case are compared with the results for
 $G4$
and
 $G4_{10\,\%}$
in figure 11. The increase in the cross-flow fluctuations previously observed for the case
 $G4_{10\,\%}$
disappears when removing the particle-wall layer (
 $G4_{NPWL}$
), and as a consequence, a strong turbulence attenuation is obtained (see figure 11
b), with
 $v^{\prime }$
the most reduced fluctuation component. With particles not contributing to the turbulent production in the near-wall region, the attenuation of the turbulence activity can be associated with the increased effective viscosity of the suspension (Picano et al.
Reference Picano, Breugem and Brandt2015; Ardekani et al.
Reference Ardekani, Costa, Breugem, Picano and Brandt2017). The effective viscosity of a rigid particle suspension is always higher than that of the single-phase flow, which cause a reduction in the turbulent activity; however, this effect is usually compensated by the formation of a particle-wall layer and its contribution to the turbulence production, thus resulting in an overall enhancement of the turbulent activity (
 $G4$
). Hence, a strong turbulence attenuation and thus drag reduction (
 $Re_{\unicode[STIX]{x1D70F}}\approx 167$
) even with respect to the single-phase flow over rigid walls (
 $Re_{\unicode[STIX]{x1D70F}}\approx 180$
) can be obtained by removing the particle-wall layer (see figure 3
b).
3.4 Effect of the particle volume fraction
Instantaneous snapshots of the streamwise velocity
 $u$
on the
 $x$
–
 $y$
and
 $y$
–
 $z$
planes for walls with elastic modulus
 $G^{\ast }=0.5$
and different volume fractions (a)
 $\unicode[STIX]{x1D719}=0\,\%$
(case
 $G2$
), (b)
 $\unicode[STIX]{x1D719}=5\,\%$
(case
 $G2_{5\,\%}$
), (c)
 $\unicode[STIX]{x1D719}=10\,\%$
(case
 $G2_{10\,\%}$
) and (d)
 $\unicode[STIX]{x1D719}=20\,\%$
(case
 $G2_{20\,\%}$
). For clarity, only the particles lying within the selected
 $x$
–
 $y$
plane are displayed. The colour scale for the streamwise velocity ranges from
 $0$
(dark green) to
 $1.5u/U_{b}$
(white). The elastic walls are represented by the isosurface
 $\unicode[STIX]{x1D709}=0.5$
, coloured by the wall-normal distance, ranging from
 $-0.15h$
(white) to
 $0.15h$
(black).

Picano et al. (Reference Picano, Breugem and Brandt2015) investigated dense suspensions of spherical particles in a turbulent channel flow with rigid walls up to a volume fraction equal to
 $20\,\%$
. Their study revealed that the overall drag increase is mainly due to the enhancement of the turbulence activity up to
 $\unicode[STIX]{x1D719}=10\,\%$
and to the particle-induced stress at higher concentrations (
 $\unicode[STIX]{x1D719}=20\,\%$
), where the turbulence is instead attenuated. In this section we investigate the effect of the particle volume fraction in a channel with elastic walls. The case
 $G2$
, with elasticity
 $G^{\ast }=0.5$
, is simulated with two additional volume fractions,
 $\unicode[STIX]{x1D719}=5\,\%$
and
 $20\,\%$
, so to compare the change in drag with respect to the cases with rigid walls.
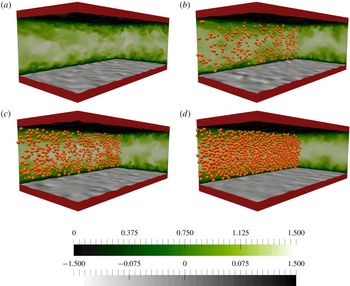
Snapshots of the flow and particles are displayed in figure 12, where the instantaneous streamwise velocity
 $u$
is depicted on
 $x$
–
 $y$
and
 $y$
–
 $z$
planes for the cases with
 $G^{\ast }=0.5$
and
 $\unicode[STIX]{x1D719}=0$
,
 $5\,\%$
,
 $10\,\%$
and
 $20\,\%$
. For clarity, just a fraction of the particles (those lying within the visualized
 $x$
–
 $y$
plane) are displayed. The wall deformation and the turbulent activity appear to decrease when increasing the particle volume fraction, especially in the case with
 $\unicode[STIX]{x1D719}=20\,\%$
. Note also the absence of a particle-wall layer close to the interface, even at highest volume fraction considered here,
 $\unicode[STIX]{x1D719}=20\,\%$
.
(a) Root-mean-square velocity fluctuations
 $u^{\prime }$
,
 $v^{\prime }$
and
 $w^{\prime }$
in the streamwise, ——, wall-normal, - - -, and spanwise, …, directions. (b) Mean local volume fraction profiles against the results for rigid walls (Picano et al.
Reference Picano, Breugem and Brandt2015). (c) The total contribution of each stress to the drag at the interface, normalized by the drag of the single-phase flow with rigid walls,
 $\unicode[STIX]{x1D70F}_{RW}$
(the dashed line with
 $Re_{\unicode[STIX]{x1D70F}}=180$
). The case
 $RW_{20\,\%}$
(rigid walls at
 $\unicode[STIX]{x1D719}=20\,\%$
) is extracted from the reported data in Picano et al. (Reference Picano, Breugem and Brandt2015). (d) The friction Reynolds number
 $Re_{\unicode[STIX]{x1D70F}}$
, versus the volume fraction
 $\unicode[STIX]{x1D719}$
.

The root-mean-square velocity fluctuations
 $\langle |u^{\prime }|\rangle$
,
 $\langle |v^{\prime }|\rangle$
and
 $\langle |w^{\prime }|\rangle$
are depicted in figure 13(a), versus the wall-normal distance
 $y/h$
. The results show a progressive reduction in the velocity fluctuations with increasing solid volume fraction. The decrease with respect to
 $G2$
is moderate for
 $G2_{5\,\%}$
and
 $G2_{10\,\%}$
, while for a volume fraction of
 $20\,\%$
a significant attenuation of all the velocity fluctuations is evident, especially in the core of the channel where the turbulent flow is almost relaminarized (see also figure 12
d). Differently from the results with rigid walls (Picano et al.
Reference Picano, Breugem and Brandt2015), the particles are observed here to attenuate the turbulence activity for all the volume fractions, with a reduction larger than that with rigid walls for the case at
 $\unicode[STIX]{x1D719}=20\,\%$
. We explain this by examining the mean local volume fraction profiles in figure 13(b), where data for rigid walls are also displayed (Picano et al.
Reference Picano, Breugem and Brandt2015). The particle-wall layer disappears for
 $\unicode[STIX]{x1D719}\leqslant 10\,\%$
and the near-wall peak is significantly reduced and displaced farther away from the wall (
 $y/h\approx 0.1$
) also for the case
 $G2_{20\,\%}$
. The particle migration away from the interface region causes a stronger attenuation of turbulence than in the presence of rigid walls at
 $\unicode[STIX]{x1D719}=20\,\%$
.
Following the analysis in equation (3.2), the contribution of each shear stress (viscous,
 $\unicode[STIX]{x1D70F}_{V}$
, Reynolds,
 $\unicode[STIX]{x1D70F}_{T}$
, hyper-elastic,
 $\unicode[STIX]{x1D70F}_{E}$
and particle-induced
 $\unicode[STIX]{x1D70F}_{P}$
), normalized by the drag of the single-phase flow over rigid walls (
 $\unicode[STIX]{x1D70F}_{RW}$
), is reported in figure 13(c) for different volume fractions at
 $G^{\ast }=0.5$
. The case
 $RW_{20\,\%}$
denotes the flow at
 $\unicode[STIX]{x1D719}=20\,\%$
over rigid walls from Picano et al. (Reference Picano, Breugem and Brandt2015). In spite of a reduced turbulent activity over an elastic wall, case
 $G2_{20\,\%}$
in comparison to
 $RW_{20\,\%}$
, the particle stress
 $\unicode[STIX]{x1D70F}_{P}$
more than compensates for the decrease of Reynolds shear stress, resulting in an overall higher drag for the flow over the elastic wall. The friction Reynolds number,
 $Re_{\unicode[STIX]{x1D70F}}$
, is finally compared with the results for rigid walls in figure 13(d), where the effect of wall elasticity is observed to reduce significantly when the volume fraction of the particles is increased.
4 Final remarks
We have reported results from direct numerical simulations of single-phase and particulate turbulent channel flows, bounded by two incompressible hyper-elastic walls at bulk Reynolds number
 $5600$
(
 $Re_{\unicode[STIX]{x1D70F}}\approx [180{-}380]$
). Four different wall elasticities are studied, ranging from an almost rigid to a highly elastic wall. Both single-phase and particulate cases are simulated at each wall elasticity, considering a
 $10\,\%$
volume fraction of finite-size neutrally buoyant rigid spherical particles with a diameter of
 $D=h/9$
with
 $h$
the half-channel width.
Our data show a significant drag increase and an enhancement of the turbulent activity with growing wall elasticity for both the single-phase and particle-laden flows. Upon addition of particles, drag reduction and a turbulent attenuation are documented for the flows over highly elastic walls; the opposite is observed for the flow over less elastic walls in which case the drag increases in the presence of the particles.
The strong asymmetry in the magnitude of the wall-normal velocity fluctuations (favouring positive
 $v^{\prime }$
) is found to push the particles towards the channel centre. However, as the wall elasticity decreases, a more symmetric distribution of
 $v^{\prime }$
allows the particles to form a layer close to the interface, similar to the suspension flow over rigid walls. The particle layer close to the wall is shown to contribute to increasing the wall-normal velocity fluctuations, while in the absence of this layer, smaller wall deformation and in turn turbulence attenuation is observed. We further address the importance of the particle-wall layer in turbulence production by performing a numerical experiment where we prevent the formation of this layer for the case with the least elastic walls. In this simulation the particles bounce back towards the core of the channel by colliding with two virtual walls located at a distance
 $h/10$
from the two real interfaces. The results of this simulation show a strong turbulence attenuation and thus drag reduction (
 $Re_{\unicode[STIX]{x1D70F}}\approx 167$
), even with respect to the single-phase flow over rigid walls (
 $Re_{\unicode[STIX]{x1D70F}}\approx 180$
).
The effect of the volume fraction is further studied at a moderate wall elasticity, by increasing the particle volume fraction up to
 $20\,\%$
. Migration of the particles from the interface region is found to be the cause of an increased turbulence attenuation, when comparing to the flow with same solid volume fraction over rigid walls. However, the particle-induced stress compensates for the decrease of the Reynolds shear stress, resulting in an overall drag increase in the case of elastic walls. The effect of the wall-elasticity on the drag is significantly reduced when the volume fraction of the particles increases.
We finally perform an extra simulation to distinguish the effect of wall elasticity on the near-wall turbulence from the modulation caused by a rough wall (see appendix A). In this simulation, an instantaneous configuration of the deformed interface, obtained in the single-phase case with the highest wall elasticity, is frozen in time. For the flow over this rough wall, the drag is strongly reduced, mostly due to the lower turbulence activity than in the flow over elastic walls. The strong and dominant ejection events, observed in the near-wall turbulence of highly elastic walls, are indeed significantly reduced near the rough walls. Therefore, we expect that migration of the spherical particles towards the channel centre would be reduced in the case of rough surfaces; this would however require a detailed analysis, left for future studies.
Acknowledgements
This work was supported by the European Research Council Grant no. ERC-2013-CoG-616186, TRITOS. The authors acknowledge computer time provided by SNIC (Swedish National Infrastructure for Computing) and the support from the COST Action MP1305: Flowing matter.
Appendix A. Roughness & elasticity
The single-phase turbulent flow over highly elastic walls shows similarities to what has been reported in the literature for turbulent flows over porous walls (Breugem et al.
Reference Breugem, Boersma and Uittenbogaard2006; Rosti et al.
Reference Rosti, Cortelezzi and Quadrio2015; Samanta et al.
Reference Samanta, Vinuesa, Lashgari, Schlatter and Brandt2015; Rosti et al.
Reference Rosti, Brandt and Pinelli2018b
), rough surfaces (Raupach et al.
Reference Raupach, Antonia and Rajagopalan1991; Jiménez et al.
Reference Jiménez, Uhlmann, Pinelli and Kawahara2001) and plant canopies (Finnigan Reference Finnigan2000). In this section, we wish to distinguish the main effects of wall elasticity on the near-wall turbulence from the modulation caused by the roughness. For this purpose, an additional simulation is performed where an instantaneous configuration of the deformed interface, obtained in the case with the largest wall elasticity (
 $G1$
), is chosen and frozen in time (
 $G^{\ast }\rightarrow \infty$
). A volume penalization IBM (Kajishima et al.
Reference Kajishima, Takiguchi, Hamasaki and Miyake2001; Breugem, Van Dijk & Delfos Reference Breugem, Van Dijk and Delfos2014; Ardekani et al.
Reference Ardekani, Al Asmar, Picano and Brandt2018) is employed to impose the no-slip/no-penetration boundary conditions on the surfaces, with the local solid fraction at each grid cell extracted from the instantaneous field
 $\unicode[STIX]{x1D709}$
in the simulation with deformable walls.
We start by comparing the mean velocity of the single-phase elastic cases with the results obtained for
 $G1_{FW}$
. The mean velocity profiles, scaled in inner units, are depicted in figure 14(a), versus
 $(y+d)^{+}$
. Here,
 $d$
is a shift of the origin (zero plane) (Jackson Reference Jackson1981; Breugem et al.
Reference Breugem, Boersma and Uittenbogaard2006; Suga et al.
Reference Suga, Matsumura, Ashitaka, Tominaga and Kaneda2010; Rosti & Brandt Reference Rosti and Brandt2017), following the modified log law
 $$\begin{eqnarray}\displaystyle U^{+}=\frac{1}{k+\unicode[STIX]{x0394}k}\log (y+d)^{+}+B-\unicode[STIX]{x0394}U^{+}. & & \displaystyle\end{eqnarray}$$
Here,
 $k+\unicode[STIX]{x0394}k$
and
 $B$
are the modified von Kármán and the additive constants (
 $k=0.4$
and
 $B=5.5$
) and
 $\unicode[STIX]{x0394}U^{+}$
is the velocity shift;
 $d$
is calculated similarly to Breugem et al. (Reference Breugem, Boersma and Uittenbogaard2006), Rosti & Brandt (Reference Rosti and Brandt2017) by iterating between several values until a region of constant
 $(y+d)^{+}\text{d}U^{+}/\text{d}y^{+}=1/(k+\unicode[STIX]{x0394}k)$
is obtained. The mean flow profiles show a significant reduction in the length of the logarithmic layer with increasing wall elasticity, which is not observed for
 $G1_{FW}$
. The values of the fitting parameters, reported in table 2, indicate a downward shift of the inertial range and an increase of its slope with increasing wall elasticities. The mean flow profile for
 $G1_{FW}$
shows a more pronounced downward shift than the change in slope of the logarithmic layer. Rosti & Brandt (Reference Rosti and Brandt2017) found a linear relation between the wall-normal velocity fluctuations at
 $y=0$
,
 $\unicode[STIX]{x0394}k$
and the velocity shift
 $\unicode[STIX]{x0394}U^{+}$
,
 $$\begin{eqnarray}\displaystyle \unicode[STIX]{x0394}U^{+}\approx \frac{\langle |v^{\prime }|\rangle (0)}{\unicode[STIX]{x0394}k}, & & \displaystyle\end{eqnarray}$$
thus modifying the correlation proposed by Orlandi & Leonardi (Reference Orlandi and Leonardi2008) for turbulent channel flows over rough walls. This linear correlation is shown in figure 14(b) for the single-phase cases, and interestingly the correlation is also valid for the rough case, depicted with a brown square in this figure. This indicates that the scaling can also be used for rough walls in addition to the elastic walls and the permeable walls, shown to match the correlation in the work of Rosti & Brandt (Reference Rosti and Brandt2017).
(a) Mean velocity profiles
 $U^{+}$
, scaled in inner units, versus
 $(y+d)^{+}$
, where
 $d$
is a shift of the origin. The blue, red, green and magenta solid lines are used for the cases
 $G1$
to
 $G4$
, respectively, while the profile for
 $G1_{FW}$
is indicated with a brown solid line. (b) Root mean square of the wall-normal velocity fluctuation at
 $y=0$
, divided by
 $|\unicode[STIX]{x0394}k|U_{b}$
, versus the velocity shift
 $\unicode[STIX]{x0394}U^{+}$
. The data for
 $G1_{FW}$
indicated with a brown square.

(a) The contribution of each stress to the total drag, normalized by the drag of the single-phase flow with rigid walls,
 $\unicode[STIX]{x1D70F}_{RW}$
(the dashed line with
 $Re_{\unicode[STIX]{x1D70F}}=180$
). (b) Contours of the weighted Reynolds shear stress for
 $G1_{FW}$
at
 $y/h=0.05$
, given by multiplying the absolute value of the Reynolds shear stress with the joint probability density of its occurrence in the
 $u^{\prime }{-}v^{\prime }$
plane. (c) One-dimensional autocorrelation of
 $u^{\prime }$
as a function of the spanwise spacing (
 $R_{uu}^{z}(y,\unicode[STIX]{x0394}z)$
) and (d) one-dimensional autocorrelation of
 $v^{\prime }$
as a function of the streamwise spacing for different
 $y/h$
(
 $R_{vv}^{x}(y,\unicode[STIX]{x0394}x)$
). The colour scheme in (c) and (d) is the same reported for figure 7.

Summary of the log-law fitting parameters with
 $d$
the origin shift,
 $k+\unicode[STIX]{x0394}k$
the modified von Kármán constant and
 $\unicode[STIX]{x0394}U^{+}$
the shift of the mean velocity profile in inner scales. Here,
 $v^{\prime }(0)$
denotes the wall-normal velocity fluctuation at
 $y=0$
.

The contribution of the different stresses to the global momentum transfer for cases
 $G1$
and
 $G1_{FW}$
is reported in figure 15(a). Note that
 $\unicode[STIX]{x1D70F}_{E}$
does not indicate the elastic stress for the fixed wall,
 $G1_{FW}$
, but the shear stress from the solid roughness elements acting in the streamwise direction. This is computed with the difference between the total drag (calculated by the imposed pressure gradient) and the sum of the viscous and Reynolds shear stresses inside the channel and is significantly smaller than the contribution of the elastic stress in
 $G1$
. The total drag is reduced from
 $4.65\unicode[STIX]{x1D70F}_{RW}$
to
 $2.42\unicode[STIX]{x1D70F}_{RW}$
in
 $G1_{FW}$
, mostly due to the lower turbulent activity in the flow over the rough walls.
To better understand the cause of this reduction, we display contours of the weighted Reynolds shear stress for the case
 $G1_{FW}$
at
 $y/h=0.05$
in figure 15(b) (as previously done in figure 8). Interestingly, the strong and dominant ejection events, previously observed for highly elastic walls, are nearly absent close to the rough walls. This further proves that these energetic events are indeed associated with the elastic potential energy of the deformable walls. Sweep events can be observed to be the dominant contribution to the turbulent production near the rough walls, similarly to turbulent flows over permeable walls (Breugem et al.
Reference Breugem, Boersma and Uittenbogaard2006; Suga et al.
Reference Suga, Matsumura, Ashitaka, Tominaga and Kaneda2010) or plant canopies (Zhu, Van Hout & Katz Reference Zhu, Van Hout and Katz2007). Finally, line and colour contours of
 $R_{uu}^{z}(y,\unicode[STIX]{x0394}z)$
and
 $R_{vv}^{x}(y,\unicode[STIX]{x0394}x)$
are presented in figure 15(c,d) for the flow over the rigid rough wall. The high- and low-speed streaks are observed to move upwards, with a larger spacing between them. Moreover, the spanwise vortices, previously observed near highly elastic walls, are absent in this case of rough walls. Note that, the two correlated regions (just below and above
 $y=0$
) in the contours of
 $R_{uu}^{z}$
are a consequence of the geometry of the rough surface, which has the spanwise deformations typical of the flow over highly elastic wall, case
 $G1$
.