Introduction
Many rating scales have been developed to assess the constructs of anxiety and depression, and they are widely used in clinical settings and in research. The choice of scale for use in research is often arbitrary (Carroll et al., Reference Carroll, Fielding and Blashki1973), perhaps under the assumption that all anxiety scales and all depression scales are measuring the same mental states. Yet this assumption is problematic as such scales vary in the areas of psychopathology that they cover (Snaith, Reference Snaith1993; Keedwell and Snaith, Reference Keedwell and Snaith1996), so they are not necessarily measuring the same construct. This variation in scale content makes direct comparison of findings from studies using different scales impossible (Snaith, Reference Snaith1993). It also highlights the importance of understanding exactly what an individual scale is measuring, and confirming that it measures the same constructs in different samples. This is of special relevance in the case of scales that were originally devised to assess anxiety and depression in hospital patients but have subsequently been used in studies of community-based samples.
The Hospital Anxiety and Depression Scale (HADS) is a case in point. This 14-item self-report questionnaire was developed to identify cases of anxiety and depression in non-psychiatric hospital clinics (Zigmond and Snaith, Reference Zigmond and Snaith1983). The aim was to distinguish the constructs of depression and anxiety, using two subscales each based on seven items, and to focus on one aspect of depression, anhedonia, which was considered the most reliable clinical marker of likely response to antidepressant drugs (Zigmond and Snaith, Reference Zigmond and Snaith1983; Snaith, Reference Snaith1993). Zigmond and Snaith suggested that scores of 8–10 or ≥ 11 out of 28 respectively were indicative of possible or probable depression or anxiety. The HADS has been used extensively, primarily but not exclusively in medical patients.
Evaluation of the psychometric properties of the HADS has been largely restricted to empirically based exploratory factor analysis, and the results have been equivocal: around 50% of studies have found that the HADS has a bi-dimensional structure, as assumed by the scale's authors, but others have argued that its structure is made up of one (Razavi et al., Reference Razavi, Delvaux, Farvacques and Robaye1990), three (Lewis, Reference Lewis1991), or even four factors (Andersson, Reference Andersson1993). Although a few studies have carried out exploratory factor analyses of the HADS in non-clinical samples – using Norwegian (Mykletun et al., Reference Mykletun, Stordal and Dahl2001), Dutch (Spinhoven et al., Reference Spinhoven, Ormel, Sloekers, Kempen, Speckens and Hemert1997), and Swedish (Lisspers et al., Reference Lisspers, Nygren and Soderman1997) versions of the scale – most such analyses have been based on small, selected samples of patients with somatic illnesses (Herrmann, Reference Herrmann1997; Bjelland et al., Reference Bjelland, Dahl, Haug and Neckelmann2002).
More recently, confirmatory factor analysis of the HADS in three groups aged 18, 39 and 58 years from a community-based cohort found that a three-factor model, derived from Clark and Watson's tripartite hypothesis of anxiety and depression (Clark and Watson, Reference Clark and Watson1991), appeared to underlie the responses to the scale's items (Dunbar et al., Reference Dunbar, Ford, Hunt and Der2000). According to this hypothesis, anxiety and depression have distinctive features, but share characteristics with a third component – general distress or “negative affectivity”, defined as “a temperamental sensitivity of negative stimuli”(Clark et al., Reference Clark, Steer and Beck1994). A three-factor structure to the HADS has subsequently been found in confirmatory factor analyses of data from clinical samples (Desmond and MacLachlan, Reference Desmond and MacLachlan2005; McCue et al., Reference McCue, Buchanan and Martin2006; Martin et al., Reference Martin, Thompson and Barth2008), and in students (Caci et al., Reference Caci, Bayle, Mattei, Dossios, Robert and Boyer2003). One reservation concerning the three-factor model is that some studies find that two of the latent traits are almost perfectly correlated (Dunbar et al., Reference Dunbar, Ford, Hunt and Der2000; Desmond and MacLachlan, Reference Desmond and MacLachlan2005; McCue et al., Reference McCue, Buchanan and Martin2006; Martin et al., Reference Martin, Thompson and Barth2008). This would mean that the psychological constructs represented by the latent traits were the same; any small deviation from perfect correlation might be caused by relatively trivial psychometric properties of the items. However, others find the correlation between them to be lower (Friedman et al., Reference Friedman, Samuelian, Lancrenon, Even and Chiarelli2001; Caci et al., Reference Caci, Bayle, Mattei, Dossios, Robert and Boyer2003), which means that there is still an important open question about the number of psychological constructs being assessed in the HADS, and whether the number actually differs between samples. By fitting Dunbar's three-factor model to data from multiple samples we aim to contribute substantially to resolving this issue.
Very little is known about the dimensional structure of the HADS in non-clinical samples of older men and women. The scale was originally developed for use in hospital outpatients aged 16 to 65 and its authors recommended further research to validate its use in older people (Zigmond and Snaith, Reference Zigmond and Snaith1983). Only one confirmatory factor analysis has been carried out of HADS data in people aged over 65, and that was based on male veterans with limb amputations and a high prevalence of psychological distress (Desmond and MacLachlan, Reference Desmond and MacLachlan2005). The only exploratory factor analysis of HADS in community-based people of this age was based on the Dutch version of the scale (Spinhoven et al., Reference Spinhoven, Ormel, Sloekers, Kempen, Speckens and Hemert1997). In this latter study, which included three general population samples with a combined age range of 18 to 99, and in a very large Norwegian general population sample aged 20 to 89 (Stordal et al., Reference Stordal, Bjartveit Kruger, Dahl, Kruger, Mykletun and Dahl2001) there was evidence that HADS depression scores tended to be slightly higher with increasing age. Comparison of factor structures in both the Dutch (Spinhoven et al., Reference Spinhoven, Ormel, Sloekers, Kempen, Speckens and Hemert1997) and the Norwegian samples (Mykletun et al., Reference Mykletun, Stordal and Dahl2001) found no indication that these differed between age groups, but in a study using the English version of the scale in general population samples, relative loadings of symptoms on factors were not identical in different age groups (Dunbar et al., Reference Dunbar, Ford, Hunt and Der2000). Further exploration of the psychometric properties of the HADS in non-clinical samples of older people is needed to clarify the relation between factor structure and age, and to examine whether there is factorial invariance across the sexes, and/or across samples from different areas.
HALCyon – Healthy Ageing across the Life Course – is a collaborative research program using data from nine U.K. cohorts to examine how factors across the life course influence psychological well-being and other aspects of healthy aging in older people. Men and women from four of these cohorts, two from England, one from Scotland, and one from Wales, completed the HADS at ages ranging from 65 to 80 years. We used these large samples formally to compare the dimensional structure of the HADS both within cohorts (by sex) and between cohorts by means of exploratory and confirmatory factor analysis.
Methods
This study uses data from four cohorts: the Caerphilly Prospective Study, the Hertfordshire Ageing Study, the Hertfordshire Cohort Study, and the Lothian Birth Cohort 1921.
The Caerphilly Prospective Study (CaPS)
The Caerphilly Study was set up in 1979 to study the etiology of heart disease in men (Caerphilly and Speedwell Collaborative Group, 1984). Subsequently, the scope of the study was broadened to include stroke, cancer and cognitive function. In total, 2512 men from Caerphilly and adjoining villages took part in the initial phase of the study (response rate 89%). In 2002–4, 1225 men aged 60–83 years took part in the fifth phase (75% of those invited); 1028 completed the HADS.
The Hertfordshire Ageing Study (HAS)
From 1911 to 1948 each birth in Hertfordshire was notified by the attending midwife and the baby's birth weight was recorded in centrally held registers. Singleton infants born to married mothers were traced and those still living in Hertfordshire who had been born between 1920 and 1930 were invited to take part in research into life-course influences on aging (Syddall et al., Reference Syddall, Simmonds, Martin, Watson, Dennison, Cooper and Sayer2010). Of 1428 people invited to participate in 1994–5, 824 (58%) agreed to a home interview and 717 attended a clinic for further assessments. In 2003–5, a follow-up study was carried out when the participants were aged 72–83 years. In total, 359 men and women (60% of those surviving) were interviewed; 357 (42% female) completed the HADS.
The Hertfordshire Cohort Study (HCS)
In 1998–2004, people born in Hertfordshire between 1931 and 1939 and still living in the county were recruited to a new, larger cohort study to evaluate interactions between the genome, the intrauterine and early postnatal environment, and adult lifestyle in the etiology of chronic disorders in later life (Syddall et al., Reference Syddall, Sayer, Dennison, Martin, Barker and Cooper2005). Of 6099 people approached, 3225 (53%) agreed to be interviewed at home; 3221 (48% female) completed the HADS.
The Lothian Birth Cohort 1921 (LBC)
On 1 June 1932, as part of the Scottish Mental Survey, all children born in 1921 who attended school in Scotland sat a test of mental ability, a version of the Moray House Test No. 12. Records of these tests on the 87,498 children who took part were preserved. Men and women who were living in the Edinburgh area and who were born in 1921 were invited in 1999–2001 to take part in a study of lifecourse influences on cognitive ageing (Deary et al., Reference Deary, Whiteman, Starr, Whalley and Fox2004). Of 549 people who participated, 547 (58% female) completed the HADS.
Administration of the HADS
In each cohort, the instructions given to participants were those devised by the scale's authors (Zigmond and Snaith, Reference Zigmond and Snaith1983). Participants were asked to give the response to each statement which “comes closest to how you have felt in the past week.” Participants in the two Hertfordshire cohorts completed the HADS at the end of a home interview; participants in the Lothian Birth Cohort and the Caerphilly Prospective Study completed it during a clinic visit. The HADS was self-administered in all cohorts. Participants in the Lothian Birth Cohort had the instructions read out to them before completing the HADS; participants in other cohorts were asked to read the instructions.
Statistical analysis
We used ANOVA, t-tests and the χ2 test to examine the characteristics of the participants. We used Cohen's formula to calculate effect sizes (d) for the differences in HADS scores between men and women (Cohen, Reference Cohen1977). Analyzing men and women from each cohort separately (seven samples in total, four of men, three of women), we carried out exploratory principal components analyses of the HADS items to assess the number of separable components. We used the term “factors” in referring to the rotated components. The number of components extracted was determined by examination of the scree plots. An oblique rotation (direct oblimin) was then carried out to achieve a more readily interpretable factor structure. We calculated coefficients of congruence to assess the homogeneity of the factor solution between samples. Cronbach's α was used to assess internal consistency of components.
More rigorous tests of the dimensional structure of the HADS were then undertaken by means of confirmatory factor analysis using the MLR estimator in Mplus version 5.2 (Muthén and Muthén, Reference Muthén and Muthén2007). The MLR estimator provides robust maximum likelihood estimates for non-normal data (Yuan and Bentler, Reference Yuan, Bentler, Sobel and Becker2000). We first square-root transformed the raw data to counter a general tendency towards positive skew.
The first aim of the confirmatory factor analysis was to assess the fit of Dunbar's three-factor model of the HADS – consisting of “anxiety” (items 3, 9, 13), “negative affectivity” (items 1, 5, 7, 11) and “depression” (items 2, 4, 6, 7, 8, 10, 12, 14) (Dunbar et al., Reference Dunbar, Ford, Hunt and Der2000) – to data from each of the seven samples. We then examined a two-factor model of “anxiety” and “depression” in each sample – as intended by the authors of HADS – based on the results of our exploratory factor analyses.
The free parameters in the two-factor model were factor loadings for HADS items 3, 5, 7, 9, 11 and 13 onto “anxiety”, factor loadings for items 4, 6, 7, 8, 10, 12, and 14 onto “depression”, intercepts, residual variances, and the covariance between the two latent variables. The loading coefficients for items 1 onto “anxiety” and 2 onto “depression” were fixed to 1 to set the measurement scale of each latent variable.
Multi-group confirmatory factor analysis was conducted to assess the factorial invariance of the two-factor model. Comparisons between all pairs of the seven groups were carried out. Each comparison was a χ2 difference test between models with and without equality constraints on corresponding factor loadings. In the unconstrained model the intercepts, factor loadings, and residual variances were free across the two groups, and the factor means were fixed at zero for both groups so that the intercepts are also the means. The constrained model was identical except that corresponding factor loadings were constrained to be equal across groups. The logic of this test of factorial invariance is simply that if there is no significant difference between the fit of the constrained and unconstrained models, then the factor loadings may as well be equal across the groups. This would allow us to conclude that the model has the same function, that it explains covariance structure in the same way across groups.
The all-pairs multi-group comparison was carried out with no covariates, and then repeated with the covariates age and social class added separately to the model with direct influence on the observed scores to adjust for differences between groups in mean age and social class structure (Lubke et al., Reference Lubke, Dolan, Kelderman and Mellenbergh2003). Marginal comparisons were also carried out to assess factorial invariance across cohorts averaged across sex, and across sex averaged across cohorts. Finally, the all-pairs comparisons were repeated with equality constraints between individual factor loadings one at a time, to assess which of the HADS items contributes the most to differences between the cohorts.
We assessed the goodness of fit of the models by means of the root mean squared error of approximation (RMSEA), the Comparative Fit Index (CFI), and Bayesian Information Criteria (BIC). A RMSEA less than 0.05 provides a good fit to the data, while values greater than 0.1 suggest the model fit is unsatisfactory (Browne and Cudeck, Reference Browne, Cudeck, Bollen and Long1993). A CFI greater than 0.90 indicates a good fit to the data (Muthén and Muthén, Reference Muthén and Muthén2007). Bayesian Information Criteria can be used to compare models; given any two estimated models, the model with the lower value BIC is the one to be preferred (Schwarz, Reference Schwarz1978).
Results
Table 1 shows the mean age of the participants in the four cohorts, the proportion that came from non-manual social classes, and mean scores on the HADS anxiety and depression subscales according to sex. The cohorts differed significantly in mean age. Whereas the social class structure of the two Hertfordshire cohorts and the Caerphilly Prospective Study was similar, the Lothian Birth Cohort had a larger proportion in non-manual classes. In each cohort, apart from the male-only Caerphilly Study, women had higher mean anxiety scores than men. Effect sizes for this difference between the sexes in each cohort were medium in size: Cohen's d = 0.29 in the Hertfordshire Ageing Study and the Lothian Birth Cohort and 0.33 in the Hertfordshire Cohort Study. Depression scores differed little between the sexes. In the three cohorts whose participants varied in age, there was no relation between anxiety scores and age, but increasing age was associated with slightly higher depression scores: Caerphilly Prospective Study r = 0.10, p = 0.002, Hertfordshire Ageing Study r = 0.15, p = 0.003, and Hertfordshire Cohort Study r = 0.04, p = 0.044.
Characteristics of the cohorts

Exploratory factor analysis
In principal components analyses of the HADS items in men and women from each cohort separately, examination of the scree slopes clearly suggested that two factors were present in each group. In men, the first two unrotated components together accounted for 36.4% of the total variance among the 14 items in the Lothian Birth Cohort, 42.6% in the Hertfordshire Ageing Study, 42.0% in the Hertfordshire Cohort Study and 48.9% in Caerphilly. In women, the equivalent figures were 40.3% in the Lothian Birth Cohort, 47.0% in the Hertfordshire Ageing Study, and 43.5% in the Hertfordshire Cohort Study.
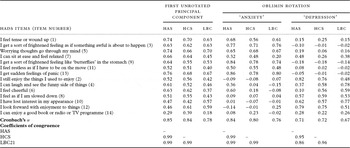
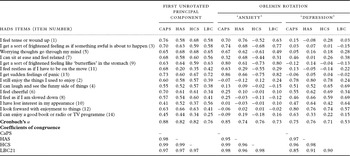
Tables 2 and 3 show, for women and men respectively by cohort, the loadings of each item on the first unrotated principal component and the loadings on the two factors after rotation. In both sexes and in each cohort, the nominal anxiety items tended to have a high loading on the first rotated factor, while the nominal depression items loaded more strongly on the second rotated factor. The anxiety item “I can sit at ease and feel relaxed” was the only item that diverged from this pattern: in most of the groups, with the exception of men from the Hertfordshire Ageing Study, it loaded on both the anxiety and depression factors and the size of the loadings was modest. In general, however, there was substantial homogeneity of the factor solution between groups with coefficients of congruence ranging between 0.85 and 0.99. There was also considerable similarity between samples as regards the internal consistency of the HADS as indicated by Cronbach's α. In the Lothian Birth Cohort, Cronbach's α for the “depression” factor was 0.53 in men and 0.67 in women, but all other values of Cronbach's α ranged between 0.71 and 0.88.
Principal components analysis followed by oblimin rotation of the HADS scale in women from the Hertfordshire Ageing Study (HAS), the Hertfordshire Cohort Study (HCS), and the Lothian Birth Cohort 1921 Study (LBC)

Principal components analysis followed by oblimin rotation of the HADS scale in men from the Caerphilly Prospective Study (CaPS), Hertfordshire Ageing Study (HAS), the Hertfordshire Cohort Study (HCS), and the Lothian Birth Cohort 1921 Study (LBC)

Confirmatory factor analysis
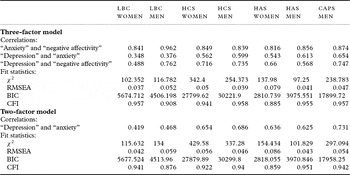
First, we aimed to examine how well Dunbar's three-factor model fitted the data from each of the seven samples. However, it was not possible to fit this model to one of the samples – the Lothian Birth Cohort men – in which the program reported a non-positive-definite factor covariance matrix. The covariance matrix also collapsed during attempts to compare the factorial invariance of the three-factor model between the samples. This was attributed to the very high correlation between the “anxiety” and “negative affectivity” factors in this model. Table 4 shows the correlation coefficients between the three factors and the fit statistics for this model in each of the seven samples. The correlation coefficients between the supposedly distinct “anxiety” and “negative affectivity” factors in the seven samples ranged from 0.82 to 0.96. We concluded that such high correlations indicate that the two latent constructs are as identical as makes no difference psychologically, especially in the situation where each has few indicators. Fit statistics for the three-factor model for the Lothian Birth Cohort men need to be viewed with caution because the factor covariance matrix collapsed when the model was fitted to these data, but for five of the remaining six samples values for RMSEA were ≤ 0.5 and for CFI >0.9 suggesting that the three factor model was a good fit – at least statistically – to these data. RMSEA was <0.08 in the case of the Hertfordshire Ageing Study women, indicating an acceptable fit to these data.
Correlations between component factors and fit statistics for the three-factor and two-factor models in men and women from each cohort

RMSEA = root mean squared error of approximation; BIC = Bayesian Information Criteria; CFI = Comparative Fit Index
CaPS = Caerphilly Prospective Study; HAS = Hertfordshire Ageing Study; HCS = Hertfordshire Cohort Study; LBC = Lothian Birth Cohort 1921 Study
There are always possible alternative models that may be applied to data in structural equation modeling. Here, an obvious alternative – as intended by the HADS's authors and suggested clearly by principal components analysis – is a two-factor model. We therefore examined the fit of the two-factor model, on the basis of these considerations and the fact that two such highly-correlated latent traits did not seem separable as psychological constructs. Table 4 shows the correlations between the “anxiety” and “depression” factors and the fit statistics for each sample. Comparison of the correlations shows a considerable similarity between men and women within cohorts, and a slightly greater variation between cohorts, with correlation coefficients ranging from 0.42 (Lothian Birth Cohort women) to 0.73 (Caerphilly men). Values of RMSEA were <0.05 for four samples and between 0.05 and 0.086 for the remaining three, indicating that the model was a good or acceptable fit respectively to these data. CFI was >0.9 for five of the samples, again suggesting good fit to these data.
We carried out a χ2 difference test comparing the two-factor and the three-factor models for each of the seven samples. With the exception of the Hertfordshire Ageing Study men, there were significant differences in the fit of these models in all the samples, though the test for Lothian Birth Cohort men is suspect since the three-factor model results in covariance matrix collapse. When sample sizes are large, as here, minor variations in fit can easily produce a statistically significant χ2 statistic. Although the other goodness-of-fit measures (BIC, RMSEA, CFI) show that the three-factor model is generally a better fit, comparison of these measures for each model suggests that the difference in fit between the models is small.
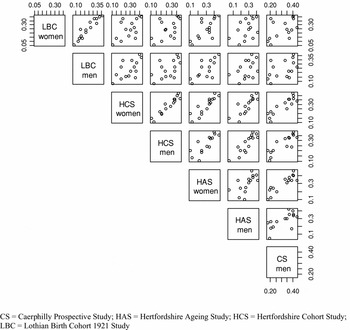
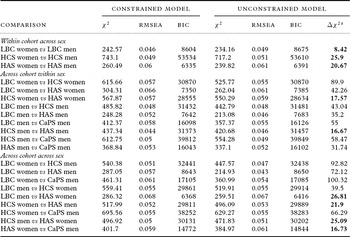
Next we examined the similarity of the covariance structure of the item correlations between the groups using multi-sample confirmatory factor analysis for the two-factor model. Figure 1 is a scatterplot matrix, which we use as a summary to compare the factor loadings for the two-factor model across the seven samples. It is evident that in general, there is a greater similarity of factor loadings within cohorts (between the sexes), than between the cohorts. Table 5 shows the detailed results of the all-pairs multi-group comparison. The similarity of the covariance matrices between each pair of data sets is indicated by the size of the χ2 difference (Δ χ2). Factorial invariance across a given pair of groups is indicated by a low non-significant χ2 difference (shown in bold in Table 5). Significance should not be taken as critical since the large sample size makes the test over-powered. However, the relative size of the χ2 difference is informative. Comparisons made of men and women within cohort were all non-significant, indicating that the sizes of the respective item loadings on the two factors were effectively identical. Comparisons made across cohorts tended to have larger values for Δ χ2, indicating that in general there was less similarity of factor loadings between cohorts, but there were exceptions to this, particularly in the case of the two Hertfordshire cohorts where the covariance matrices were very similar, especially among participants of the same sex.
Scatterplot matrix showing comparisons of factor loadings for the two-factor model across the seven samples. Each panel shows the loadings for one sample plotted against the corresponding loadings from another sample. The points lie on a diagonal line if corresponding loadings are equal.

All-pairs multi-group confirmatory factor analysis

a The Δ is the difference in χ2of the constrained (df = 163) minus the unconstrained (df = 150) model. Bold Δ χ2 are non-significant (df = 13, p>0.01), indicating broadly that the parameter weights (factor loadings) are similar in the groups being compared.
RMSEA = root mean squared error of approximation; BIC = Bayesian Information Criteria; CFI = Comparative Fit Index
CaPS = Caerphilly Prospective Study; HAS = Hertfordshire Ageing Study; HCS = Hertfordshire Cohort Study; LBC = Lothian Birth Cohort 1921 Study
We examined whether, among the samples as a whole, there was greater similarity in factor loadings between the sexes, averaged across cohorts, than there was between cohorts, averaged across the sexes. The χ2 difference between models with and without equality constraints on corresponding factor loadings showed that there was a significant difference in factor loadings between men and women averaged across cohorts, and between cohorts averaged across men and women. However, the size of this difference was less between the sexes than it was between the cohorts: Δ χ2 was 43.78 for the effect of sex and 237.65 for the effect of cohort.
As noted above, there were some demographic differences between the cohorts. All pairs of cohorts differed in mean age, and the Lothian Birth Cohort differed from the other three cohorts in social class structure. Controlling for mean age in the model resulted in negligible change to the χ2 difference between constrained and unconstrained models. Controlling for differences in class structure produced a reduction in χ2 differences, compared with the corresponding unadjusted models, but only for comparisons that included the Lothian Birth Cohort (supplementary data, not shown). Thus adjusting for the effect of social class reduced the χ2 difference between cohorts that have a different class structure by between 1.4% and 7.4%, but did not reduce the difference between cohorts that are similar in social class.
Finally, we explored whether individual items in the HADS contributed to lack of factorial invariance between samples, by setting the equality constraints between corresponding factor loadings one at a time. We adjusted for social class in these models. In comparisons between the Lothian Birth Cohort and each of the other three cohorts, responses to items number 4 and 10, “I can laugh and see the funny side of things” and “I have lost interest in my appearance”, were the main contributors to the difference in factor loadings between the LBC and other cohorts but, apart from this, individual items in the HADS contributed little to differences in the measurement model between samples (supplementary data, not shown).
Discussion
We examined the dimensional structure and factorial invariance of the HADS in four cohorts of community-based, healthy older people. Principal components analysis with oblimin rotation supported the bi-dimensional structure of the scale in men and women in each cohort, and coefficients of congruence suggested considerable similarity of the two factors both within cohorts (by sex) and between cohorts. We attempted to examine whether Dunbar's three-factor model fitted each of our seven samples, but there were very high correlations between the “anxiety” and “negative affectivity” subscales in all samples, and the factor covariance matrix collapsed owing to this in one sample. Using a two-factor model, multi-group confirmatory factor analyses showed that factorial invariance was greatest between men and women in the same cohort. There was more variation in factor loadings between cohorts, particularly when comparing those from different parts of the U.K. Differences in social class distribution accounted for a small part of this variation.
Our findings of a consistent bi-dimensional structure to the HADS in data from community-based men and women in four cohorts is in keeping with the results of the majority of factor analytic studies into the structure of this scale, primarily carried out in clinical samples (Herrmann, Reference Herrmann1997; Bjelland et al., Reference Bjelland, Dahl, Haug and Neckelmann2002). However, several investigators have found evidence of two separate anxiety subscales, in addition to a “depression” factor, in both clinical and non-clinical samples. A three-factor model (“anxiety”, “negative affectivity” and “depression”) provided a good fit to data from three age cohorts in the West of Scotland Twenty-07 study (Dunbar et al., Reference Dunbar, Ford, Hunt and Der2000). Exploratory factor analysis of data from a group of outpatients being treated for major depression also produced a three-factor model, similar to that of Dunbar, where the anxiety items were split into “psychic anxiety” and “psychomotor agitation” (Friedman et al., Reference Friedman, Samuelian, Lancrenon, Even and Chiarelli2001). Caci et al., were unable to fit Dunbar's model to HADS data from French students, but they too reported that the anxiety items had two components, “anxiety” and “restlessness”(Caci et al., Reference Caci, Bayle, Mattei, Dossios, Robert and Boyer2003). Two large studies, one in older veterans with amputations (Desmond and MacLachlan, Reference Desmond and MacLachlan2005), the other in people with chronic fatigue syndrome and a healthy control group (McCue et al., Reference McCue, Buchanan and Martin2006), both found support for Dunbar's three-factor model of the HADS. Further indications that there might be three factors in the HADS comes from a study of coronary heart disease patients in Germany, Hong Kong and the U.K., where the three-factor models reported by Dunbar and Friedman provided the best fits (Martin et al., Reference Martin, Thompson and Barth2008).
However, it is worth noting that in most of the studies that found evidence of three factors in the HADS, the two factors derived from the anxiety items were very highly correlated: correlation coefficients ranged from 0.85 to 0.95 (Dunbar et al., Reference Dunbar, Ford, Hunt and Der2000; Desmond and MacLachlan, Reference Desmond and MacLachlan2005; McCue et al., Reference McCue, Buchanan and Martin2006; Martin et al., Reference Martin, Thompson and Barth2008). In the present study too, we found that these anxiety subscales were highly correlated, so much so in one sample that the factor covariance matrix collapsed. While these two factors might have been differentiable statistically in previous studies, the strength of the correlations between them raises questions about their clinical usefulness as separate constructs, and indeed their psychological credibility as separate constructs especially when they are based on very few indicator variables. It is significant that in most of these studies a two-factor model also met criteria for good or acceptable fit, and fitted almost as well as the three-factor model.
Although we found a consistent two-dimensional structure to the HADS in all four cohorts, and in both sexes, factorial equivalence was greatest within cohorts (between men and women) than between them. A previous study of the structure of the HADS found that relative loadings of symptoms on factors are not identical in people from different countries (Martin et al., Reference Martin, Thompson and Barth2008). There is some evidence that factor structure varies between different age groups (Dunbar et al., Reference Dunbar, Ford, Hunt and Der2000), though this is not a consistent finding. In a large Norwegian general population sample aged 20–89 years there were no differences in factor structure between age groups (Mykletun et al., Reference Mykletun, Stordal and Dahl2001), though increasing age was associated with higher HADS depression scores (Stordal et al., Reference Stordal, Bjartveit Kruger, Dahl, Kruger, Mykletun and Dahl2001). Within the comparatively narrow age range of our participants (65–80 years), we found that depression scores tended to be higher with increasing age, but there was no evidence that age was an important determinant of variation in factor loadings between cohorts, although social class distribution played some role. The higher proportion of men and women from non-manual social classes in the Lothian Birth Cohort compared to each of the other three cohorts appeared to explain a small part of the difference in factor loadings between the Lothian Birth Cohort and these other cohorts. There was also evidence that two of the individual items in the HADS – “I can laugh and see the funny side of things” and “I have lost interest in my appearance”– contributed to the difference in factor loadings between this cohort and the other three.
One explanation for the variation between cohorts in factor loadings might be sociocultural or geographic differences in the way that the anxiety and depression symptoms described by the HADS items are associated. Comparisons between cohorts showed that factor loadings tended to differ far more between cohorts from different parts of the U.K. (Scotland, Wales and England), than they did between the two English cohorts, both of whose participants were born and continue to live in Hertfordshire. Differences in the way the HADS was administered in each cohort may also contribute to factorial invariance. Although all cohorts provided participants with the instructions devised by the scale's authors, those in the Lothian Birth Cohort were unique in that the instructions were always read out to them, with emphasis on the period during which the moods should be evaluated. This may have encouraged them to focus more intently on recent feelings when completing the HADS than participants in other cohorts who read the instructions themselves. More emphasis on recent feelings would focus on the relatively transient states – as opposed to longer-lasting trait-like tendencies toward certain mood states –and could account for the lower Cronbach α values in the Lothian Birth Cohort.
In this study, we found consistent evidence for a bi-dimensional structure to the HADS in seven samples of older men and women from four U.K. cohorts. This confirms that scoring the measure as two subscales of anxiety and depression is appropriate in non-clinical populations of this age. While the structure of the scale was the same across samples, its measurement characteristics were not identical between cohorts, particularly those from different parts of the U.K. and/or in cohorts where there were different methods of administering the questionnaire.
Conflict of interest
None.
Description of authors' roles
C. Gale designed the study and wrote the paper. M. Allerhand carried out the statistical analysis and assisted with writing the paper. A. Aihie Sayer, E. Dennison, C. Cooper, Y. Ben-Shlomo, J. Gallacher and J. Starr supervised data collection and assisted with writing the paper. D. Kuh is responsible for the HALCyon program and assisted with writing the paper. I. Deary designed the study, supervised data collection and assisted with writing the paper. All authors contributed to the final draft.
Acknowledgments
The HALCyon collaborative research program is funded by the New Dynamics of Ageing (NDA) program, a joint seven-year initiative of five U.K. Research Councils. The Caerphilly Prospective study was conducted by the former MRC Epidemiology Unit (South Wales) and funded by the Medical Research Council, and the Alzheimer's Society; the Department of Social Medicine, University of Bristol now maintains the data archive. The Hertfordshire Cohort Study was funded by the Medical Research Council, the British Heart Foundation, Arthritis Research Campaign, the National Osteoporosis Society, Wellcome Trust and the University of Southampton. The Hertfordshire Ageing Study was funded by the Medical Research Council and the University of Southampton. The Lothian Birth Cohort 1921 was funded by the Biotechnology and Biological Sciences Research Council and the Chief Scientist Office of the Scottish Executive Health Department. The Centre for Cognitive Ageing and Cognitive Epidemiology is funded by the Biotechnology Sciences Research Council, the Engineering and Physical Sciences Research Council, the Economic and Social Research Council, the Medical Research Council and the University of Edinburgh as part of the cross-council Lifelong Health and Wellbeing initiative.