1 Introduction
There is tremendous interest in designing optimal feedback controllers for complex turbulent separated flows to achieve various engineering and technological benefits. Such a feedback control design that autonomously adjusts depending on the state of the flow has advantages in terms of minimizing energy input and robustness to changes in flow conditions (Colonius & Williams Reference Colonius and Williams2011). Traditionally, excitation of flow instabilities based on open-loop periodic forcing (Greenblatt & Wygnanski Reference Greenblatt and Wygnanski2000) and feedback control design based on a linear systems approach (Kim & Bewley Reference Kim and Bewley2007) have guided flow control designs. The linear systems framework often relies on linearization of the governing Navier–Stokes equation based on which model-predictive control using adjoint-based optimization techniques or optimal control laws using Riccati-based feedback are designed (Bewley Reference Bewley2001; Bänsch et al. Reference Bänsch, Benner, Saak and Weichelt2015; Carini, Pralits & Luchini Reference Carini, Pralits and Luchini2015). However, such control laws derived from linear theory are not able to explore and exploit the nonlinear mechanisms in fluid flows. Also, for real-time fluid flow control, the computational burden is prohibitively large in terms of resources, processing time and data storage, even for simple geometries.
To alleviate the computational concerns, control strategies are built on low-order dynamical models obtained via model reduction (Protas Reference Protas2004; Pinier et al. Reference Pinier, Ausseur, Glauser and Higuchi2007; Barbagallo, Sipp & Schmid Reference Barbagallo, Sipp and Schmid2009; Noack, Morzynski & Tadmor Reference Noack, Morzynski and Tadmor2011) or with the use of system identification techniques (Huang & Kim Reference Huang and Kim2008; Bagheri, Brandt & Henningson Reference Bagheri, Brandt and Henningson2009; Semeraro et al. Reference Semeraro, Bagheri, Brandt and Henningson2011; Illingworth, Morgans & Rowley Reference Illingworth, Morgans and Rowley2012; Brunton, Proctor & Kutz Reference Brunton, Proctor and Kutz2016). Suppressing the large-scale coherent structures in reduced-order models has been shown to mitigate wake unsteadiness, yielding drag reduction in bluff body wake flows (Noack, Tadmor & Morzynski Reference Noack, Tadmor and Morzynski2004; Mao, Blackburn & Sherwin Reference Mao, Blackburn and Sherwin2015). Although these methods offer tremendous promise, there are considerable challenges in modelling the interaction of these coherent structures and frequency cross-talk for higher Reynolds numbers, especially in the context of control (Luchtenburg et al. Reference Luchtenburg, Günther, Noack, King and Tadmor2009). Also, to extract accurate reduced-order models that incorporate nonlinear mechanisms and design control strategies based on them require a high degree of human experience and expertise.
Alternatively, data-driven flow control holds great potential due to advanced algorithms in machine learning, and modern computational hardware (Brunton & Noack Reference Brunton and Noack2015). Using model-free alternatives such as genetic programming, separation control over backward-facing step flow (Gautier et al.
Reference Gautier, Aider, Duriez, Noack, Segond and Abel2015) and sharp edge-ramp (Debien et al.
Reference Debien, von Krbek, Mazellier, Duriez, Cordier, Noack, Abel and Kourta2016) and feedback control of turbulent shear flows (Duriez, Brunton & Noack Reference Duriez, Brunton and Noack2016) have been achieved in an automated fashion. However, these machine learning control techniques are computationally expensive requiring
 $O(1000)$
runs to extract meaningful control laws. Extremum-seeking control has shown the ability to adapt to changing flow conditions (Ariyur & Krstic Reference Ariyur and Krstic2003; Beaudoin et al.
Reference Beaudoin, Cadot, Aider and Wesfreid2006) but offers limited flexibility in design of general control laws, optimizing one or few parameters. For control law representations using artificial neural networks, the number of parameters tends to be very large and their optimization requires significant pre-conditioning (Rabault et al.
Reference Rabault, Kuchta, Jensen, Réglade and Cerardi2019). In the present work, we propose a cluster-based strategy for learning feedback control laws directly from coarse-grained fluid flow data to control post-stall separated flow over a canonical airfoil. These control laws have the ability to adapt to nonlinear response from the flow and are deduced in a model-free and automated fashion, allowing for multi-parameter optimization typically with
 $O(10)$
runs. In general, optimization procedures for flow control requires a large number of iterations, but here it scales with the number of discrete clusters, alleviating computational expense for designing feedback control laws for both simulation and experiments.
The aerodynamic force trajectories are indicators of stall conditions in separated flows. Thus, a small number of force measurements are sufficient to define a feature space without the knowledge of the high-dimensional full flow state. A locally linear mapping of these feature space trajectories can be used to obtain full-state reconstruction of the flow (Loiseau, Noack & Brunton Reference Loiseau, Noack and Brunton2018). Partitioning the feature space into groups sharing similar attributes, called clusters, the system dynamics can be represented as a linear, probabilistic Markov chain (Kaiser et al. Reference Kaiser, Noack, Cordier, Spohn, Segond, Abel, Daviller, Östh, Krajnović and Niven2014). Each cluster corresponds to a characteristic coarse-grained phase of the flow. The transition dynamics between clusters in the feature space translate to the transition between the flow states associated with the clusters. Such a coarse-graining of the feature space into clusters can be applied to incorporate nonlinear control mechanisms. Assigning a control law to each discrete cluster and actively monitoring and sensing the variables of interest enable the feedback control of flows.
In the present work, we consider the use of cluster analysis in a low-dimensional feature space to iteratively optimize global feedback control laws in a computationally tractable manner. The present objectives are three-fold; (i) partition the baseline flow trajectories (force measurements) into discrete clusters using unsupervised clustering analysis, (ii) optimize the feedback control law in a model-free manner using the discretized clusters, and finally (iii) analyse the optimization procedure and the optimal control laws. In contrast to utilizing the cluster-based reduced-order models (CROM) for control (Kaiser et al. Reference Kaiser, Noack, Spohn, Cattafesta and Morzyński2017b , Reference Kaiser, Morzyński, Daviller, Kutz, Brunton and Brunton2018) or manipulating the energy transfer between coherent structures, the current control strategy is primarily based on the notion of diverting the force trajectories to favourable regions in the feature space in an automated and model-free fashion. The baseline linear transition dynamics and the dynamics to achieve desirable flow behaviour with control are only examined a posteriori with the help of networked Markov chains. Previous efforts have primarily focused on deducing optimal or sub-optimal control laws in physical state-space coordinates. Our approach provides a discrete representation of the control law in terms of low-dimensional feature space coordinates, which improves its applicability to both computational and experimental settings.
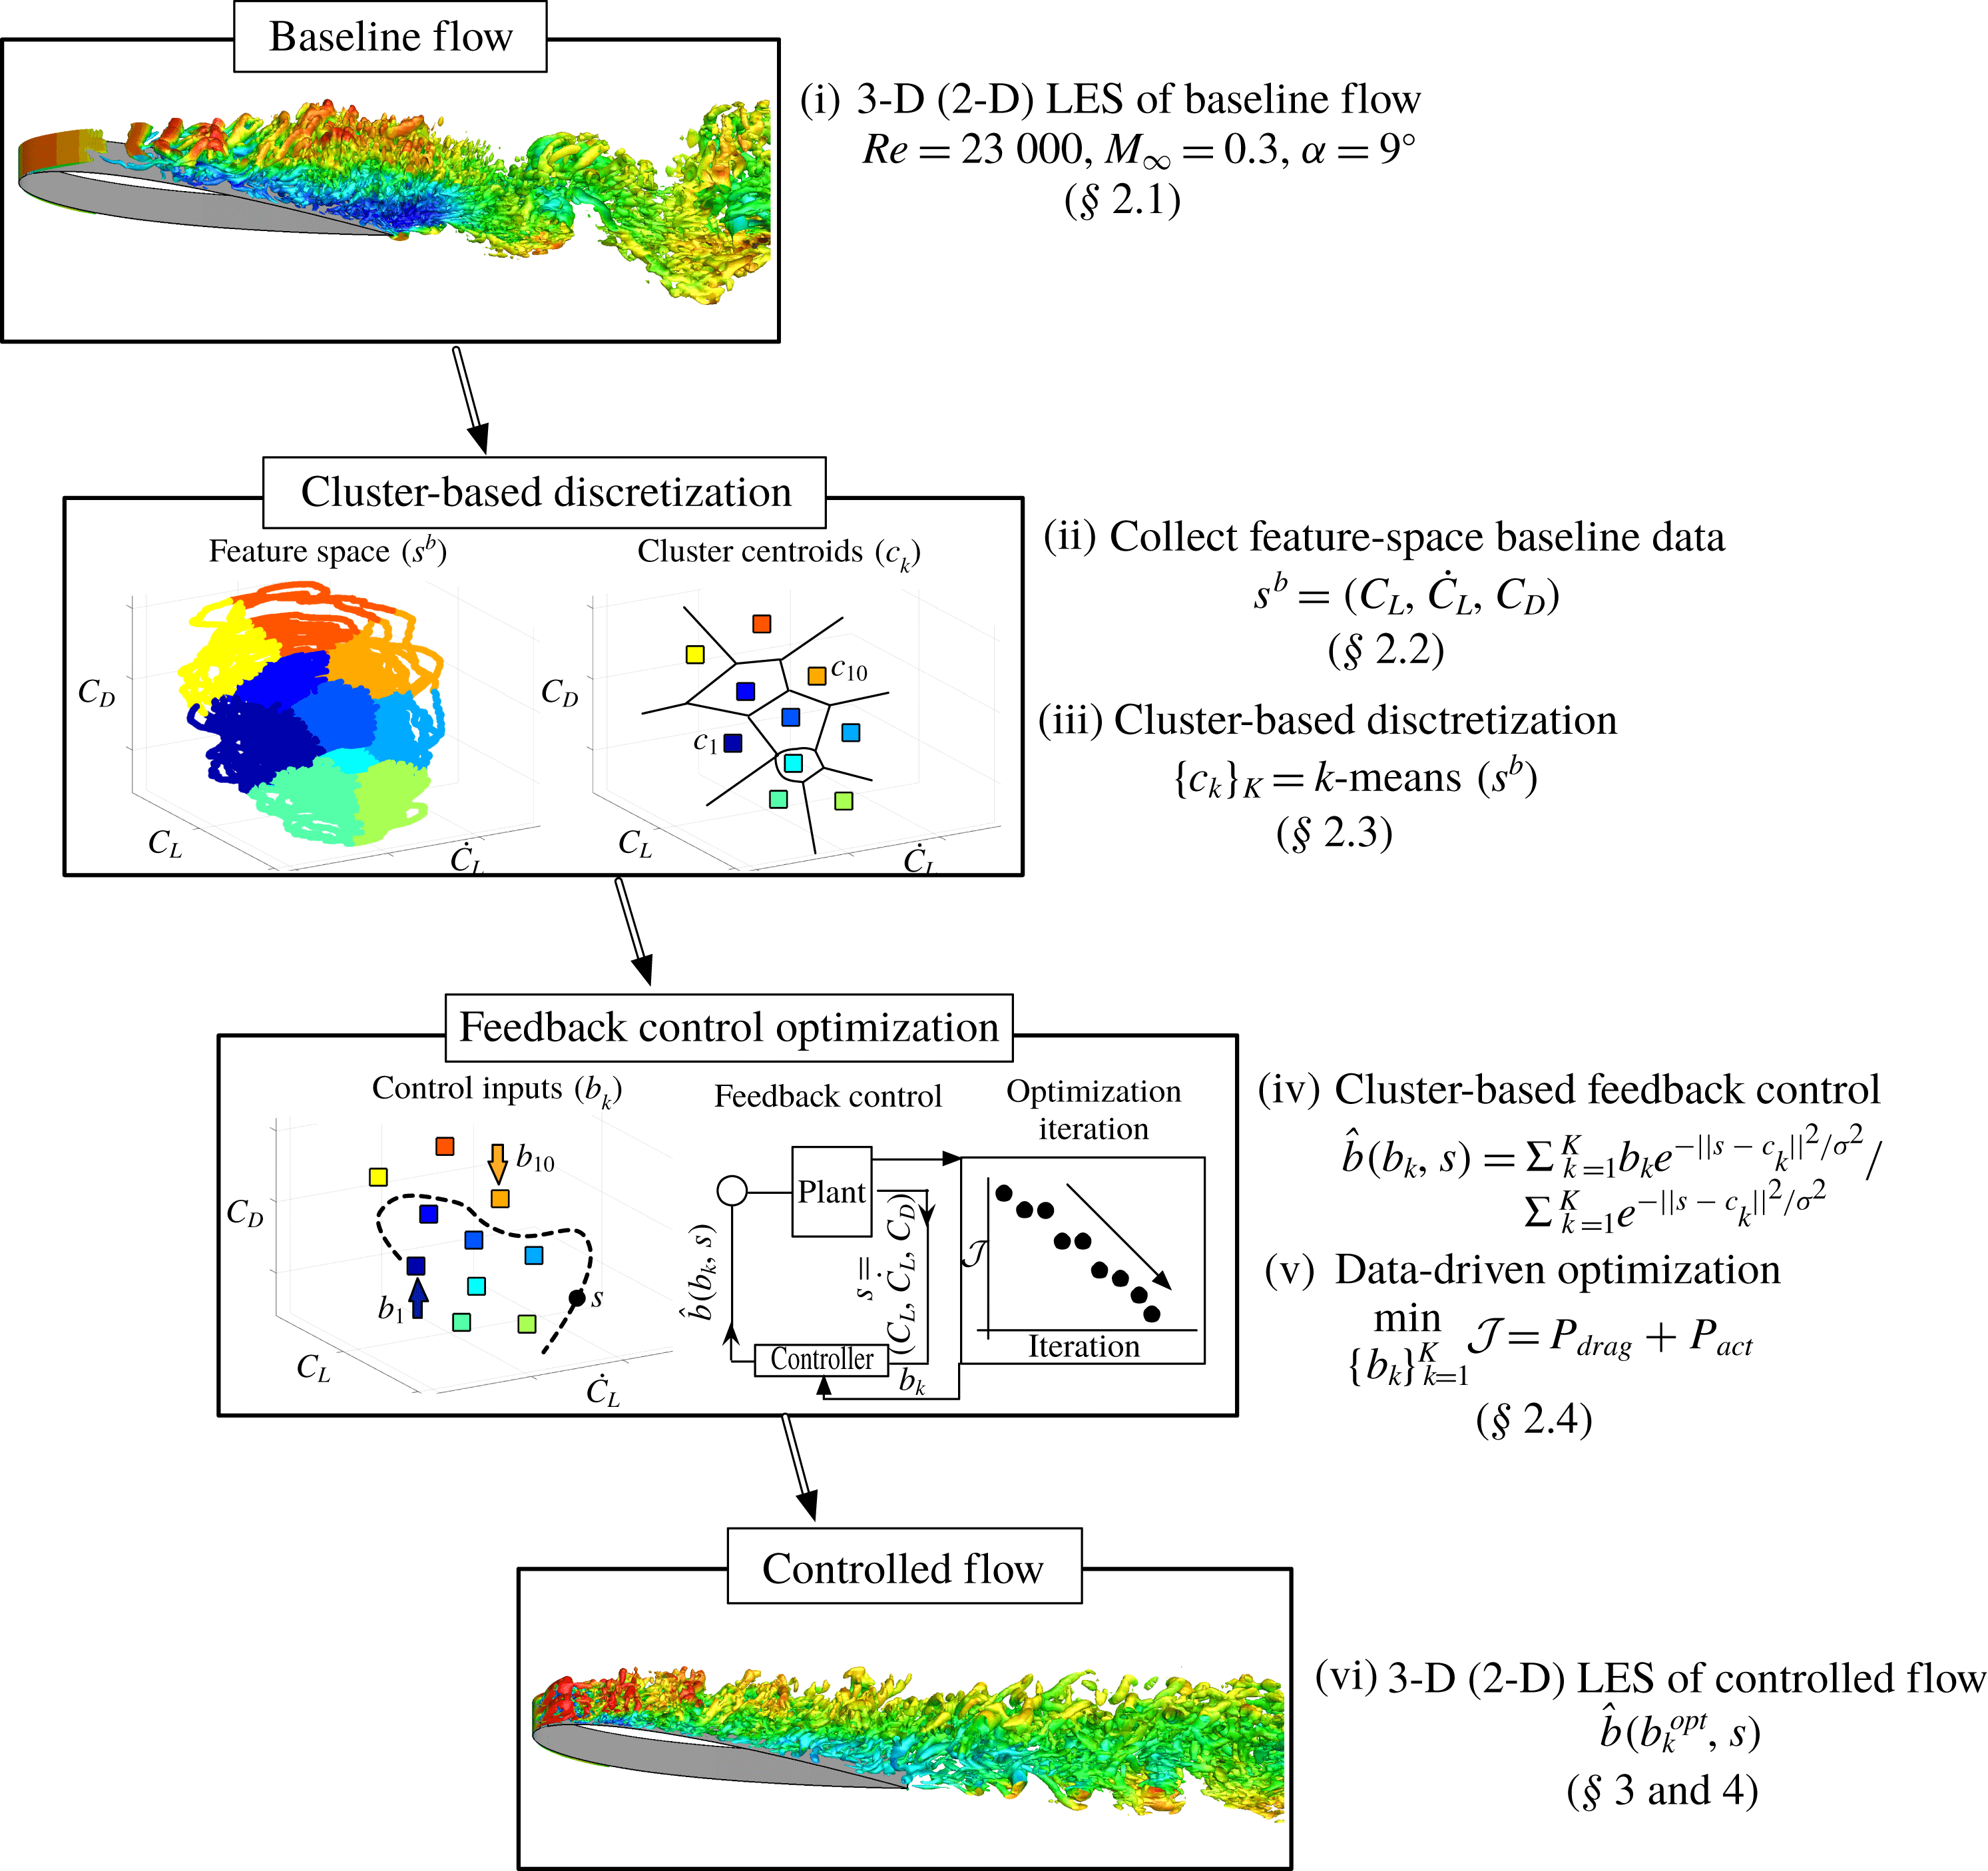
We provide an overview of our approach in figure 1. In § 2.1, we discuss the details of the problem set-up for baseline simulations and the actuator set-up for performing active flow control. To design feedback control laws for separated flows, selection of feature-space trajectories and their discretization into clusters are discussed in §§ 2.2 and 2.3, respectively. Each coarse-grained phase of the flow (e.g. each cluster in feature space) is provided with an associated wall-normal blowing/suction jet velocity input for actuation. The path of the controlled trajectories determines the feedback to the flow, enabling the controller to adapt in time. The details of optimization of cluster-based feedback control laws are outlined in § 2.4. The optimization procedure quickly searches for the optimal actuation in each cluster to minimize power consumption for aerodynamic flight in post-stall flows, thereby improving flight endurance. We note that here efforts are not directed towards developing control strategies for full reattachment of the flow but rather towards routing of flow trajectories to minimize power consumption. We demonstrate the effectiveness of the current approach for two-dimensional (2-D) separated flow over an airfoil in § 3. An extension of the control framework with addition of actuation constraints is then demonstrated for three-dimensional (3-D) separated flow over an airfoil in § 4. At last, concluding remarks are offered in § 5.
Overview of the presented cluster-based control framework.

2 Cluster-based control framework
2.1 Problem set-up
We first discuss the problem set-up for baseline simulations of the separated flows and the actuator set-up for performing control simulations. We consider large eddy simulations (LES) of 2-D and 3-D separated flows over a NACA 0012 airfoil at an angle of attack
 $\unicode[STIX]{x1D6FC}=9^{\circ }$
, with Reynolds number
 $Re=U_{\infty }L_{c}/\unicode[STIX]{x1D708}=23\,000$
and Mach number
 $M_{\infty }=U_{\infty }/a_{\infty }=0.3$
. Here,
 $U_{\infty }$
is the free stream velocity,
 $L_{c}$
is the chord length,
 $\unicode[STIX]{x1D708}$
is the kinematic viscosity and
 $a_{\infty }$
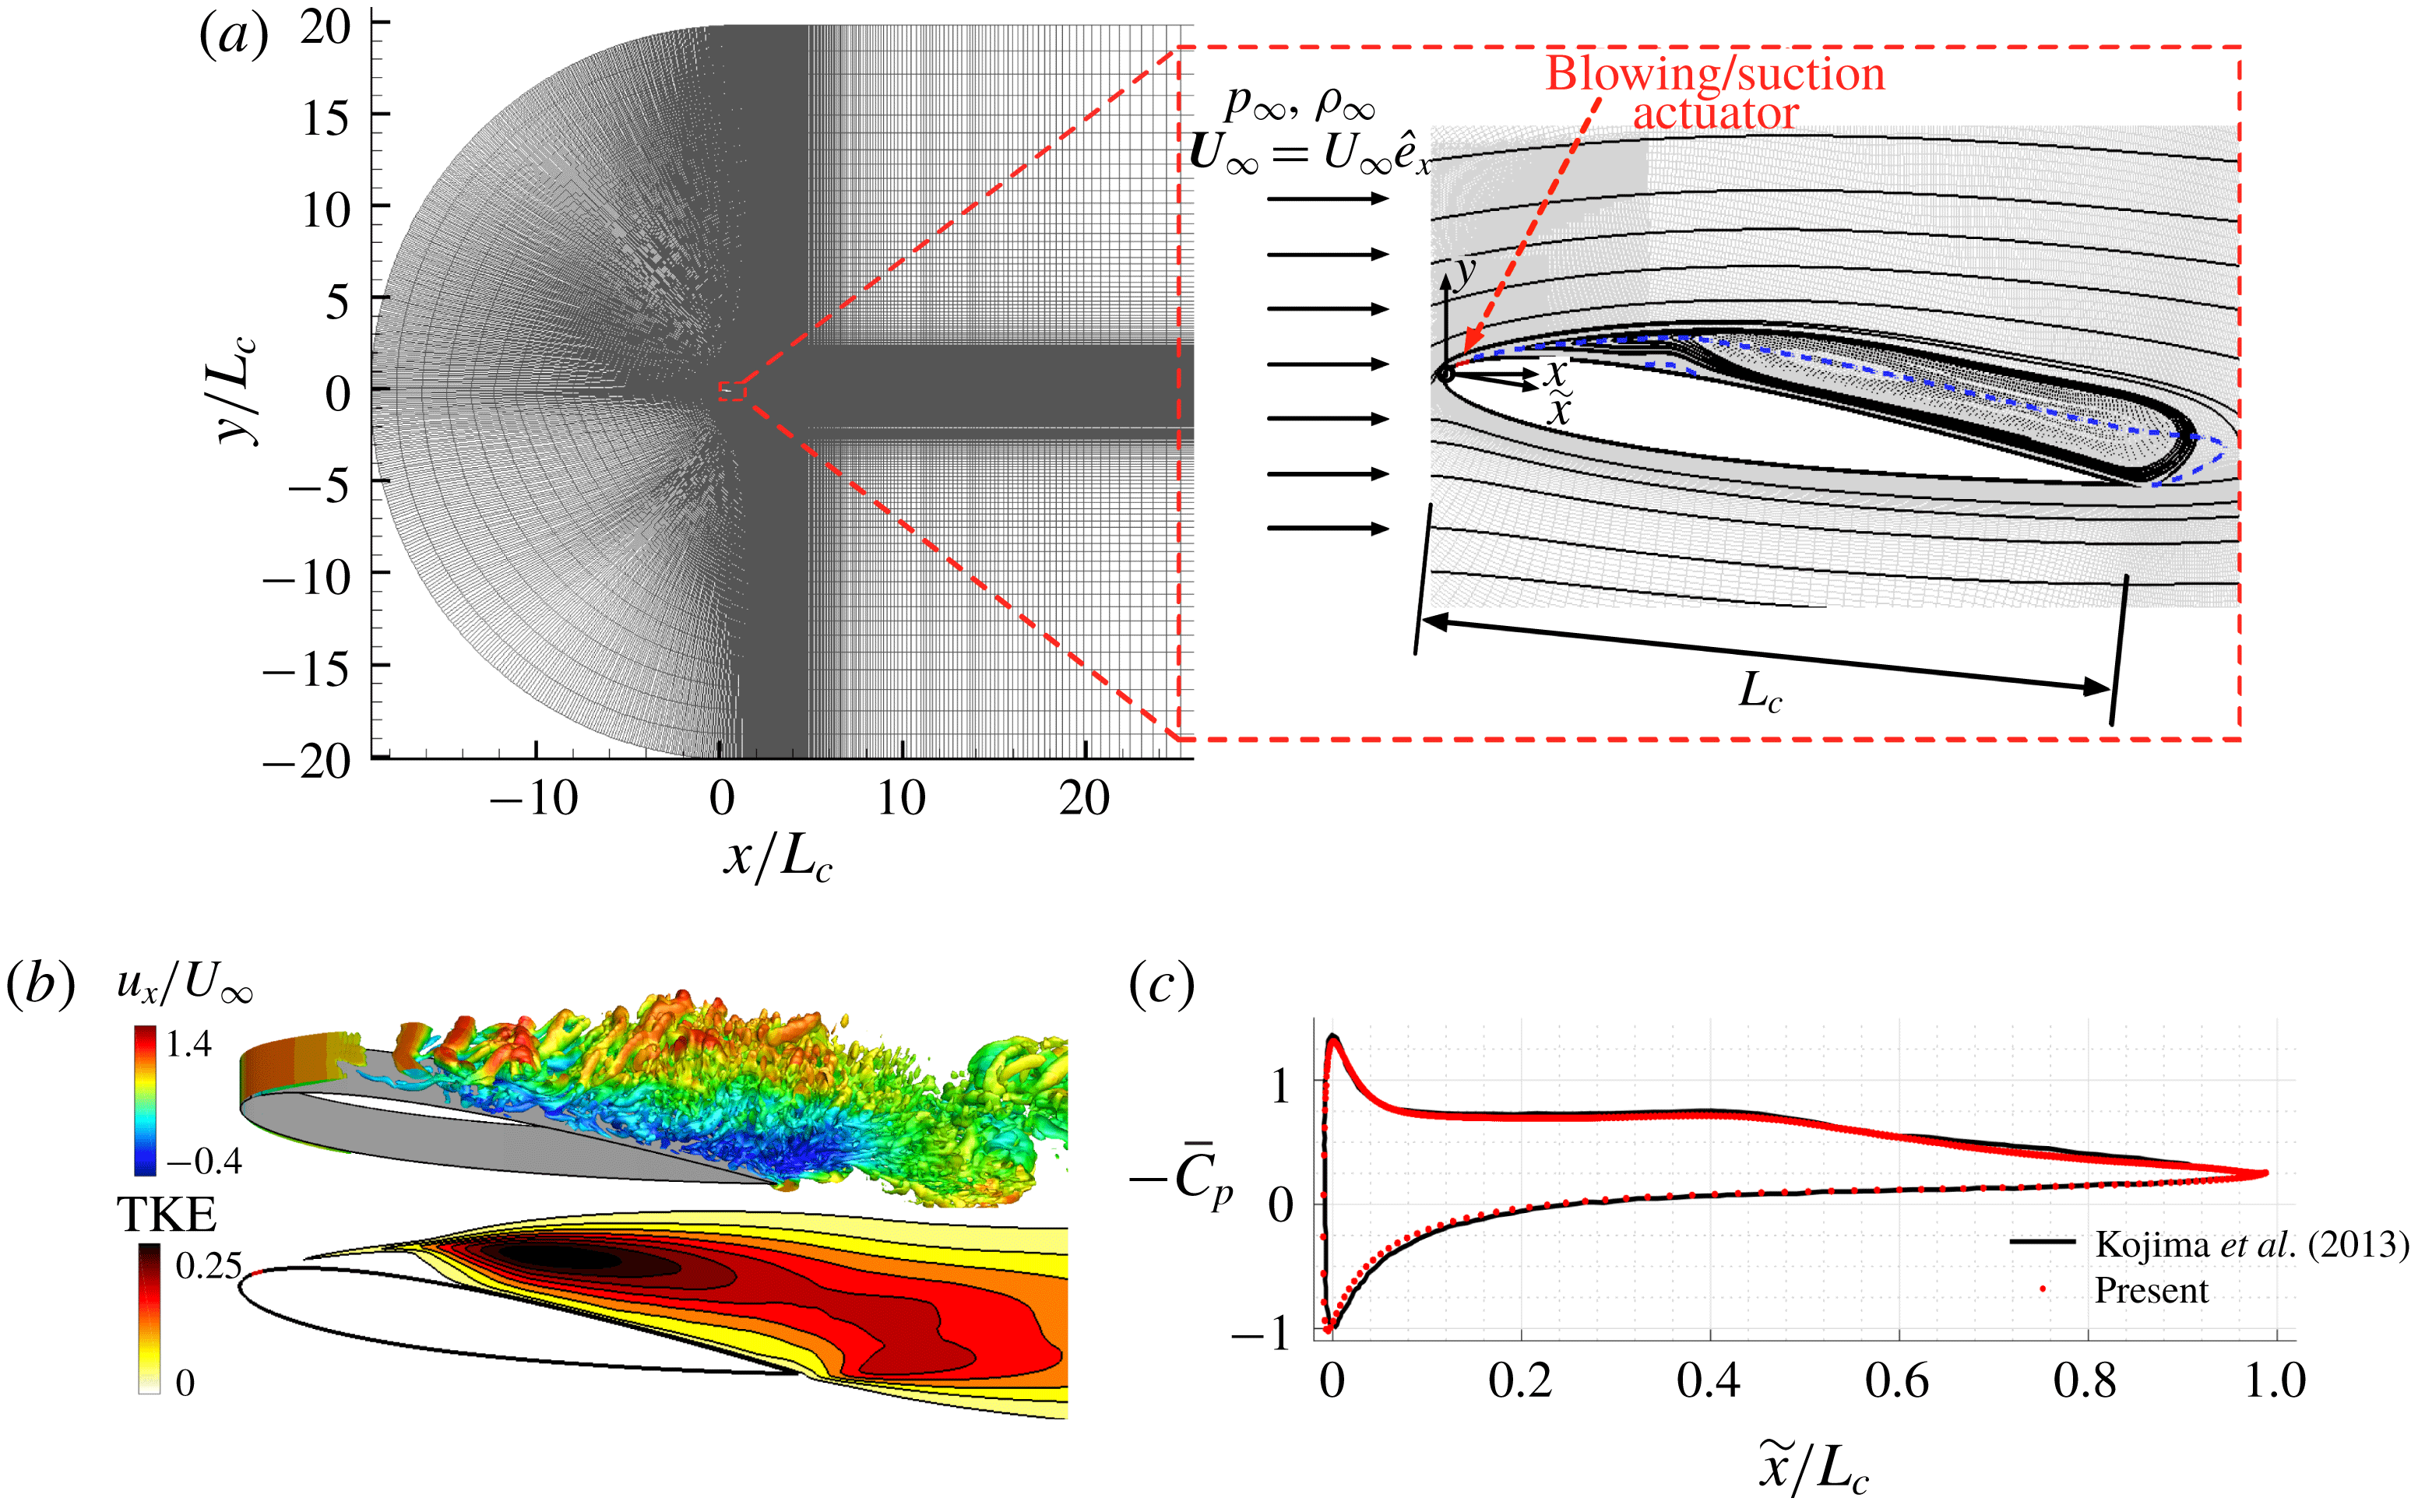
is the free stream speed of sound. The details of the computational set-up, flow visualizations as well as numerical validation, as shown in figures 2(a), 2(b) and 2(c), respectively, are discussed in appendix A.
(a) The
 $x$
–
 $y$
plane of the computational domain (left) and the near field of a NACA 0012 airfoil at
 $\unicode[STIX]{x1D6FC}=9^{\circ }$
(right) with the streamlines for 3-D spanwise-periodic baseline flow. The actuator location is indicated in red. The blue dashed line shows the contour line for
 $\bar{u}_{x}/U_{\infty }=0$
. (b) Instantaneous flow field (highlighted by Q-criterion) coloured by streamwise velocity and turbulent kinetic energy (TKE). (c) Time-averaged coefficient of pressure distributions on suction and pressure surfaces of the airfoil for 3-D baseline flow.

To perform flow control, a blowing/suction actuator is centred at
 $x_{a}/L_{c}=0.03$
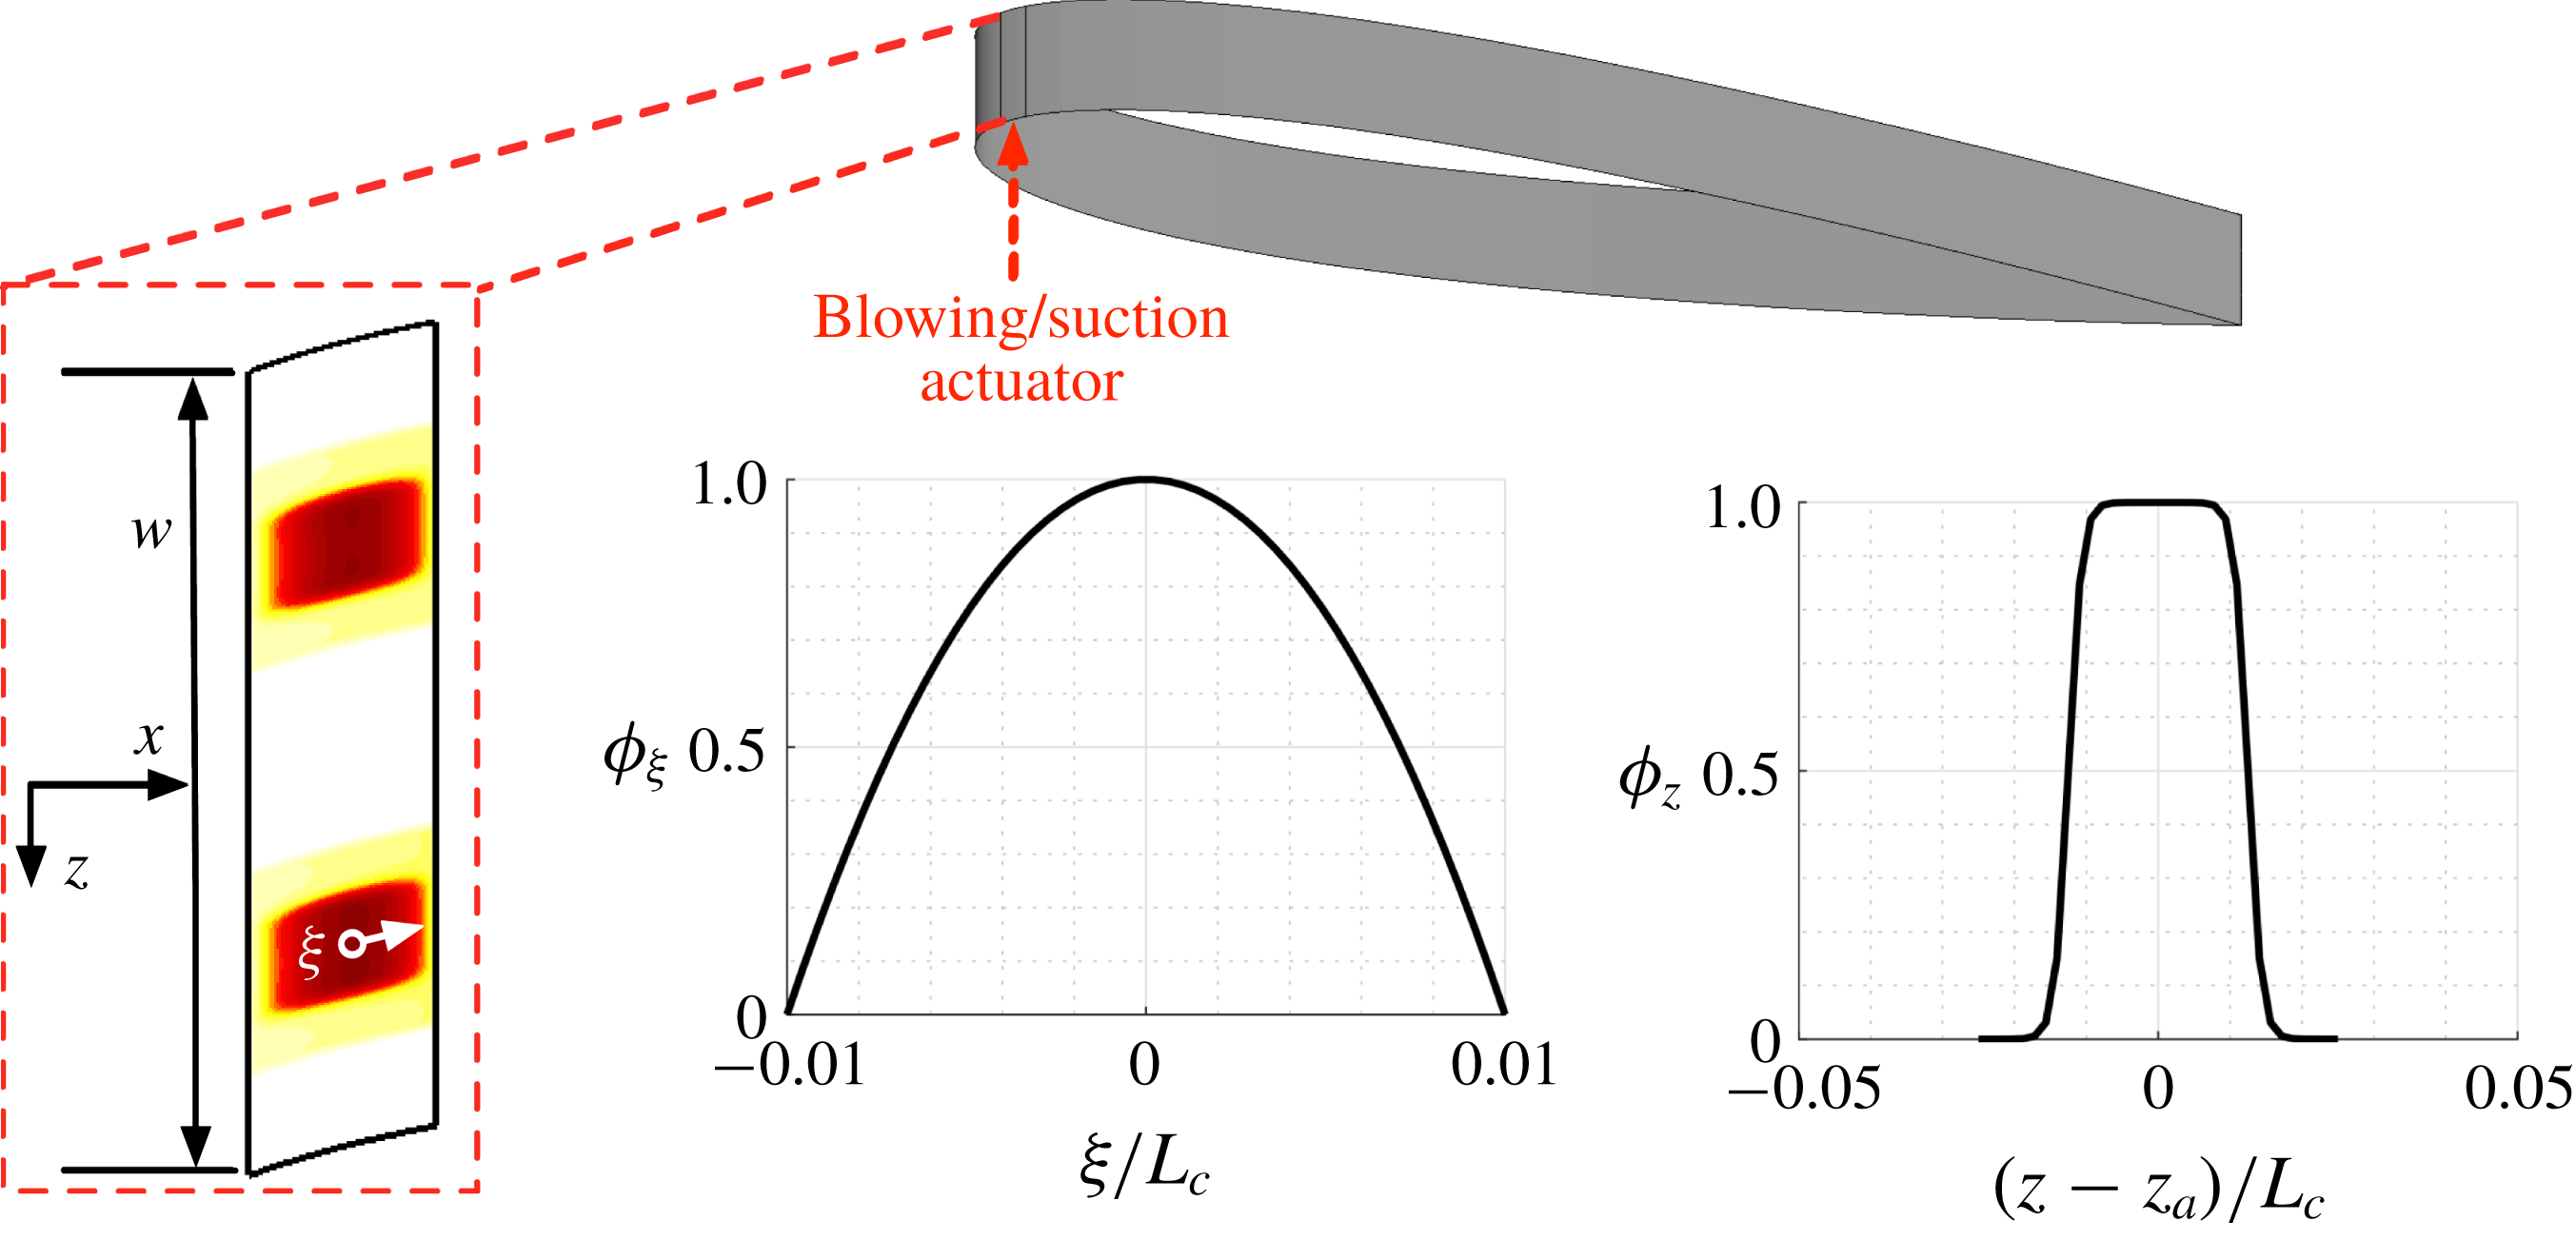
(upstream of the time-averaged separation point) in the streamwise direction on the suction side of the airfoil, as shown by red surface in figure 2(a) (right). The actuator set-up is further elaborated in figure 3. Let
 $\unicode[STIX]{x1D709}$
be the surface tangential direction from the actuator centre. The actuator width is
 $2\unicode[STIX]{x1D709}_{a}=0.02L_{c}$
. A wall-normal velocity component (
 $u_{jet}$
) with a parabolic spatial profile
 $(\unicode[STIX]{x1D719}_{\unicode[STIX]{x1D709}})$
is prescribed as an actuator velocity boundary condition to impose blowing/suction. For 3-D flow control, two actuator slots are placed in the spanwise direction, each centred at
 $z_{a}/L_{c}=-0.05$
and
 $0.05$
, respectively, with a width of
 $0.025L_{c}$
, similar to the work by Munday & Taira (Reference Munday and Taira2018). A hyperbolic tangent function
 $(\unicode[STIX]{x1D719}_{z})$
is used for the spanwise jet velocity profile to smoothen out the velocity discontinuity at the edge of the slots. The wall-normal velocity is prescribed as
 $$\begin{eqnarray}u_{jet}(t)=b(s(t))~\unicode[STIX]{x1D719}_{\unicode[STIX]{x1D709}}(\unicode[STIX]{x1D709})\unicode[STIX]{x1D719}_{z}(z),\end{eqnarray}$$
where
 $b$
is the forcing amplitude which is dependent on the flow state variable
 $s$
. For the selection of the flow state variable
 $s$
and the forcing amplitude
 $b$
, we describe the procedure below.
The blowing/suction actuator set-up for 3-D flow control with velocity profiles in the surface tangential
 $(\unicode[STIX]{x1D719}_{\unicode[STIX]{x1D709}})$
and spanwise
 $(\unicode[STIX]{x1D719}_{z})$
directions.

2.2 Feature space selection
A comprehensive understanding of the flow behaviour requires the knowledge of the full state (e.g. velocity field). However, the use of such high-dimensional full-state information is prohibitively expensive and in most cases, experimentally unobtainable, especially for feedback control design. A clever choice of a limited number of observables, called feature space variables, are needed to assess the flow behaviour. One possible choice of feature space variables are temporal dynamics associated with the proper orthogonal decomposition (POD) modes. However, such a choice may be sensitive to the number of physically relevant modes used to characterize the feature space. Also, these modes are incapable of describing dynamics in regimes of flow where no snapshots are collected, which pose challenges to feedback control design.
A natural consequence of flow separation is an increase in drag force. The shift in the mean flow is generally captured by the drag coefficient (Noack et al.
Reference Noack, Afanasiev, Morzyński, Tadmor and Thiele2003; Taira & Nakao Reference Taira and Nakao2018). Also, stall conditions result in a sudden loss of lift. For low-Reynolds-number bluff-body flows, the lift coefficient
 $C_{L}$
and its time derivative
 ${\dot{C}}_{L}$
characterize the limit cycle of unsteady oscillations. We use this reduced number of observables to define a three-dimensional feature set denoted by
 $s=s(t)=(C_{L}(t),{\dot{C}}_{L}(t),C_{D}(t))$
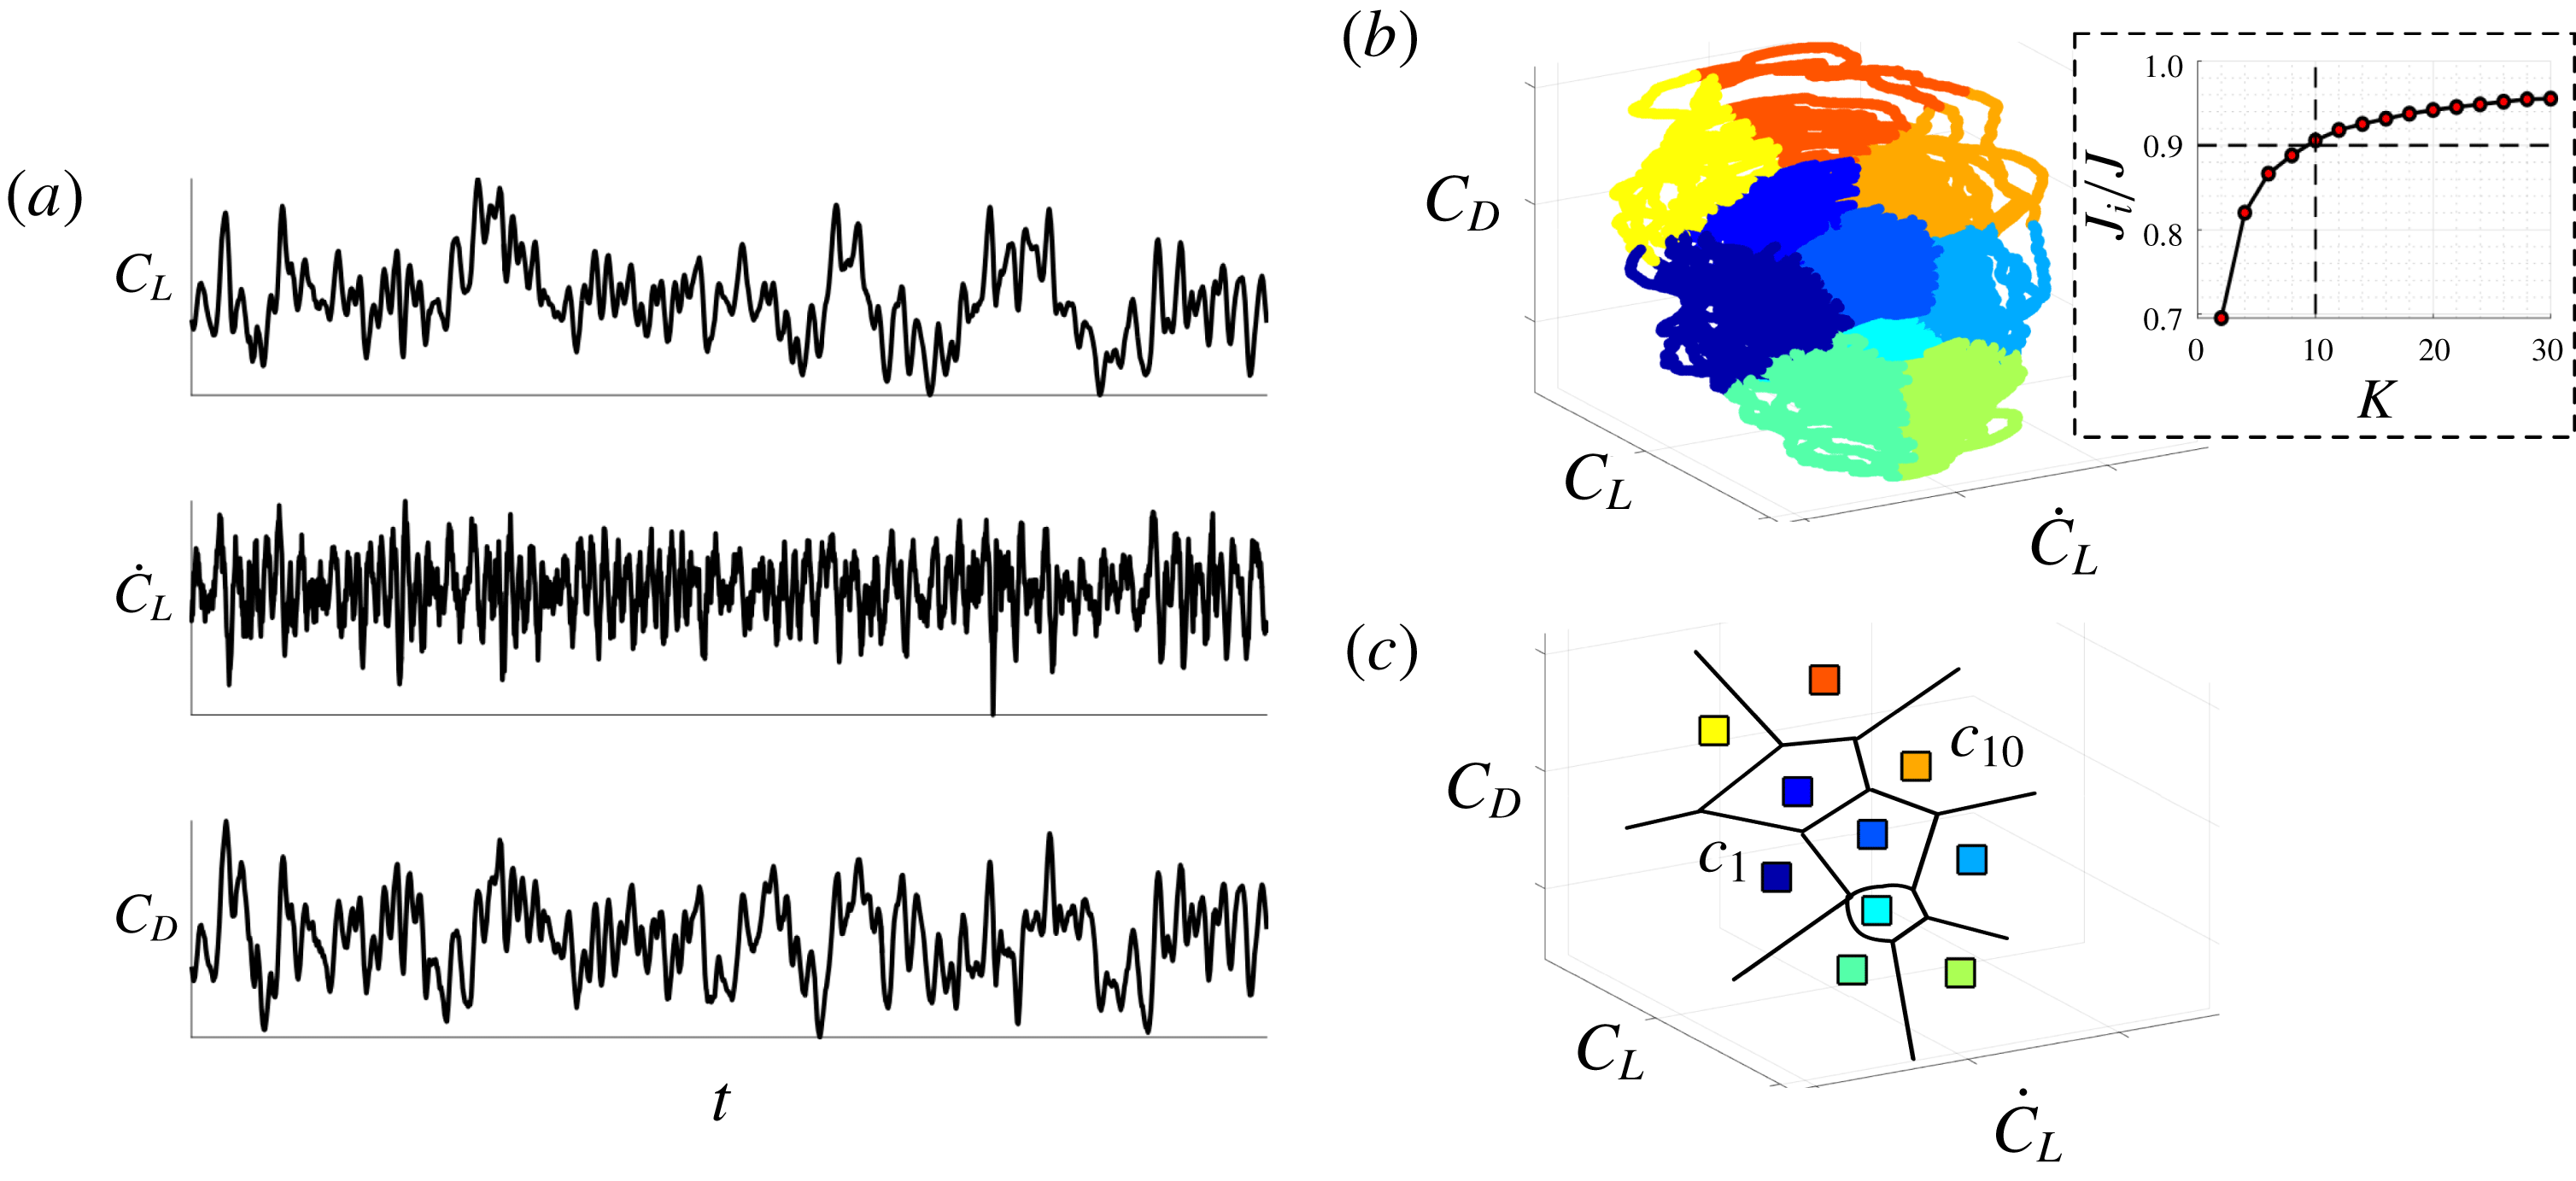
as shown in figure 4(a).
2.3 Cluster-based discretization
We use cluster analysis (Rokach & Maimon Reference Rokach and Maimon2005) to discretize or coarse-grain the feature space of baseline trajectories with common characteristics into clusters. The clustering groups the flow states with similar aerodynamic characteristics, e.g. high-drag states and low-drag states of the flow. One of the most popular centroid-based clustering technique is the
 $k$
-means algorithm (Lloyd Reference Lloyd1982) which is an unsupervised classification algorithm where observations are partitioned into
 $K$
representative clusters
 $\{{\mathcal{C}}_{k}\}_{k=1}^{K}$
. Each set of observations belonging to a cluster
 ${\mathcal{C}}_{k}$
is represented by its corresponding cluster centroid
 $c_{k}$
, which is computed as the mean over all observations belonging to this cluster. These cluster centroids reduce the number of degrees of freedom in the feature space.
For a set of cluster-based centroids
 $\{c_{k}\}_{k=1}^{K}$
, the within-cluster variance (
 $J_{w}$
) and the inter-cluster variance (
 $J_{i}$
), as defined in the work by Goutte et al. (Reference Goutte, Toft, Rostrup, Nielsen and Hansen1999), are given by
 $$\begin{eqnarray}J_{w}=\frac{1}{N}\mathop{\sum }_{k=1}^{K}\mathop{\sum }_{s^{b}\in {\mathcal{C}}_{k}}\Vert s^{b}-c_{k}\Vert ^{2}\quad \text{and}\quad J_{i}=\frac{1}{N}\mathop{\sum }_{k=1}^{K}N_{k}\Vert c_{k}-\bar{c}\Vert ^{2}.\end{eqnarray}$$
Here, the superscript
 $b$
denotes the baseline flow,
 $N$
is the total number of measurements in the baseline trajectory and
 $N_{k}$
is the number of measurements present in cluster
 ${\mathcal{C}}_{k}$
. The cluster centroid and centroid of the entire trajectory are given by
 $c_{k}\equiv (1/N_{k})\sum _{s^{b}\in {\mathcal{C}}_{k}}s^{b}$
and
 $\bar{c}=(1/N)\sum _{k=1}^{K}N_{k}c_{k}$
, respectively.
Given an ensemble of observations in terms of a baseline flow trajectory
 $s^{b}(t)$
, the optimal set of cluster-based centroids
 $\{c_{k}\}_{k=1}^{K}$
is obtained by solving an optimization problem that minimizes the within-cluster variance
 $$\begin{eqnarray}(c_{1},\ldots ,c_{K})=\text{arg}\,\text{min}_{{\mathcal{C}}}J_{w}.\end{eqnarray}$$
This yields a set of
 $K$
clusters,
 ${\mathcal{C}}=\{{\mathcal{C}}_{1},\ldots ,{\mathcal{C}}_{K}\}$
, each with a centroidal representative state
 $c_{k}$
. The cluster-based discretization of the feature space and the corresponding centroids for
 $K=10$
clusters are shown in figures 4(b) and 4(c), respectively. In the work of Kaiser et al. (Reference Kaiser, Noack, Cordier, Spohn, Segond, Abel, Daviller, Östh, Krajnović and Niven2014), this has led to a CROM by modelling the transitions as a Markov process (Norris Reference Norris1998).
A schematic of the clustering procedure; (a) Time-series of baseline trajectory
 $s^{b}(t)=(C_{L}(t),{\dot{C}}_{L}(t),C_{D}(t))$
collected from baseline LES. (b) Cluster-based discretization of the feature space and (c) corresponding cluster centroids using
 $k$
-means clustering algorithm. Inset in (b) shows the ratio of inter-cluster variance to total variance used to determine the number of clusters
 $K=10$
.

A trade-off between complexity of the cluster-based representation and data compression determines an optimal choice of the number of clusters
 $K$
(Chiang & Mirkin Reference Chiang and Mirkin2010). We determine the appropriate number of clusters
 $K$
using an elbow method or the F-test (Lomax & Hahs-Vaughn Reference Lomax and Hahs-Vaughn2013). The F-test uses the ratio of inter-cluster variance
 $J_{i}$
to the total variance
 $J=J_{i}+J_{w}$
, which is typically maximized. We show the typical variation of
 $J_{i}/J$
with increasing number of clusters in the inset of figure 4(b). We choose
 $J_{i}/J\geqslant 0.9$
for the present analysis as the gain in inter-cluster variance is relatively slow thereafter. Based on this choice, each dataset of trajectories for the 2-D and 3-D baseline flows are partitioned into
 $K=10$
clusters. Thus, the purpose of the F-test is to resolve at least
 $90\,\%$
of the flow fluctuations after the cluster-coarse graining. Other metrics like gap statistics (Tibshirani, Walther & Hastie Reference Tibshirani, Walther and Hastie2001), based on a similar notion, could also be used to decide on an appropriate choice of the number of clusters. With this clustered feature space discretization, we discuss our flow control design below.
2.4 Optimized feedback control design
Now that the feature space is defined and cluster analysis is performed, we are ready to define the feedback control law
 $b(t)$
. We parameterize each cluster centroid with an actuation value, i.e. each cluster
 ${\mathcal{C}}_{k}$
with its associated centroid
 $c_{k}$
is assigned a chosen constant control amplitude
 $b_{k}$
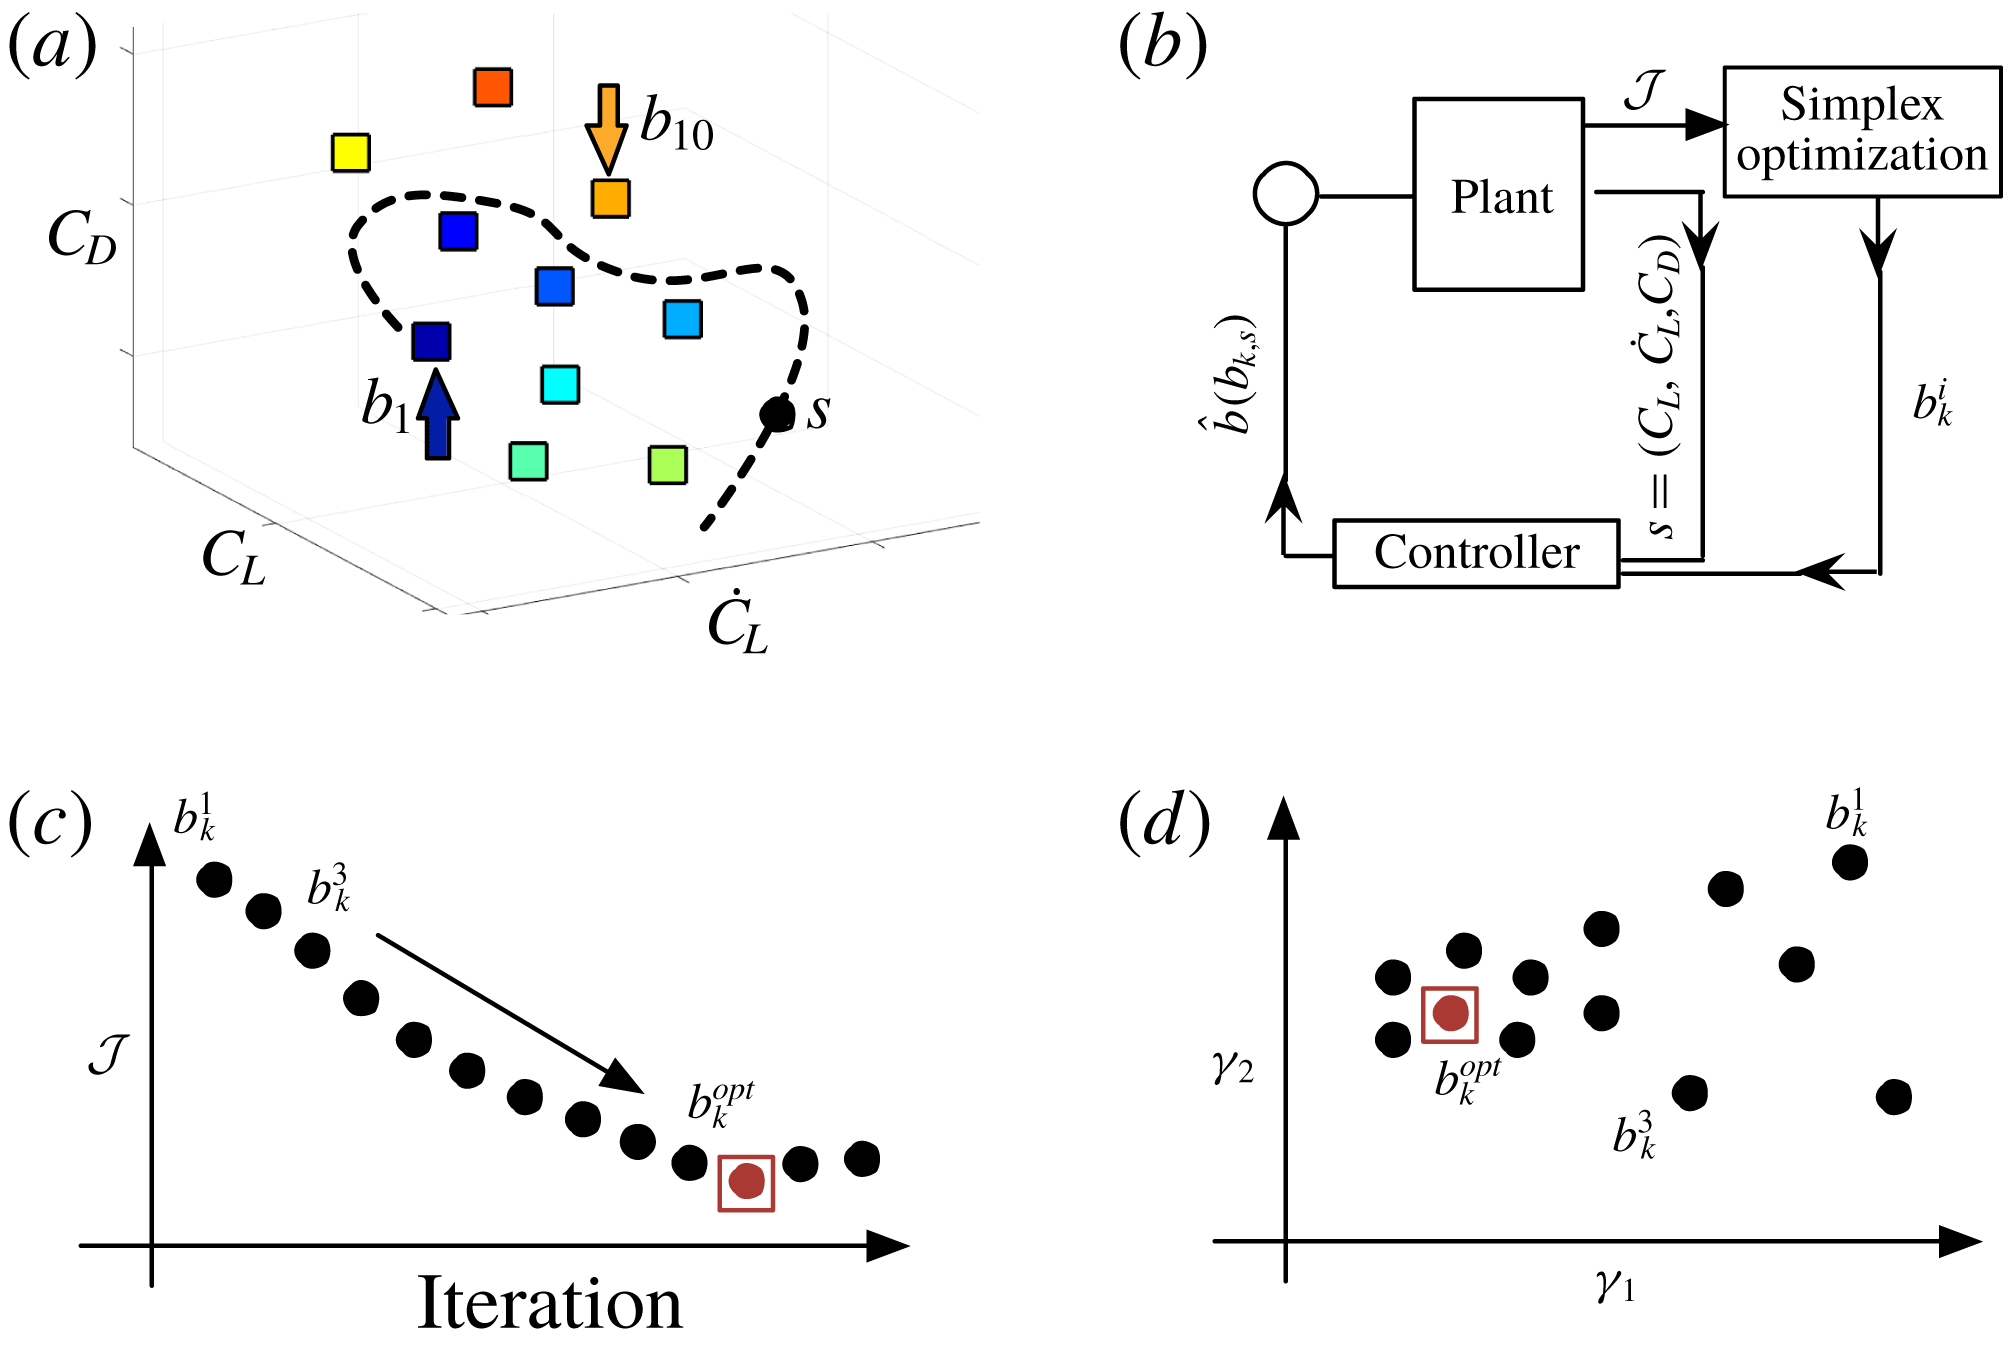
as shown in figure 5(a). This provides a blowing/suction jet velocity for each cluster. These cluster control amplitudes are then interpolated over the feature space using a normalized radial basis kernel (Wand & Jones Reference Wand and Jones1994). The forcing amplitude
 $b$
as required in equation (2.1) is defined as
 $$\begin{eqnarray}b(b_{k},s(t))=\unicode[STIX]{x1D6FD}\frac{\displaystyle \mathop{\sum }_{k=1}^{K}b_{k}\text{e}^{-\Vert s(t)-c_{k}\Vert ^{2}/J_{i}}}{\displaystyle \mathop{\sum }_{k=1}^{K}\text{e}^{-\Vert s(t)-c_{k}\Vert ^{2}/J_{i}}},\end{eqnarray}$$
where
 $\unicode[STIX]{x1D6FD}$
is the feedback gain which is set to unity, unless otherwise noted. The flow control is implemented as a proportional feedback controller depending on the current state in the feature space
 $s(t)$
as shown in figure 5(b).
The schematic of the optimization procedure for cluster-based feedback control. (a) Control inputs assigned to cluster centroids. (b) Feedback control configuration and (c) simplex search to find optimized control law minimizing cost function
 ${\mathcal{J}}$
. (d) Visualization of all the control cases on a two-dimensional proximity map
 $(\unicode[STIX]{x1D6FE}_{1},\unicode[STIX]{x1D6FE}_{2})$
using multi-dimensional scaling.

The only remaining consideration is the choice of the control amplitudes
 $\{b_{k}\}_{k=1}^{K}$
. These cluster control amplitudes are iteratively optimized to minimize a cost function consisting of both state and control variables. For optimized control, we need to minimize the sum of the aerodynamic power loss (
 $P_{drag}$
) and the actuation power input (
 $P_{act}$
) leading to an objective function
 ${\mathcal{J}}=P_{drag}+P_{act}$
. The aerodynamic power is the power required by the system to overcome drag. Let
 $W$
and
 $V$
be the weight and speed of the flying vehicle, respectively. We can define
 $V=\sqrt{W/\frac{1}{2}\unicode[STIX]{x1D70C}C_{L}A}$
. The aerodynamic power can then be evaluated as
 $$\begin{eqnarray}P_{drag}=\frac{F_{x}V}{\frac{1}{2}\unicode[STIX]{x1D70C}U_{\infty }^{3}A}=\frac{\frac{1}{2}\unicode[STIX]{x1D70C}C_{D}V^{3}A}{\frac{1}{2}\unicode[STIX]{x1D70C}U_{\infty }^{3}A}=\frac{C_{D}}{U_{\infty }^{3}}\left(\frac{W}{\frac{1}{2}\unicode[STIX]{x1D70C}C_{L}A}\right)^{3/2}=\unicode[STIX]{x1D702}\frac{C_{D}}{C_{L}^{3/2}},\end{eqnarray}$$
where
 $\unicode[STIX]{x1D702}=(W/\frac{1}{2}\unicode[STIX]{x1D70C}U_{\infty }^{2}A)^{3/2}$
. At cruise (steady) condition, lift is equal to the weight of the flying vehicle
 $W$
. Maximum endurance of flight can be obtained by minimizing aerodynamic power. This minimum energy expenditure occurs when
 $C_{D}/C_{L}^{3/2}$
is at its minimum (Anderson Reference Anderson1999). To extract the aerodynamically favourable gain with control, we set the aerodynamic power to the baseline drag power for the unforced case by considering
 $\unicode[STIX]{x1D702}=\overline{C}_{L}^{3/2}$
, where
 $\overline{C}_{L}$
is the mean baseline lift. It must be noted that the emphasis of this work is in minimizing the drag power and any benefit from lift force is weighed according to the scaling derived in equation (2.5) to maximize flight endurance.
The unsteady actuation power is related to the momentum injected to the fluid as
 $$\begin{eqnarray}P_{act}=\frac{2}{TU_{\infty }^{3}A}\int _{0}^{T}\int _{-w/2}^{w/2}\int _{-\unicode[STIX]{x1D709}_{a}}^{\unicode[STIX]{x1D709}_{a}}|u_{jet}|^{3}\,\text{d}\unicode[STIX]{x1D709}\,\text{d}z\,\text{d}t,\end{eqnarray}$$
where
 $T$
is the finite time horizon of application of control. The time-averaged momentum coefficient corresponding to this actuation power is
 $$\begin{eqnarray}\overline{C}_{\unicode[STIX]{x1D707}}=\frac{2}{TU_{\infty }^{2}A}\int _{0}^{T}\int _{-w/2}^{w/2}\int _{-\unicode[STIX]{x1D709}_{a}}^{\unicode[STIX]{x1D709}_{a}}|u_{jet}|^{2}\,\text{d}\unicode[STIX]{x1D709}\,\text{d}z\,\text{d}t.\end{eqnarray}$$
To determine the optimized cluster control amplitudes, we utilize the simplex search algorithm (Nelder & Mead Reference Nelder and Mead1965), which is a gradient-free multidimensional unconstrained optimization technique. This iteratively optimizes the cluster-based control amplitudes
 $\{b_{k}^{i}\}_{k=1}^{K}$
which are the inputs to the feedback controller shown in figure 5(b). The superscript
 $i$
indicates the iteration number of control case. The procedure for optimization is outlined below.
(i) To start the iterative optimization, we incorporate a Latin-hypercube sampling of the parametric space of
 $N_{b}\times K$
control amplitudes for the initial simplex. This leads to a near-random sample of parameter values from a multidimensional distribution (McKay, Beckman & Conover Reference McKay, Beckman and Conover2000). As our goal is to determine
$K$
optimized cluster control amplitudes, we define an initial simplex of
$N_{b}=K+1$
vertices. In the work, as
$K=10$
, the initial simplex includes
$110$
parameters.
(ii) Each vertex of the simplex is evaluated with a controlled LES over a finite-time horizon
$T$
, each with a unique set of
$K$
cluster control amplitudes to define
$b(t)$
in equation (2.4). This time horizon is chosen as multiples of the characteristic time period, derived from the shedding frequency
$St=fL_{c}\sin (\unicode[STIX]{x1D6FC})/U_{\infty }$
of the flow.(iii) Once the initial
$N_{b}$
control cases are simulated and the objective function
${\mathcal{J}}$
for each case is evaluated, the simplex search algorithm performs reflection, expansion, contraction and shrinkage on the cluster control amplitudes to minimize the objective function
${\mathcal{J}}$
. These operations quickly span the search space of cluster amplitudes to find the optimized control law.(iv) The optimization procedure is terminated when the standard deviation of the currently evaluated simplex is less than a set tolerance of
$\unicode[STIX]{x1D716}=0.004$
.


Ultimately, a choice of cluster control amplitudes
 $\{b_{k}^{opt}\}_{k=1}^{K}$
results in a minimal
 ${\mathcal{J}}$
, maximizing flight endurance. We call this case the optimized control case based on the set tolerance. We note here that all the cluster control amplitudes
 $\{b_{k}^{opt}\}_{k=1}^{K}$
are simultaneously optimized and a separate optimization for the control law in each cluster is not needed. Although strict convergence bounds are difficult to obtain for the simplex search procedure, the set tolerance is typically achieved within
 $O(K)$
control simulations, as will be seen in §§ 3 and 4. A schematic of simplex optimization is shown in figure 5(c). The similarity between the iteratively evaluated control laws can be summarized by extracting proximity maps. The proximity maps visualize the control landscapes over an identified subspace,
 $(\unicode[STIX]{x1D6FE}_{1},\unicode[STIX]{x1D6FE}_{2})$
, as shown figure 5(d). The relative position of the control law in the subspace give an indication of their similarity. The multidimensional scaling (MDS) technique used to extract such maps are further discussed in appendix B.
Unlike other control strategies which require either the linearized Navier–Stokes equations or reduced-order models, the present framework deduces optimized control laws in a model-free and data-based manner. The clustering analysis and optimization just require the information of force measurements as inputs to the algorithms. Thus, the approach is easily extendable to experiments. We demonstrate the optimization of cluster control amplitudes for the 2-D separated flow in the following section. We then extend the approach to find cluster-based control laws for 3-D separated flows, for which the associated computational cost and complexity of flow control is manageable but increases significantly.
3 Control of 2-D separated flow over an airfoil
In this section, we demonstrate the cluster-based feedback control optimization for a 2-D flow over an airfoil to maximize performance. In particular, we first present the clustering results, based on data from the baseline flow in § 3.1, that are employed to partition the feature space and provides the foundation for optimizing the control laws. We then demonstrate how the coarse-grained control law is optimized in § 3.2. The iterative optimization procedure is further analysed using proximity maps. The resulting change in dynamics with control is examined using the Markov transition models.
3.1 Baseline feature space clustering
In post-stalled configurations, a strong adverse pressure gradient due to separation causes a large increase in the associated pressure drag, thereby increasing the pressure losses and enlarging the size of the wake. Using a cluster-based analysis, we identify characteristic phases of the flow associated with these losses. For the analysis, time-series data of baseline trajectories
 $s^{b}(t)$
are partitioned into
 $K=10$
clusters using the
 $k$
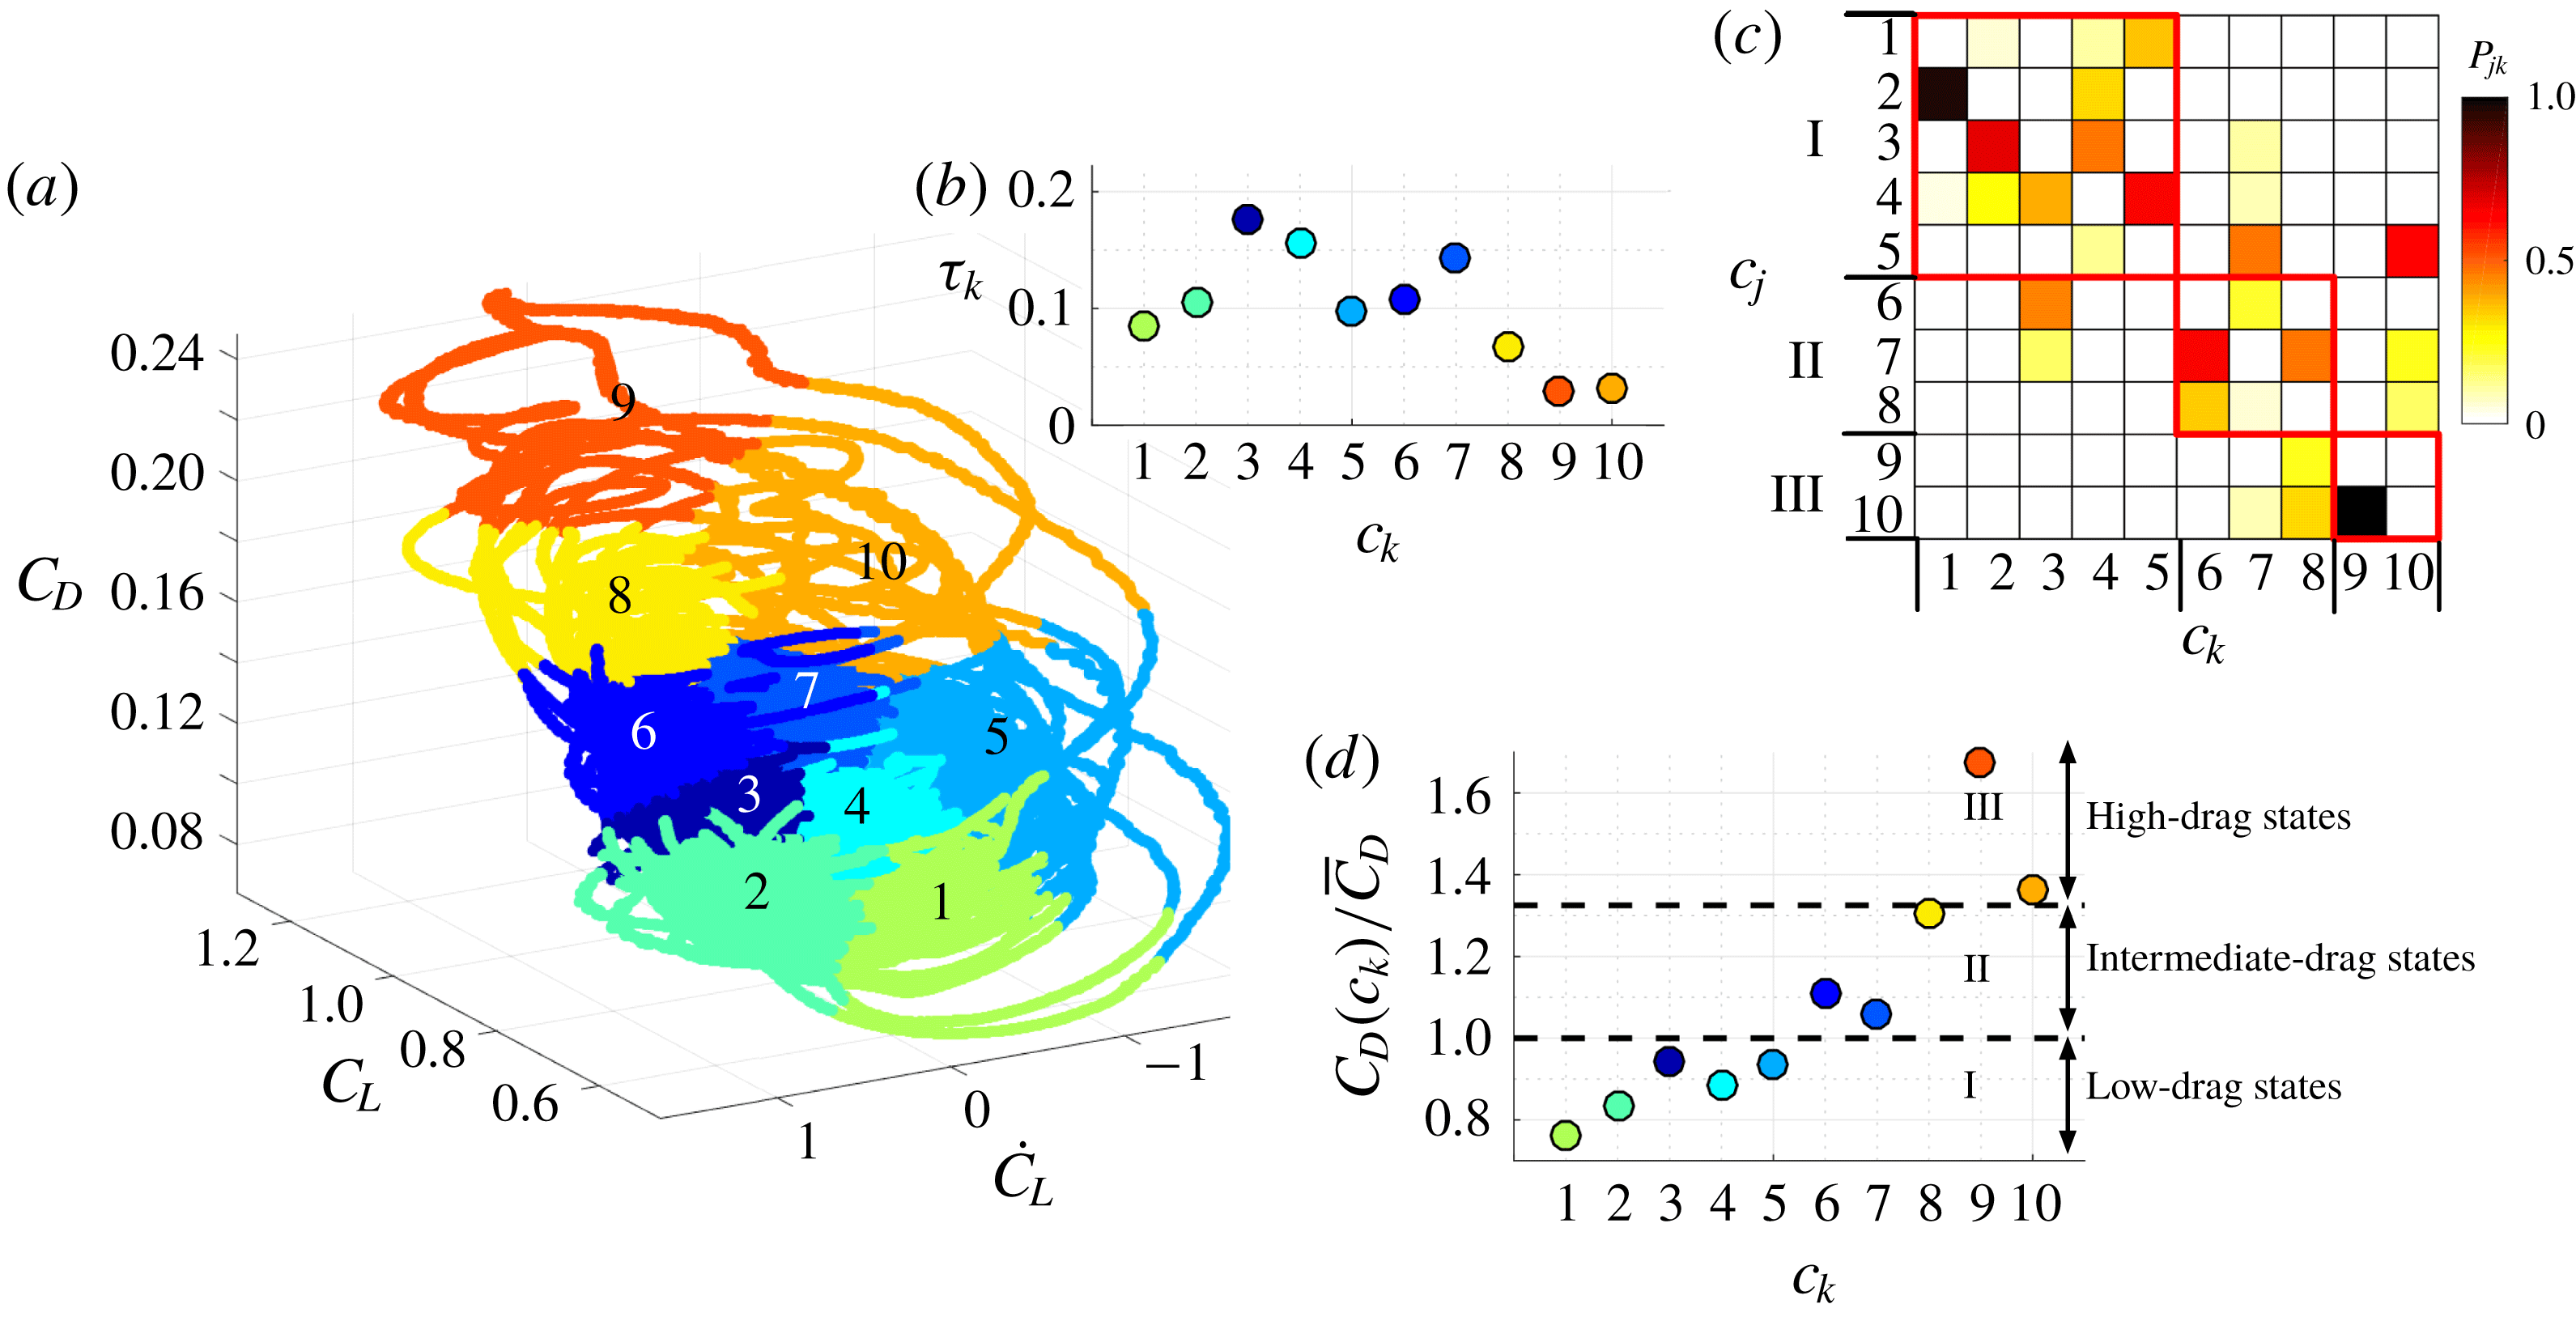
-means algorithm as shown in figure 6(a). A constant time step
 $\unicode[STIX]{x0394}t$
is chosen so as to resolve the baseline vortex shedding frequency,
 $St=fL_{c}\sin (\unicode[STIX]{x1D6FC})/U_{\infty }=0.081$
with at least
 $500$
snapshots. The collected data spans a total convective time of
 $tU_{\infty }/L_{c}=110$
.
(a) Feature space clustering of the 2-D baseline flow. (b) Cluster residence probabilities
 $\unicode[STIX]{x1D70F}_{k}$
. (c) Cluster transition probability matrix, with the red boxes indicating cluster subsets. (d) Normalized drag corresponding to cluster centroids.

By analysing the Markov chain transitions between clusters, the dynamics between characteristic phases of the flow can be deduced. The transition dynamics in post-stalled flows can be described by an associated probabilistic cluster transition matrix
 $\unicode[STIX]{x1D64B}$
. The elements of this matrix describe the probability of transition from cluster
 $c_{k}$
to
 $c_{j}$
in one forward time step
 $\unicode[STIX]{x0394}t$
and are given as
 $P_{jk}=N_{jk}/N_{k}$
with
 $\sum _{j}P_{jk}=1$
. Here,
 $N_{jk}$
is the number of transitions from cluster
 $c_{k}$
to
 $c_{j}$
. The diagonal elements of this matrix represent the likelihood for the trajectory to reside within the same cluster and the off-diagonal entries represent the inter-cluster transitions. We further define the cluster probability as the likelihood the flow remains in any of the clusters, i.e.
 $\unicode[STIX]{x1D70F}_{k}=|N_{k}|/N$
, which is also related to the relative residence time for each cluster. The cluster probabilities and the cluster transitions are shown in figures 6(b) and 6(c), respectively. The cluster probability is the highest for cluster
 $3$
followed by clusters
 $4$
and
 $7$
. The cluster probabilities are low for states
 $9$
and
 $10$
. Also, the flow states in clusters
 $1$
and
 $9$
always transition to clusters
 $2$
and
 $10$
, respectively.
To further simplify these transitions, we can identify the groups of clusters called cluster subsets, in which transitions occur more frequently within them than between them. To identify the partition of these decomposable sub-Markov chains (Kontovasilis & Mitrou Reference Kontovasilis and Mitrou1995), we use the directed modularity maximization algorithm (Leicht & Newman Reference Leicht and Newman2008). The algorithm detects modular subsets where the transitions between clusters within a subset are dense compared to the transition between clusters from different subsets. Here, the algorithm identifies three subsets: subset I:
 $\{1,2,3,4,5\}$
, subset II:
 $\{6,7,8\}$
, and subset III:
 $\{9,10\}$
. These subsets are identified by the red boxes in figure 6(b). High probability inter-subset transitions are observed between clusters
 $3\rightarrow 6$
,
 $7\rightarrow 5$
and
 $10\rightarrow 5$
. These transitions also mark the major paths of transition between subsets. Most of the remaining transitions are within subsets. We further analyse the drag contribution of each cluster, which is obtained from the cluster centroids. We normalize the drag coefficient associated with each cluster centroid with the mean drag
 $\overline{C}_{D}$
as shown in figure 6(d). The dashed lines separate the subsets. Interestingly, subset I corresponds to low-drag states of the flow
 $C_{D}/\overline{C}_{D}\lesssim 1$
, subset II corresponds to intermediate drag states
 $1\lesssim C_{D}/\overline{C}_{D}\lesssim 1.325$
and subset III corresponds to the high-drag states
 $C_{D}/\overline{C}_{D}\gtrsim 1.325$
. The flow intermittently bursts to the high-drag clusters
 $9$
and
 $10$
, associated with low cluster probability. The shedding time associated with these bursts are extremely long. Thus, different levels of drag are all dynamically separated, which can significantly simplify the control design. These insights suggest steering the flow to the subset associated with the lowest drag and then keeping the state in the low-drag subset.
An alternative view point of the Markov chain is a random walk on a directed graph with nodes being clusters and edges being the transition dynamics between them (Newman Reference Newman2010). The edge weights correspond to the number of transitions between the respective clusters
 $N_{jk}$
normalized by the maximum number of cluster transitions observed in the entire trajectory,
 $\max (N_{jk})$
. We neglect any edges with weights less than a threshold of
 $0.1$
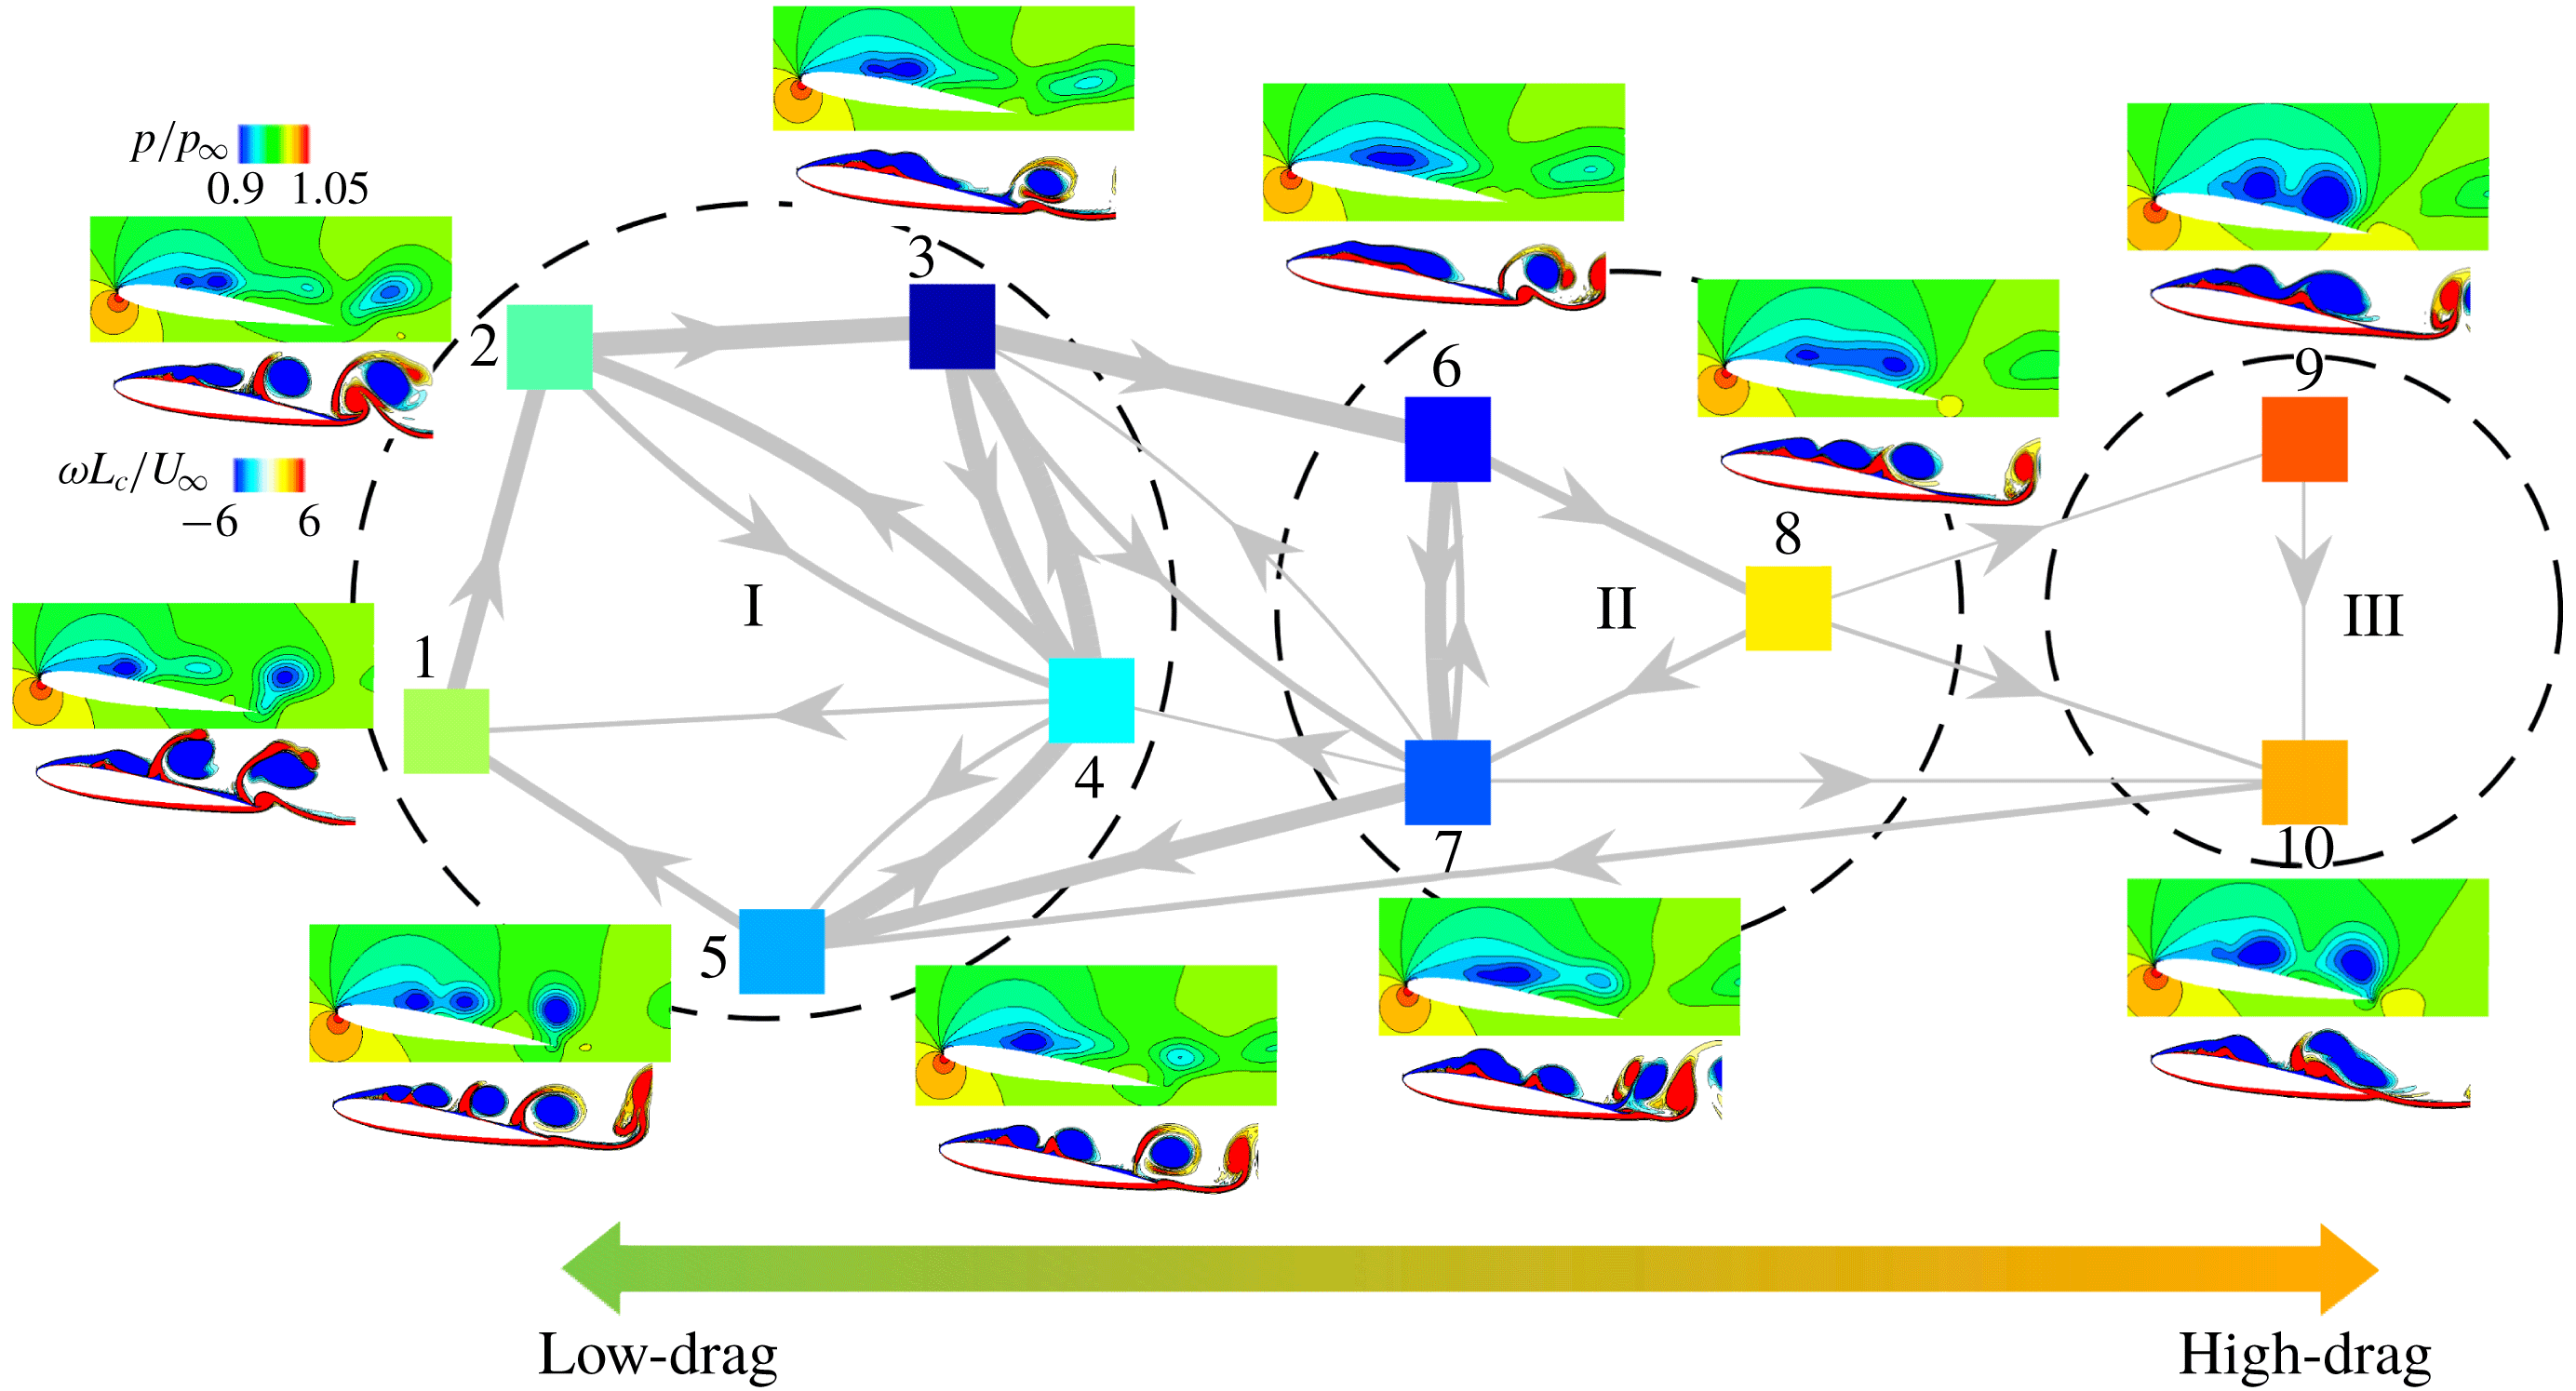
for visual clarity. The directed graph representation of the cluster transitions is shown in figure 7. Here, we can clearly identify the paths of cluster transitions and visualize the phase evolution of the flow. One characteristic feature that stands out from this graph visualization is the role of cluster
 $8$
. The flow can reach cluster
 $8$
only from cluster
 $6$
. This means that only through this cluster
 $8$
, the flow can transition to the high-drag state of cluster
 $9$
or
 $10$
. For this reason, we call cluster
 $8$
the switching cluster. The significance of the cluster transition pathway
 $6\rightarrow 8\rightarrow 9$
is an important consideration for flow control. The elimination or avoidance of this cluster transition pathway is key in enhancing aerodynamic performance, particularly for drag reduction.
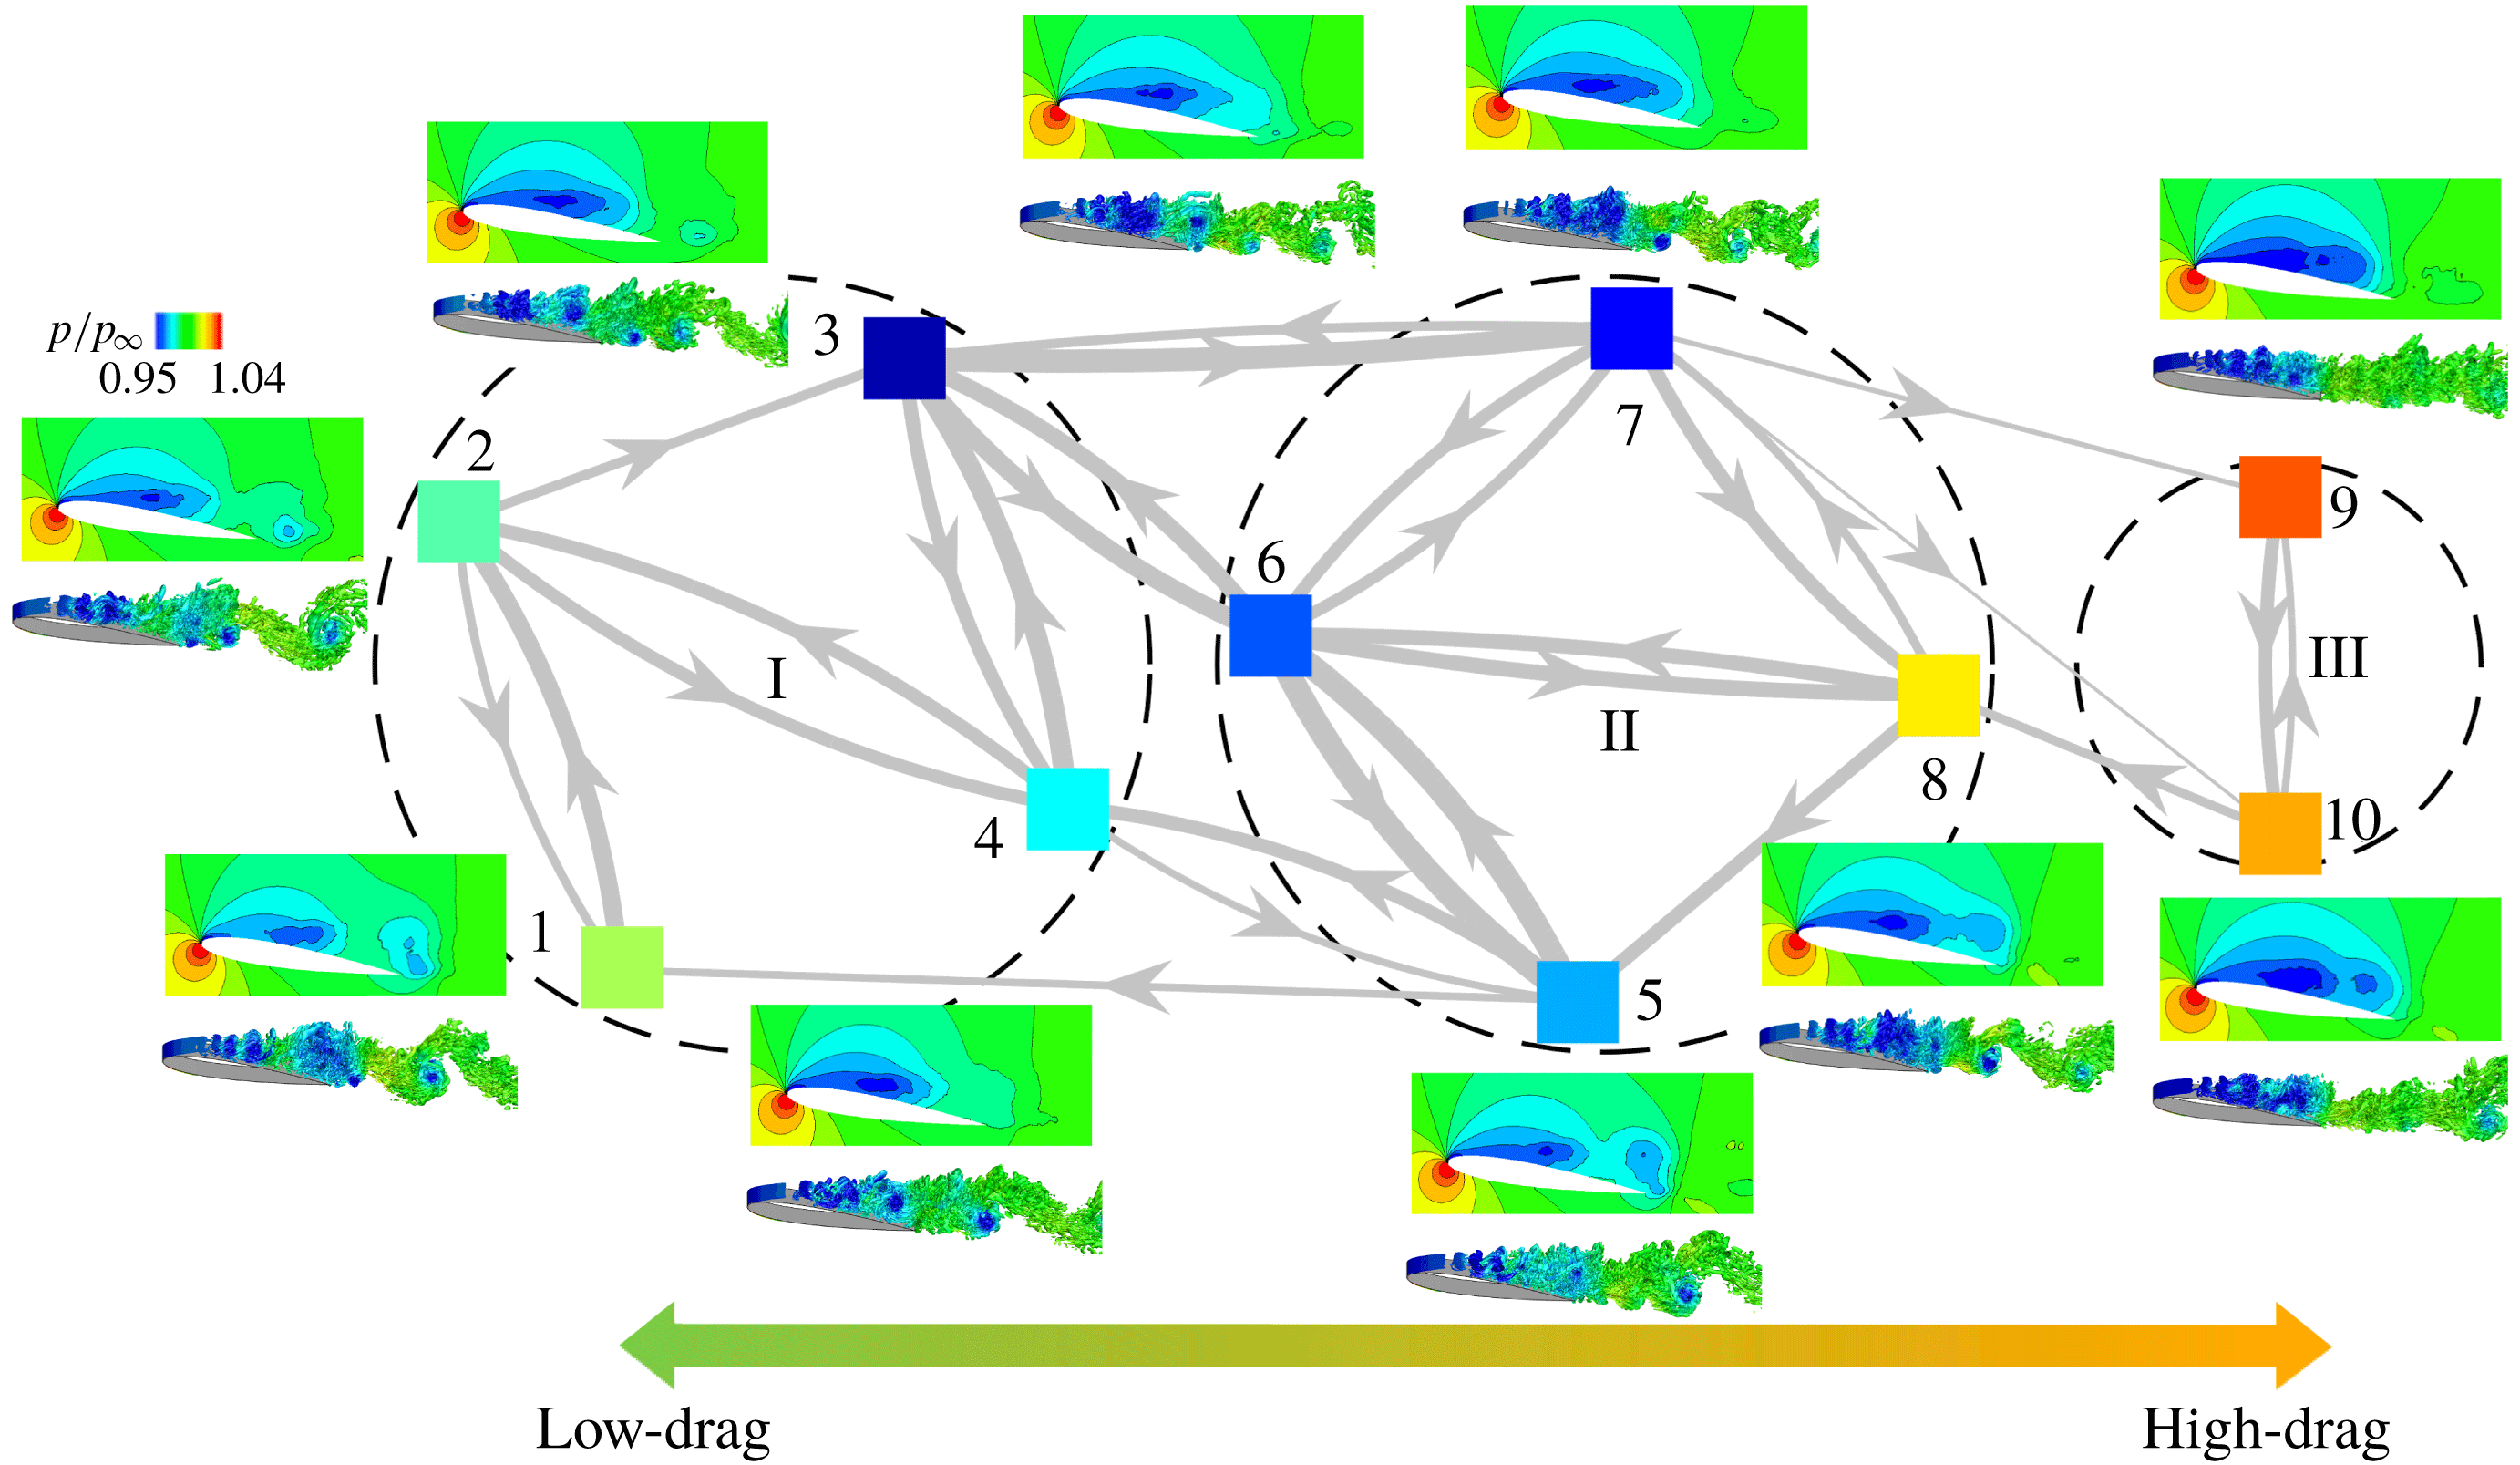
Graph of Markov chain highlighting transitions between clusters for 2-D separated flow over a NACA0012 airfoil. The 2-D cluster-averaged pressure flow fields (
 $p/p_{\infty }$
) and instantaneous vorticity contours (
 $\unicode[STIX]{x1D714}L_{c}/U_{\infty }$
) corresponding to each cluster are shown. The dashed circles indicate the cluster subsets. The edge weights are indicated by the thickness of the lines.

We can average the flow snapshots within each cluster to obtain cluster representative flow fields. The cluster-averaged pressure and the instantaneous vorticity fields are shown in figure 7. The cluster flow fields in subset I provide an enhanced understanding of the flow physics at the low-drag states of the flow. The different phases of the flow are clearly visible in the cluster transitions
 $3\rightarrow 4\rightarrow 5\rightarrow 1\rightarrow 2$
upon observing the associated vortex dynamics. We see the initiation of shear-layer roll up in cluster
 $3$
and the presence of leading-edge vortices in cluster
 $4$
. These vortices start shedding mid-chord in cluster
 $5$
. In cluster
 $1$
, we observe the trailing-edge vortex sheet roll-up followed by the von Kármán vortex shedding in the wake in cluster
 $2$
.
The cluster transition from
 $3$
to
 $6$
results from a build-up of low pressure core and elongation of the vortex sheet on the airfoil surface. Following the graph representation, the flow at cluster
 $6$
could transition either to cluster
 $7$
or
 $8$
. Cluster
 $7$
is characterized by the shear layer roll-up and intermittent shedding in the wake. The rolled-up vortices shed near the mid-chord of the airfoil resulting in a flow transition
 $7\rightarrow 5$
. The transition to cluster
 $8$
results when the rolled-up vortices grow in size elongating the pressure core. As opposed to cluster
 $5$
, here the vortices do not detach from the airfoil surface but are arranged compactly over the surface. The flow from cluster
 $8$
transitions to cluster
 $9$
, accompanied by an even lower-pressure core spanning the entire airfoil with a large roll-up near the trailing edge of the airfoil. This results in a fully separated flow and leads to high-drag. Following this state, the trailing-edge vortex sheet rolls up and the vortices detach from the airfoil at the trailing edge leading to a subsequent transition to cluster
 $10$
and then to
 $5$
. In cluster
 $10$
, the flow briefly reattaches and then separates near the trailing edge. Moreover, cluster
 $7$
is characterized by high-frequency shedding in the wake as opposed to the low-frequency shedding in cluster
 $10$
.
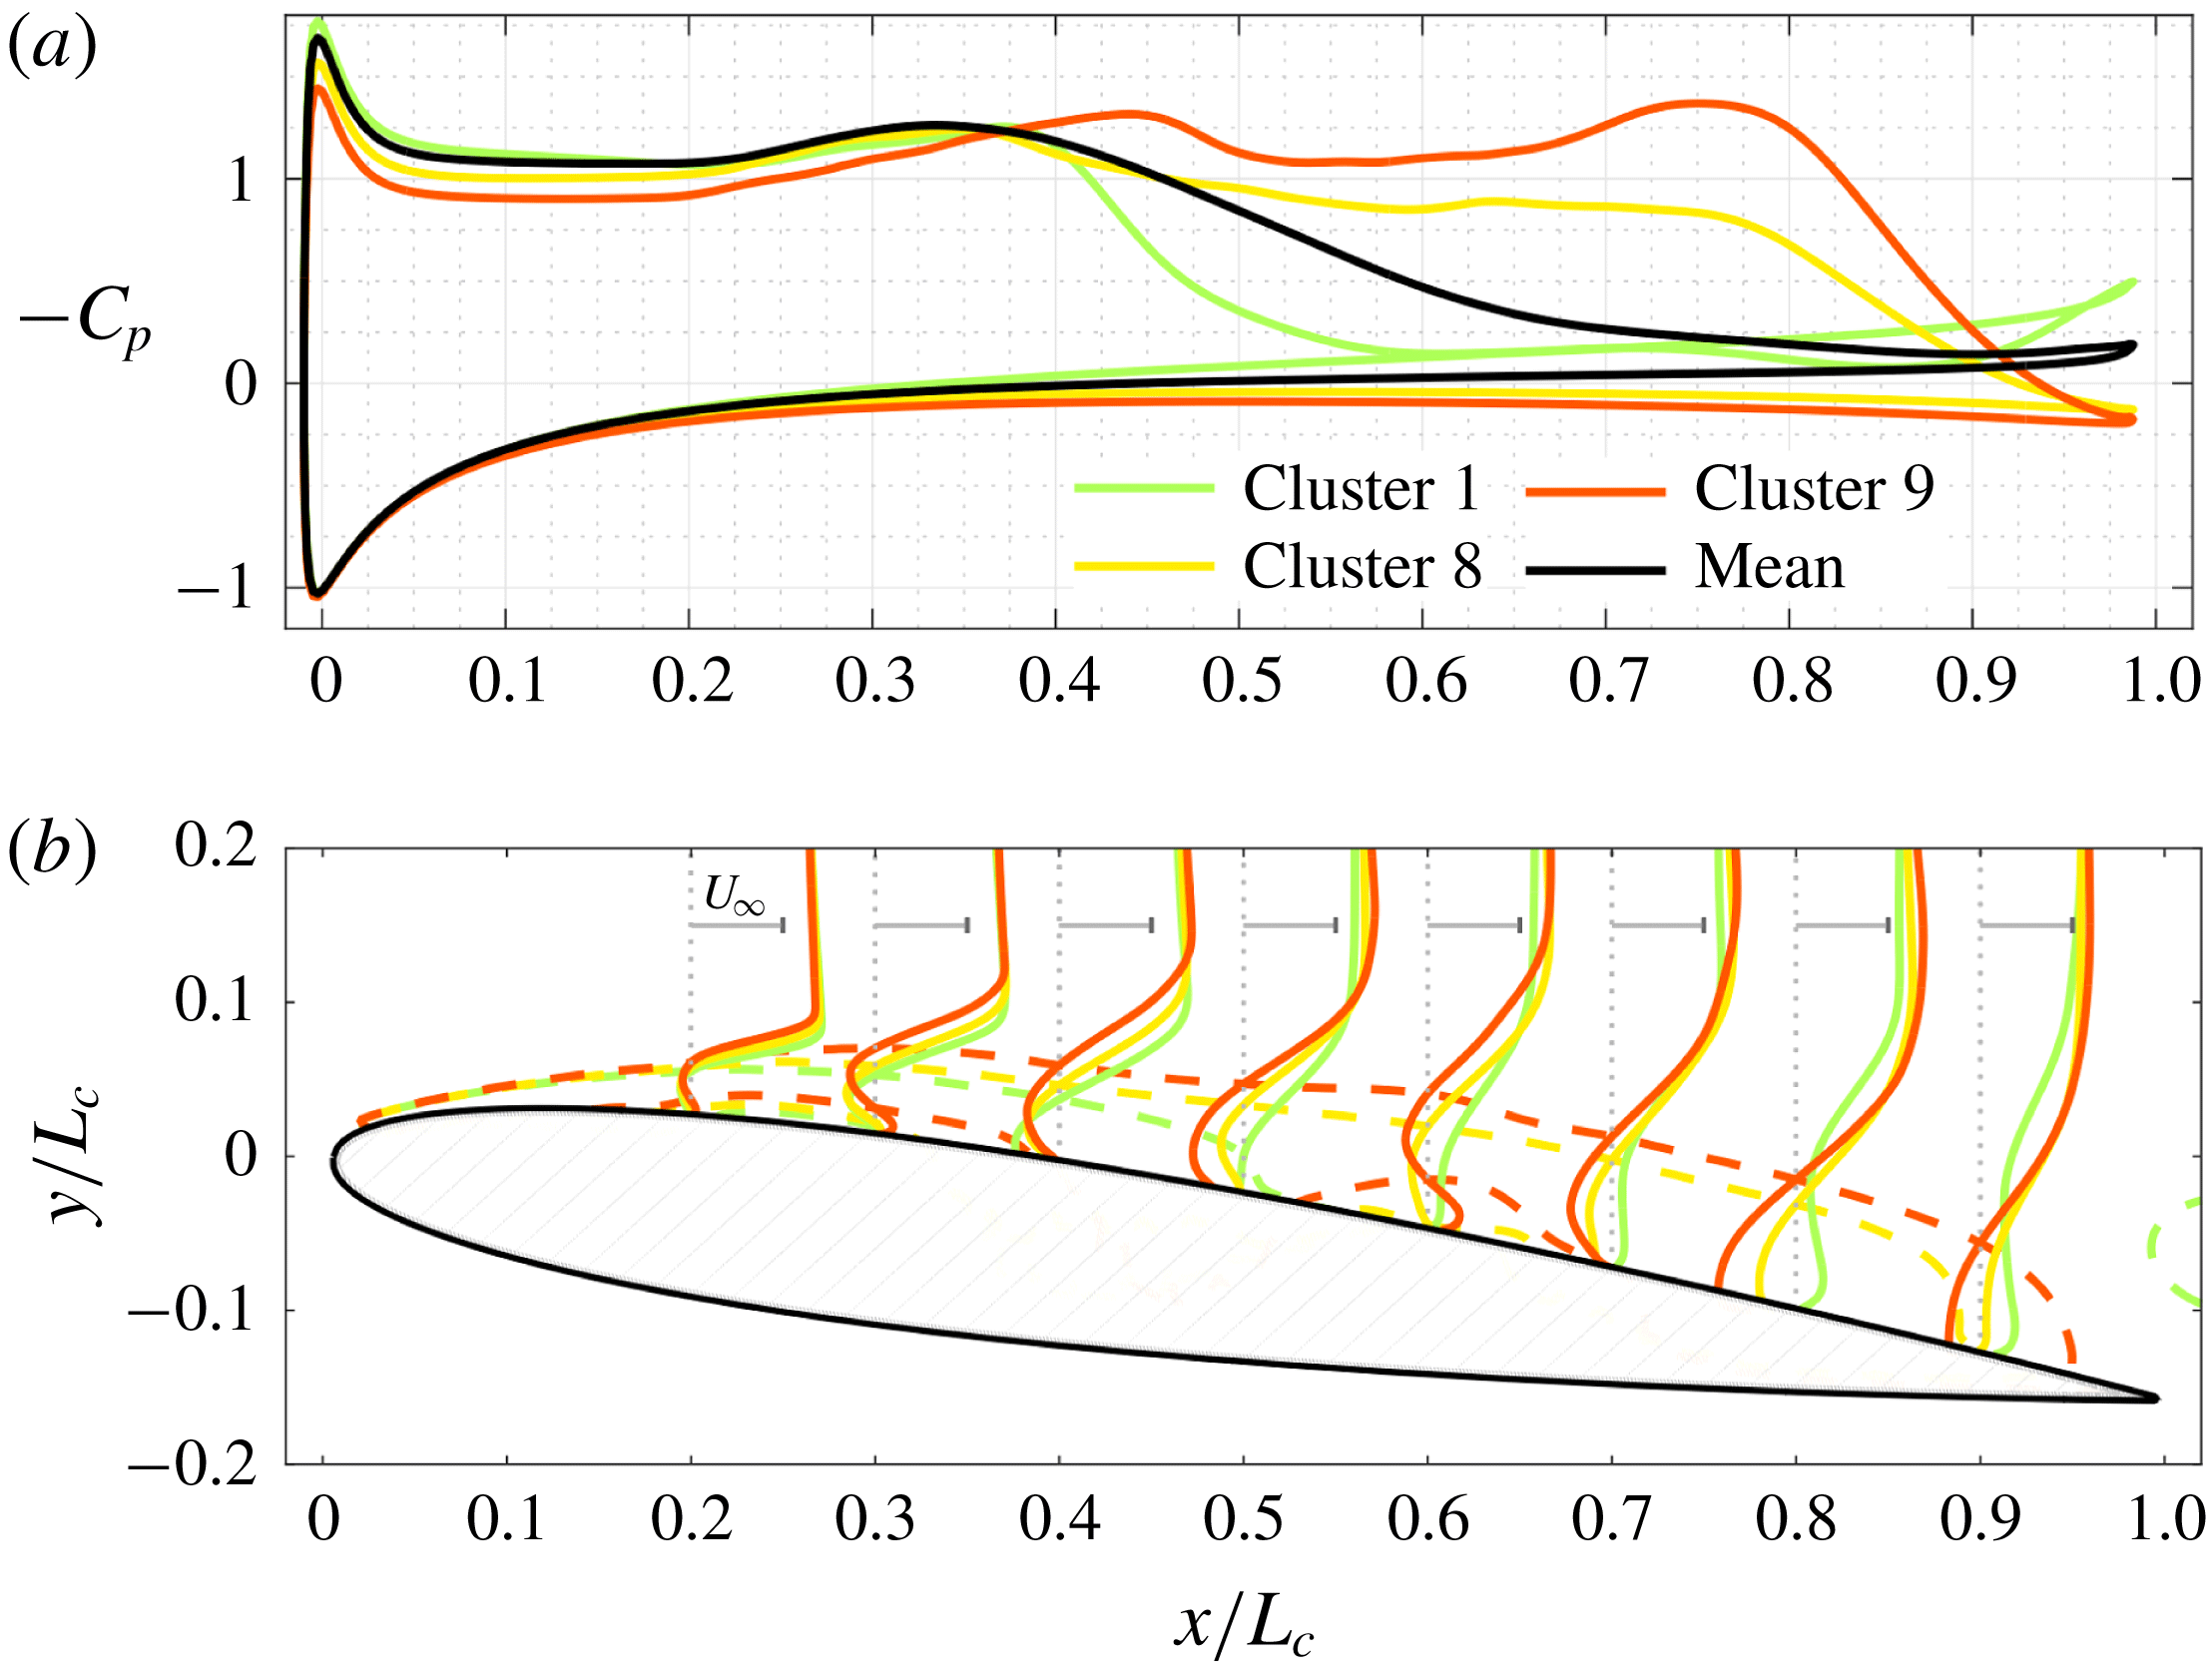
(a) Cluster-averaged pressure distribution over the suction and pressure surfaces of the airfoil and (b) cluster-averaged streamwise velocity profiles for the 2-D baseline flow. Dashed lines indicate the contours of
 $\bar{u}_{x}/U_{\infty }=0$
.

The significance of the clusters can also be examined by looking at the cluster-averaged pressure distribution over the airfoil. We show the pressure distribution over the airfoil surface and streamwise velocity profile for one representative cluster in each cluster subset in figures 8(a) and 8(b), respectively. On the suction side of the airfoil, we can see a favourable pressure gradient near the mid-chord for cluster
 $1$
(low-drag cluster) with a shorter flat pressure region indicating the shorter region of separation. This is also shown by the dashed lines corresponding to zero time-averaged streamwise velocity contour,
 $\bar{u}_{x}/U_{\infty }=0$
. Clusters
 $8$
and
 $9$
have larger regions of separation and are associated with an adverse pressure gradient near the trailing edge.
3.2 Optimized feedback control
Based on the coarse-graining of the feature space into clusters discussed in the previous section we design a cluster-based feedback control law. The actuation input
 $b(t)$
in equation (2.4) is determined with the choice of control amplitudes
 $\{b_{k}\}_{k=1}^{K}$
, feedback of the observable
 $s(t)$
in the feature space and their relative distance to the cluster centroids
 $\{c_{k}\}_{k=1}^{K}$
. Thus, actuation inputs associated with clusters in close proximity to the current measurement are weighed more strongly than those associated with clusters farther away. The control amplitudes
 $\{b_{k}\}_{k=1}^{K}$
are then iteratively optimized using a simplex search to achieve the desired objective as discussed in § 2.4. We design an initial simplex using Latin-hypercube sampling with zero-mean offset control amplitudes
 $\sum _{k}b_{k}=0$
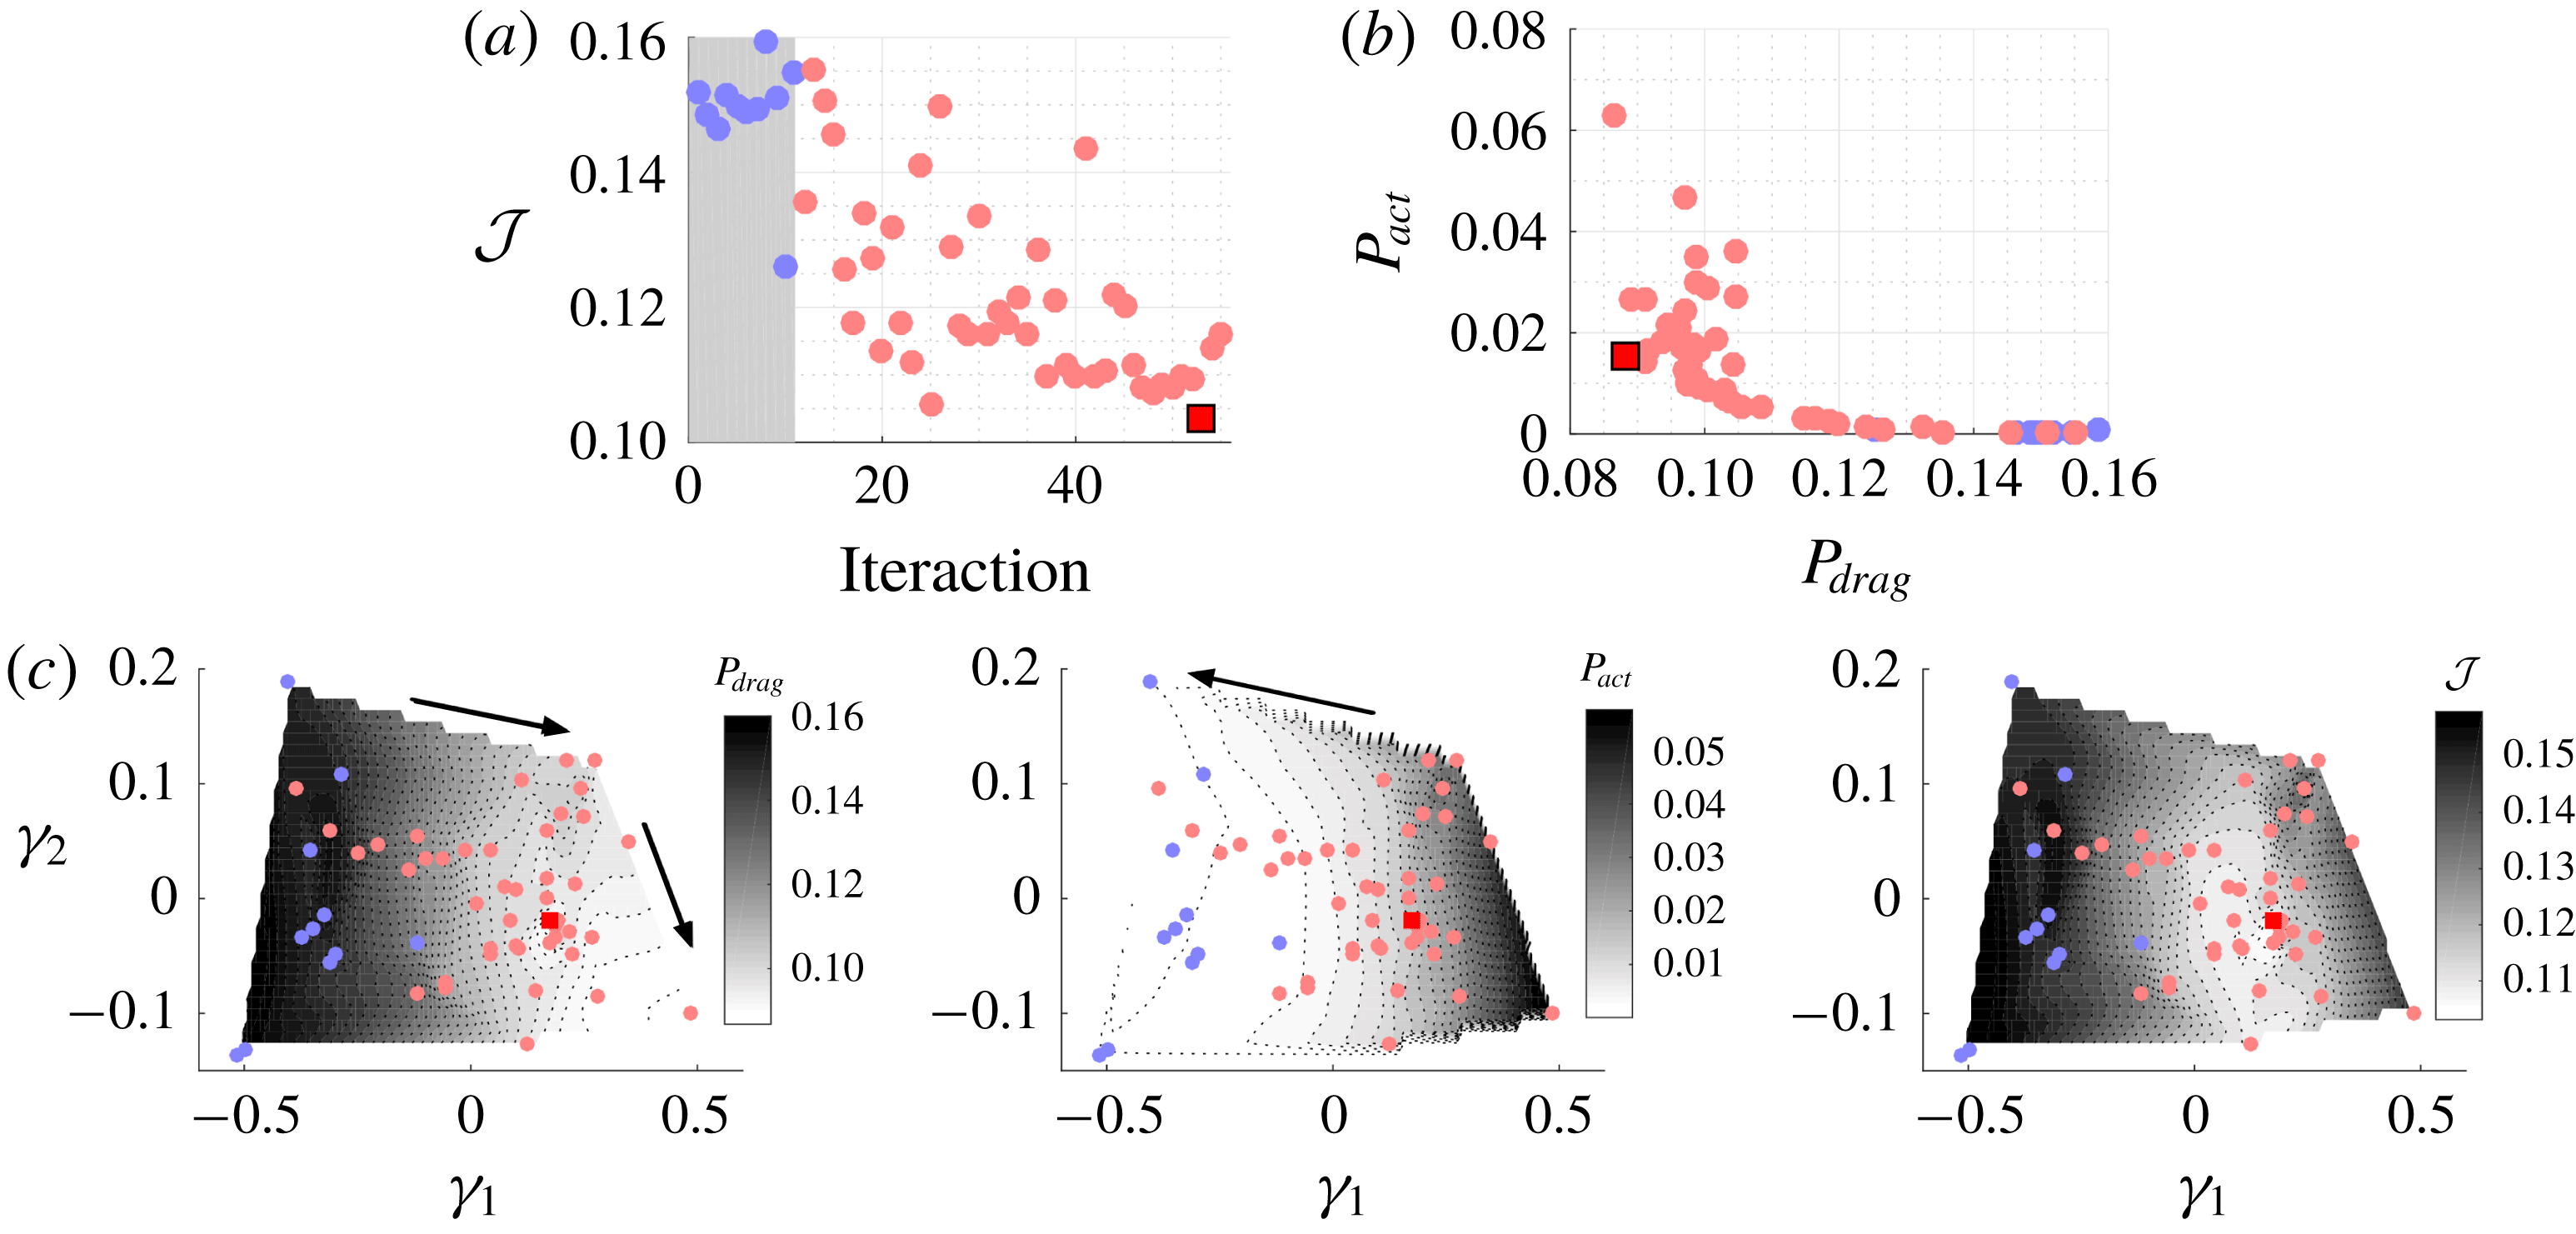
. Time-averages in controlled flow are estimated over 12 periods of the baseline shedding frequency. The optimization of the cost function
 ${\mathcal{J}}$
is summarized in figure 9(a). Following the initial simplex consisting of
 $K+1$
control cases (indicated by blue dots), cost functional is minimized iteratively. The square symbol denotes the optimized control case. The optimization over aerodynamic power
 $P_{drag}$
and actuation power
 $P_{act}$
is shown in figure 9(b).
Control of 2-D separated flow. (a) Objective function minimization to determine the optimized control law and (b) power consumption. The red square symbol denotes the optimized case. (c) Control objective landscape,
 $P_{drag}=P_{drag}(\unicode[STIX]{x1D6FE}_{1},\unicode[STIX]{x1D6FE}_{2})$
,
 $P_{act}=P_{act}(\unicode[STIX]{x1D6FE}_{1},\unicode[STIX]{x1D6FE}_{2})$
, and
 ${\mathcal{J}}={\mathcal{J}}(\unicode[STIX]{x1D6FE}_{1},\unicode[STIX]{x1D6FE}_{2})$
balancing
 $P_{drag}$
and
 $P_{act}$
, all three determined using multidimensional scaling. The transparent blue dots indicate initial simplex control cases. The arrows indicate directions of minimization.

To visualize the control landscape, MDS is performed, as discussed in appendix B. Here, we extract a 2-D proximity map over the (
 $\unicode[STIX]{x1D6FE}_{1},\unicode[STIX]{x1D6FE}_{2}$
) space. Each point in this proximity map stands for a control case or control law, respectively. Pairwise distances given by equation (B 1) measure the similarity/dissimilarity between the control cases. The similarity between control laws in this map increases as the distance between them gets smaller. We fit surfaces of the form
 $P_{drag}=P_{drag}(\unicode[STIX]{x1D6FE}_{1},\unicode[STIX]{x1D6FE}_{2})$
,
 $P_{act}=P_{act}(\unicode[STIX]{x1D6FE}_{1},\unicode[STIX]{x1D6FE}_{2})$
and
 ${\mathcal{J}}={\mathcal{J}}(\unicode[STIX]{x1D6FE}_{1},\unicode[STIX]{x1D6FE}_{2})$
to all the evaluated control laws in figure 9(c). The proximity maps provide information on the complexity of the objective functions, e.g. a single versus multiple minima, and indicate optimization directions for minimizing the aerodynamic and actuation power. Minimizing aerodynamic power involves maximizing
 $\unicode[STIX]{x1D6FE}_{1}$
and minimizing
 $\unicode[STIX]{x1D6FE}_{2}$
, while minimizing actuation power involves minimizing
 $\unicode[STIX]{x1D6FE}_{1}$
. Balancing both power considerations, the control landscape shrinks at the optimal location for the cost function
 ${\mathcal{J}}$
.
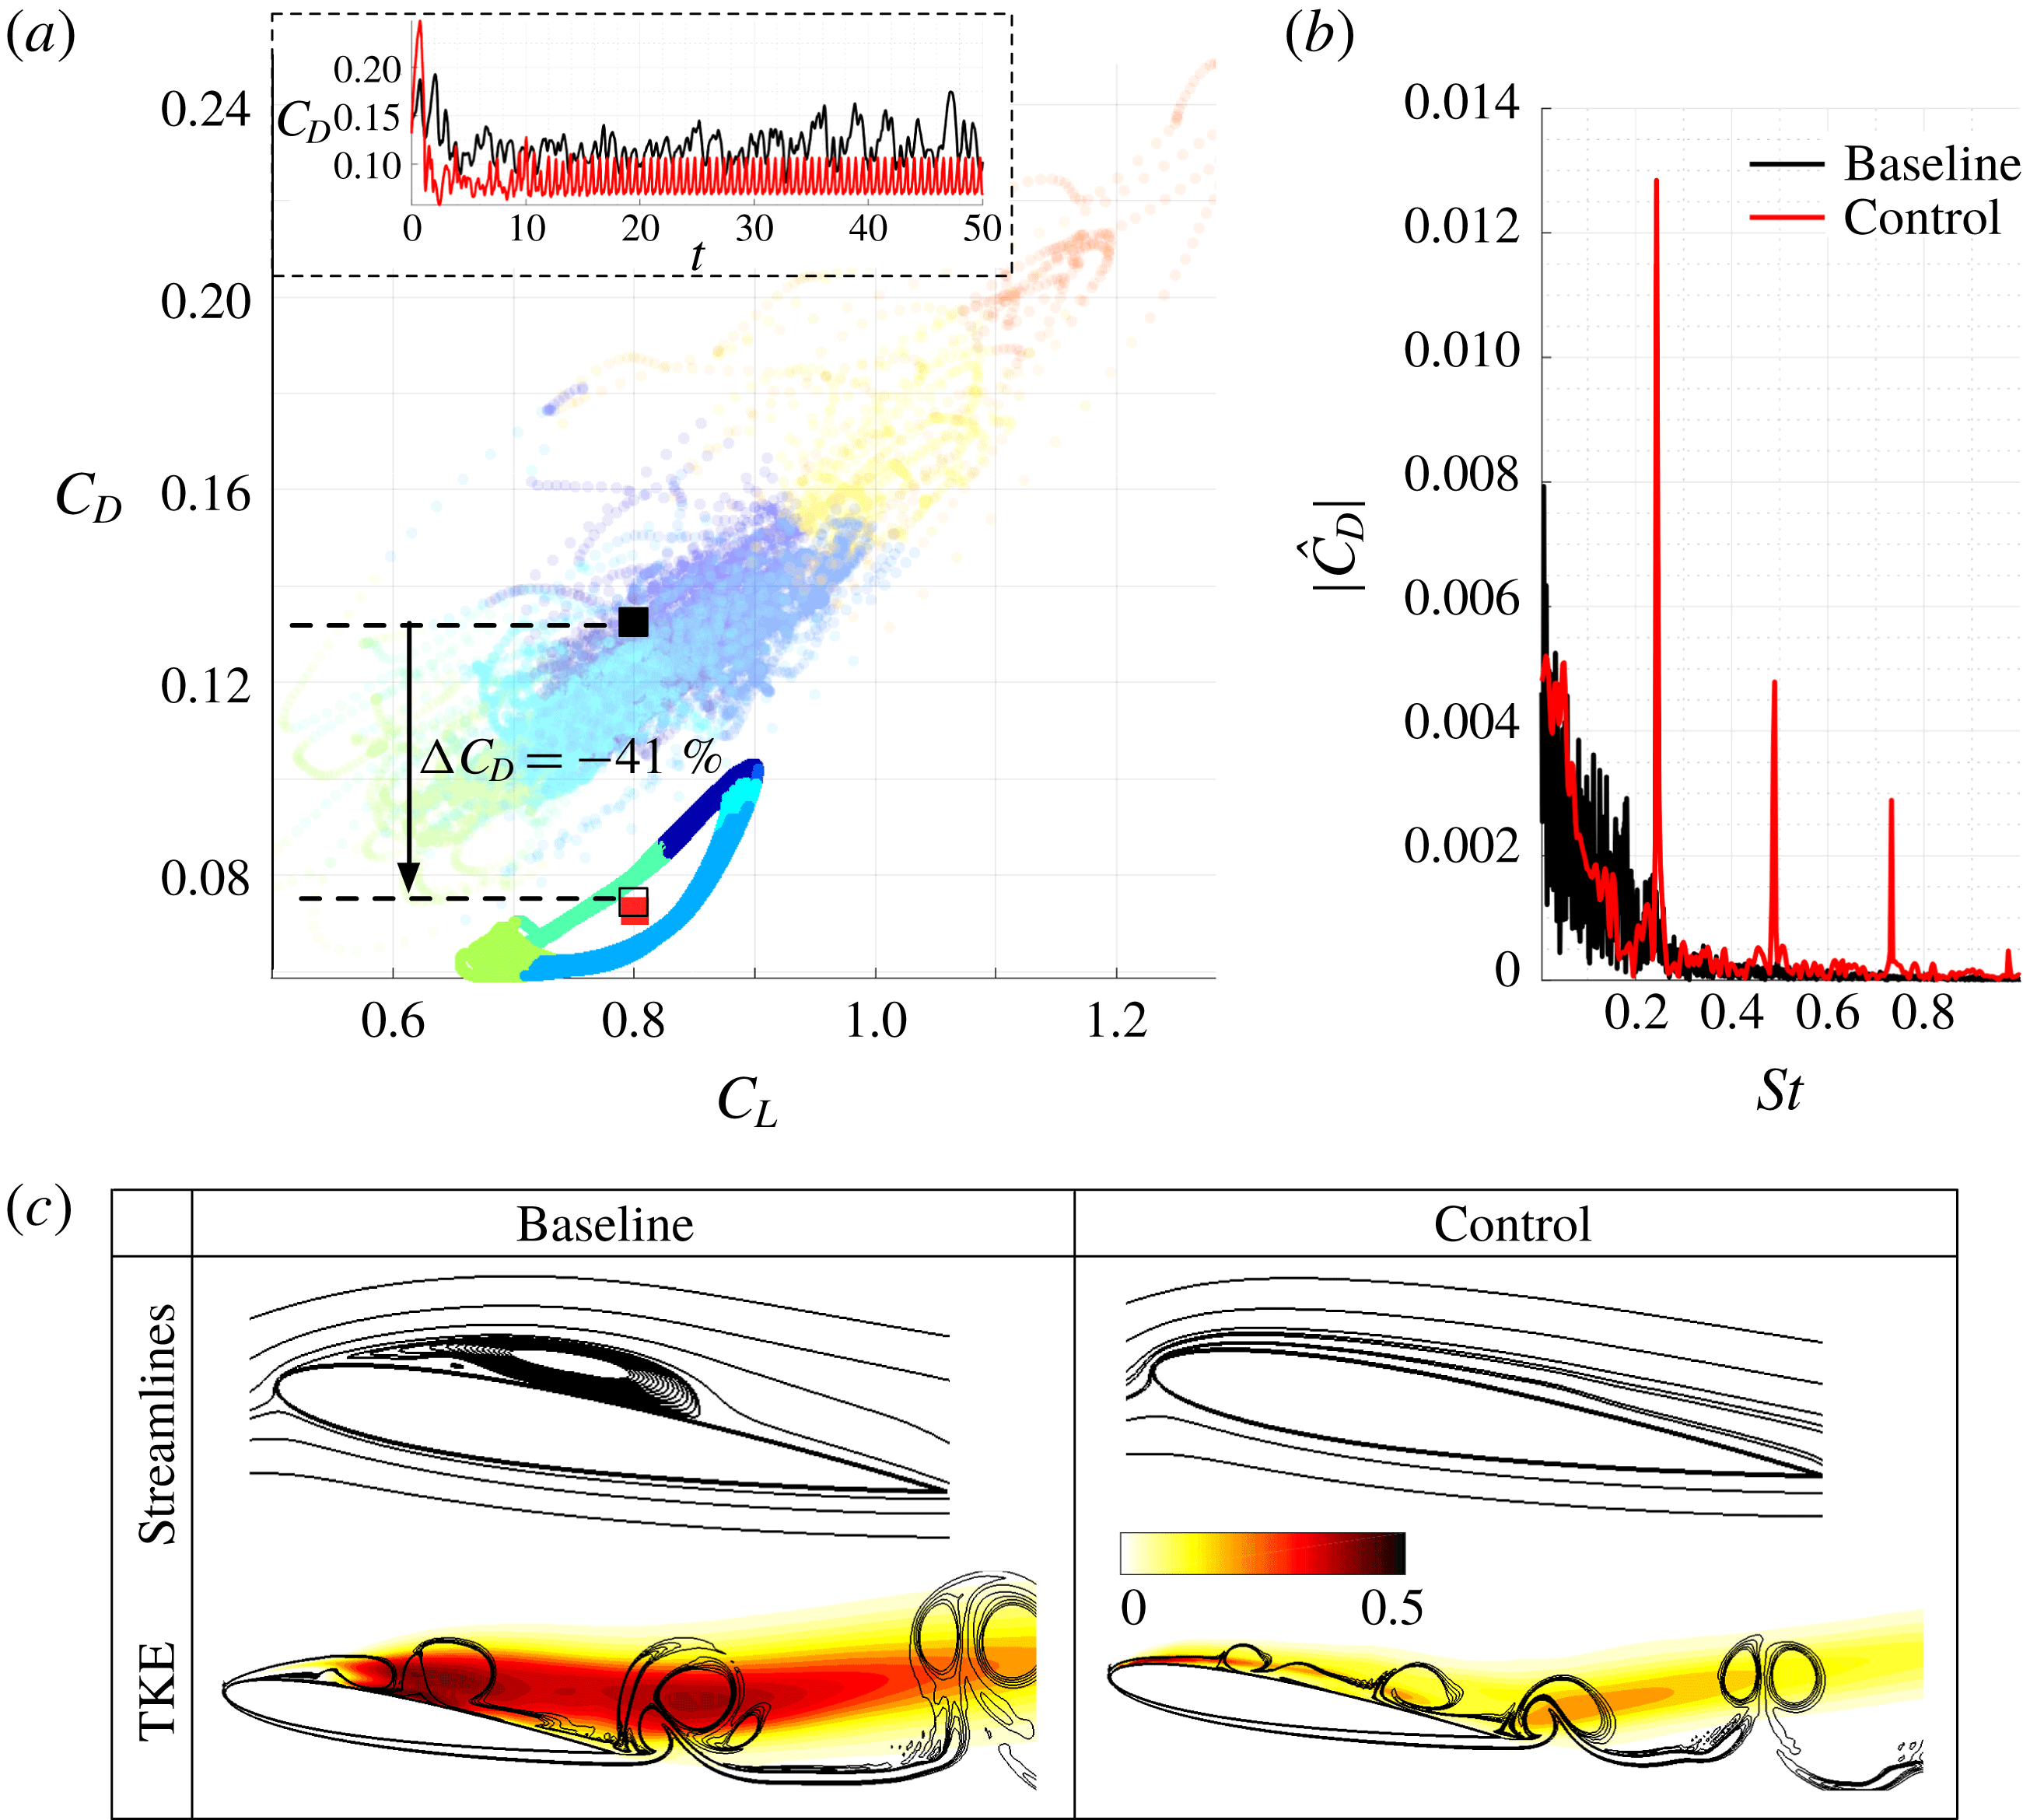
Comparison of baseline and optimized 2-D flow control case; (a) Trajectories, (b) spectral analysis of drag data, and (c) time-averaged streamlines and TKE fluctuations. Baseline trajectories are shown in transparent in (a). The trajectories are coloured according to their member clusters. The contour lines in (c) (bottom) indicate the instantaneous vorticity fields and the colour bar indicate the TKE fluctuation levels.

We now investigate the optimized control case to gain insights on the control strategy uncovered by cluster-based control optimization. The baseline and optimally controlled trajectories in the lift-drag coefficient plane are shown in figure 10(a). A
 $41\,\%$
drag reduction is achieved with the optimized control law. In addition, the unsteadiness in the flow is reduced. In the inset of figure 10(a), the time evolution of the drag coefficient with and without control is shown. In the optimally controlled flow, the trajectories are pushed away from the high-drag states towards the low-drag states of the flow. We compare the drag spectra with single-sided amplitude
 $|{\hat{C}}_{D}|$
in baseline and control cases in figure 10(b). The dominant peak for the optimal control is obtained corresponding to a forcing frequency of
 $St^{+}=0.243$
, identified by the cluster-based optimization procedure. This frequency is the second harmonic of the dominant baseline shedding frequency. As the vortex shedding takes place at a faster time-scale, the intermittent occurrences of flow states associated with high-drag clusters are avoided. The time-averaged streamlines and TKE for both the baseline and controlled flows are shown in figure 10(c). The contour lines in TKE correspond to the instantaneous spanwise vorticity. The streamlines indicate that the separation bubble is eliminated with control compared to the baseline resulting in a fully attached flow. Moreover, with control, the turbulent kinetic energy fluctuation dramatically decreases. Furthermore, the roll-up of the vortices is delayed.
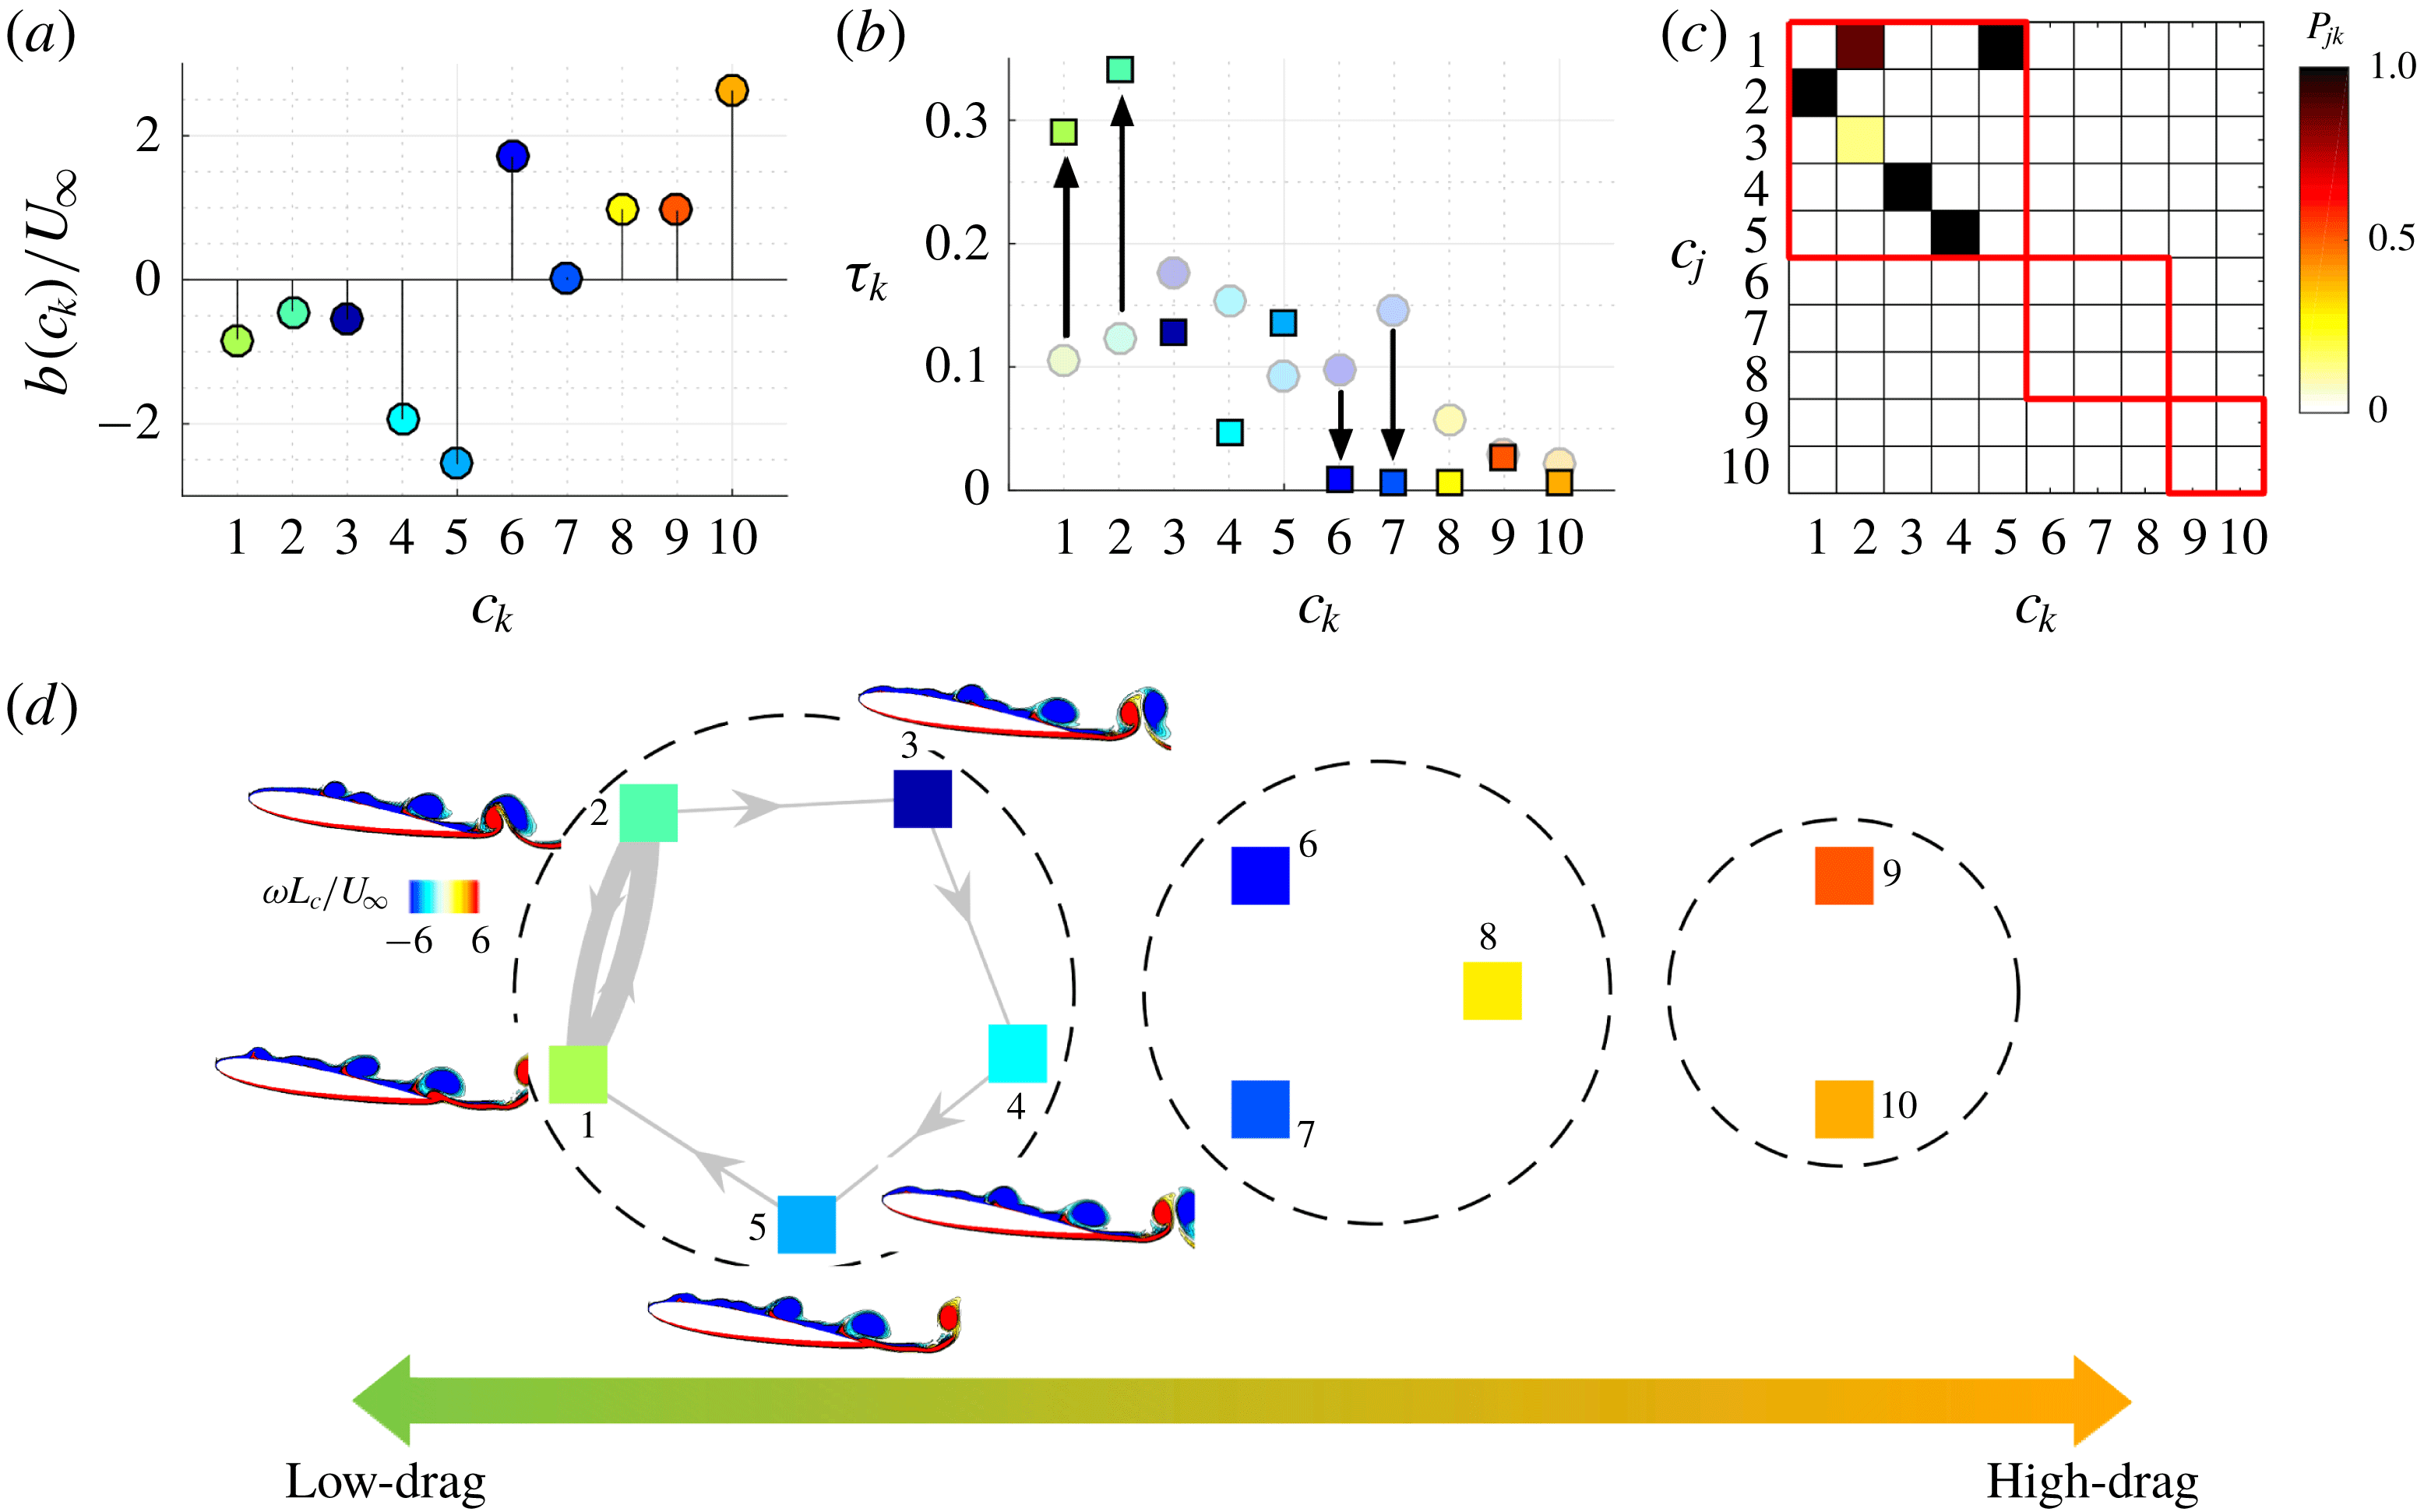
Control of 2-D separated flow. (a) Cluster jet velocity, (b) cluster residence probability for baseline (shown in transparent round symbols) and controlled flows (shown in solid square symbols), (c) Cluster transitions with control, (d) controlled Markov transition network with instantaneous vorticity contours (
 $\unicode[STIX]{x1D714}L_{c}/U_{\infty }$
).

The cluster control amplitudes
 $b_{k}$
associated with the optimized control case are shown in figure 11(a). Negative and positive amplitudes indicate suction and blowing, respectively. The cluster control amplitudes are negative for clusters 1–5 and positive for 6–10. This indicates that suction is performed in subset I (clusters 1–5) where
 $C_{D}/\overline{C}_{D}<1$
. In the remaining clusters (subset II and III), blowing is performed. In the optimized control case, suction is performed in subset I to keep the trajectories in the low-drag state. As discussed in § 3.1, the transition to high-drag cluster
 $9$
occurs via the path
 $6\rightarrow 8\rightarrow 9$
. Blowing is performed for these clusters to kick the trajectories away from these high-drag states. The flow states in cluster
 $9$
always transition to cluster
 $10$
. The high blowing ratio in cluster
 $10$
causes the flow to transition to cluster
 $5$
, where highest level of suction is applied to keep the flow in the low-drag states. At steady state, the mean cluster-based control amplitude is
 $|\bar{b}|/U_{\infty }=0.78$
which amounts to a momentum coefficient
 $\overline{C}_{\unicode[STIX]{x1D707}}=0.016$
.
We evaluate the cluster probability for the optimally controlled flow and compare it with the baseline flow as shown in figure 11(b). The controlled flow spends a significant amount of time in the lowest states of clusters
 $1$
and
 $2$
. The cluster probability associated with subset II clusters
 $6,7$
and
 $8$
reduces considerably. The cluster transitions in the controlled flow and the controlled Markov transition network are shown in figures 11(c) and 11(d), respectively. The iterative optimization procedure coupled with cluster-based control laws achieve a re-routing of the trajectories to reduce drag power associated with the flow. This minimizes the transition to clusters in subset II (intermediate-drag states) which prevents cluster transitions to clusters in subset III (high-drag states). The controlled flow exhibits a limit-cycle behaviour, which is resolved by the low-drag clusters in subset I. As the flow transitions only in subset I clusters, the dominant frequency in controlled flow increases as mentioned before.
In summary, the cluster-based control strategy iteratively identifies optimal forcing amplitudes at the cluster states that result in minimizing power consumption for flight. For the optimized feedback control law for 2-D separated flow, suction is performed for the low-drag clusters
 $C_{D}/\overline{C}_{D}<1$
, while blowing is performed for the remaining clusters. With control, the flow transition to the switching cluster is avoided resulting in higher cluster probabilities associated with the low-drag clusters. From the physics standpoint, the optimized control case yields in fully attached flow leading to a drag reduction of
 $41\,\%$
compared to the baseline flow.
4 Control of 3-D separated flow over an airfoil
In the previous section, the cluster-based methodology was demonstrated for 2-D flow control. In this section, we extend the control framework for 3-D separated flows over an airfoil in a model-free manner. Despite the 3-D LES computations being very expensive and flow physics being rich and complex, the present approach utilizes a low-dimensional feature space to cluster the dynamics enabling a computationally tractable flow control strategy. Using this cluster-based strategy, we deduce an optimized global feedback control law for unsteady blowing to minimize power consumption of aerodynamic flight.
4.1 Baseline feature space clustering
The 3-D baseline separated flow over an airfoil contains flow features with von Kármán vortex shedding in the wake and Kelvin–Helmholtz instabilities in the shear layer. The dominant frequency associated with von Kármán vortex shedding is
 $St=0.0884$
and the dominant shear-layer frequency associated with the Kelvin–Helmholtz instability is almost an order of magnitude higher at
 $St=0.6952$
. For the cluster-based analysis of the 3-D baseline flow, a time series trajectory of the observables
 $s^{b}(t)$
is collected at a constant time step of
 $\unicode[STIX]{x0394}t=0.0036$
. The feature space segmentation into
 $K=10$
clusters is shown in figure 12(a). For the 3-D baseline flow, the spanwise vortices formed from shear-layer roll-up break into smaller structures over the airfoil, leading to lower fluctuation levels in aerodynamic forces compared to the 2-D baseline flow. The variance in the cluster probabilities is reduced compared to the 2-D clusters, as shown in figure 12(b). As cluster
 $6$
is positioned closest to the centroid of the full data set,
 $\bar{c}$
, its cluster probability is the highest. The transition probabilities of the cluster transition matrix are shown in figure 12(c). The flow states in clusters
 $1$
and
 $9$
always transition to clusters
 $2$
and
 $10$
, respectively, resulting in a high probability of transition.
(a) Feature space clustering of 3-D baseline flow data. (b) Cluster probabilities. (c) Transitions probabilities. (d) Time series of drag coefficient coloured by cluster association and average (normalized) drag coefficient across clusters. The red boxes and the dashed circles indicate the cluster subsets.

Performing directed modularity maximization, three subsets can be identified: subset I,
 $\{1,2,3,4\}$
; subset II,
 $\{5,6,7,8\}$
; and subset III:
 $\{9,10\}$
. These subsets are highlighted in the red boxes in figure 12(c). High probability inter-subset transitions originate from cluster
 $3$
in subset I,
 $7$
in subset II and
 $10$
in subset III. The grouping of the clusters into subsets can also be correlated with the drag coordinate, shown in figure 12(d). Here, subset I corresponds to low-drag states of the flow
 $C_{D}(c_{k})/\overline{C}_{D}\lesssim 0.98$
, subset II correspond to intermediate-drag states
 $0.98\lesssim C_{D}(c_{k})/\overline{C}_{D}\lesssim 1.1$
, and subset III corresponds to the high-drag states
 $C_{D}(c_{k})/\overline{C}_{D}\gtrsim 1.1$
. We also show the time series of drag coefficient, coloured by their cluster associations. We can clearly observe intermittent bursts resulting in high-drag states, which are the target of our feedback control strategy.
Further clarity in the transitions can be obtained by examining the Markov transition network shown in figure 13. For each cluster, we show the mid-span pressure field associated with the cluster centroids and a representative instantaneous flow-field visualization with
 $Q$
-criterion isosurfaces coloured by the pressure distribution. Each cluster stands for a characteristic phase of the vortex-shedding process. The clusters in the low-drag subset are characterized by the departure of shedding vortices from the suction surface, leaving the airfoil free from the influence of the low-pressure core built up within the vortex. On the other end, the clusters in intermediate- and high-drag subsets are characterized by the formation of the large vortices over the airfoil. In the process of their formation, these vortices remain over the suction surface and build-up the low pressure core, increasing the instantaneous drag and lift. For the high-drag clusters
 $\{9,10\}$
, in particular, we find that the vortex formation time is longer than that for the intermediate-drag subset. The vortices are further strengthened through accumulating vorticity generated from the leading edge over the extended time of formation, achieving even lower pressure in their core and higher drag compares to those in the intermediate-drag subset. As these high-drag clusters have relatively low probability compared to others (see figure 12
b), their occurrences can also be viewed as intermittent events that feature with longer shedding period.
Graph of Markov chain illustrating transitions between clusters for the 3-D baseline flow. The 3-D cluster-averaged mid-span pressure flow fields (
 $p/p_{\infty }$
) and instantaneous pressure contours (highlighted by Q-criterion) corresponding to each cluster are shown. The dashed circles indicate the cluster subsets.

Our strategy of cluster-based control is to reroute the cluster pathway from passing through the intermittent events of long-formation/high-drag clusters
 $\{9,10\}$
. The transition to clusters
 $\{9,10\}$
are only possible via cluster
 $7$
, which we refer to as the switching cluster in this 3-D flow. We also see that high volume of transition to cluster
 $7$
takes place from cluster
 $3$
, according to figures 12(c) and 13. Clearly, rerouting the cluster pathway from
 $3\rightarrow 7\rightarrow 9\rightarrow 10$
is an important consideration for drag reduction control. In the next section, we apply these insights from cluster-based observation of flow physics to design the flow control strategy.
4.2 Optimized feedback control
We perform feedback control using the discrete clusters in 3-D baseline flow. The objective is to deduce blowing amplitudes in characteristic phases of the flow in order to maximize the aerodynamic performance. This is achieved by iteratively optimizing the control amplitudes
 $b_{k}$
in each cluster in an automated fashion to minimize the cost function
 ${\mathcal{J}}$
, comprised of the aerodynamic and actuation power. In the review by Greenblatt & Wygnanski (Reference Greenblatt and Wygnanski2000), it was shown that the excitation of Kelvin–Helmholtz instabilities in the shear layer is essential for suppression of flow separation. Knowledge of these instabilities can be applied to design flow control strategies. Here, a cluster-based control law is optimized without assuming any prior knowledge of instabilities. The value associated with
 $\unicode[STIX]{x1D702}$
in equation (2.5) influences the relative importance of actuation power (input cost) and aerodynamic power (state cost) in the objective function evaluation. Increasing
 $\unicode[STIX]{x1D702}$
lowers the relative importance of actuation power and may yield an optimized control law associated with higher
 $\overline{C}_{\unicode[STIX]{x1D707}}$
. The feedback gain
 $\unicode[STIX]{x1D6FD}$
in equation (2.4) associated with these optimized control amplitudes is subsequently increased to explore the flow control implications at higher
 $\overline{C}_{\unicode[STIX]{x1D707}}$
.
To speed up the 3-D computations, we employ a parallel simplex method following Lee & Wiswall (Reference Lee and Wiswall2007). The method is similar to the original simplex method, except that multiple control simulations can be performed in parallel to accelerate the optimization process. In the 2-D control effort, the cluster-based control optimization was unconstrained allowing for both blowing and suction jet velocities in the clusters. However, in the 3-D control effort, a constraint is added to restrict the control amplitudes in the simplex search (Luersen, Le Riche & Guyon Reference Luersen, Le Riche and Guyon2004) such that pure blowing is performed with
 $0\leqslant b_{k}/U_{\infty }\leqslant 3.3$
. The lower constraint ensures that only pure blowing is performed and the upper constraint limits the highest blowing ratio that can be achieved. The addition of this constraint is motivated primarily to examine if the cluster-based strategy can take advantage of flow instabilities for the control of separated flows.
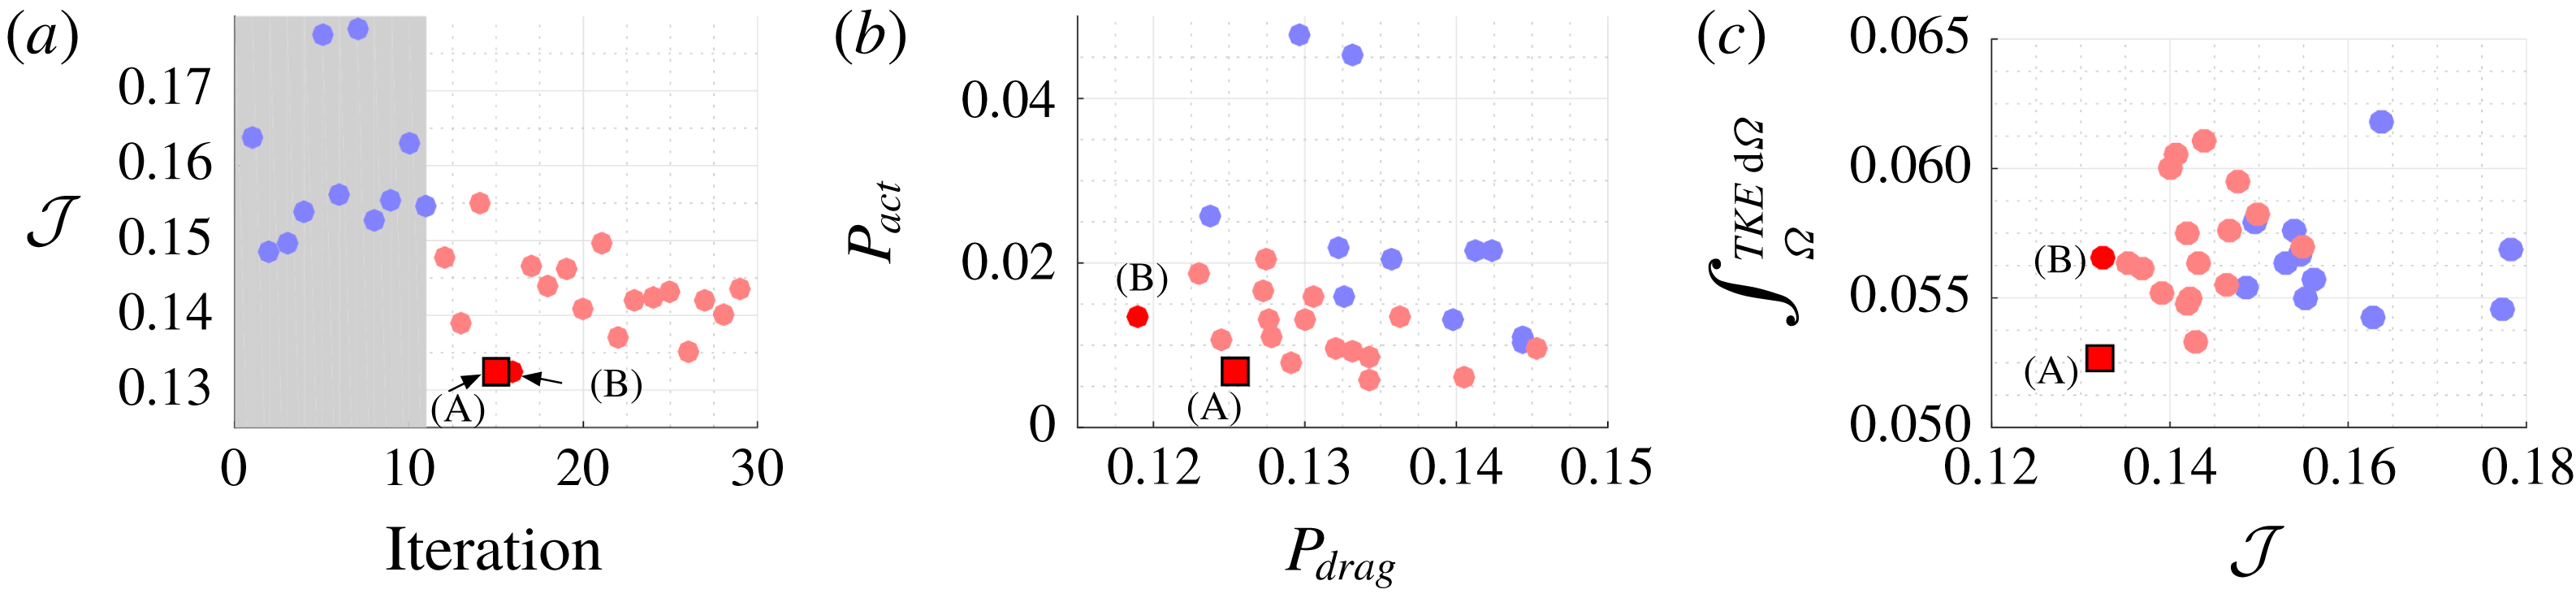
Control of 3-D separated flow. (a) Objective function
 ${\mathcal{J}}$
minimization to determine the optimized control case, and (b) individual power consumptions
 $(P_{drag},P_{act})$
. The square symbol denotes the optimized case. (c) Integrated TKE over the entire computational domain
 $\unicode[STIX]{x1D6FA}$
. The transparent blue dots indicate initial simplex control cases and the red square symbol denotes the optimized case.

Time averages in the controlled flow are estimated over eight periods of dominant wake shedding frequency. The minimization of the cost function
 ${\mathcal{J}}$
associated with the control simulations is outlined in figure 14(a). Following the initial simplex cases (shown in blue), the optimization procedure iteratively minimizes the total power consumption. The cost function associated with aerodynamic and actuation power is shown in figure 14(b). Following the optimization procedure, the optimized control case A associated with minimum power consumption is deduced. We also highlight another control case B, whose cost function evaluation is similar to case A. Control case A is associated with lower actuation power (
 $P_{act}$
) and correspondingly lower
 $\overline{C}_{\unicode[STIX]{x1D707}}=0.0068$
, while control case B is associated with higher
 $\overline{C}_{\unicode[STIX]{x1D707}}=0.016$
. However, the aerodynamic power (
 $P_{drag}$
) is lower for B compared to A. In order to evaluate the effect of minimization of cost functional to the overall flow physics, we integrate the TKE in the computational domain
 $\unicode[STIX]{x1D6FA}$
for all the control cases, which is shown in figure 14(c). A minimum integrated TKE for the optimized control case A is obtained. Due to a lower actuation power input and lower velocity fluctuations in the streamwise wake associated with drag reduction, the TKE fluctuations are minimized with the optimized control law.
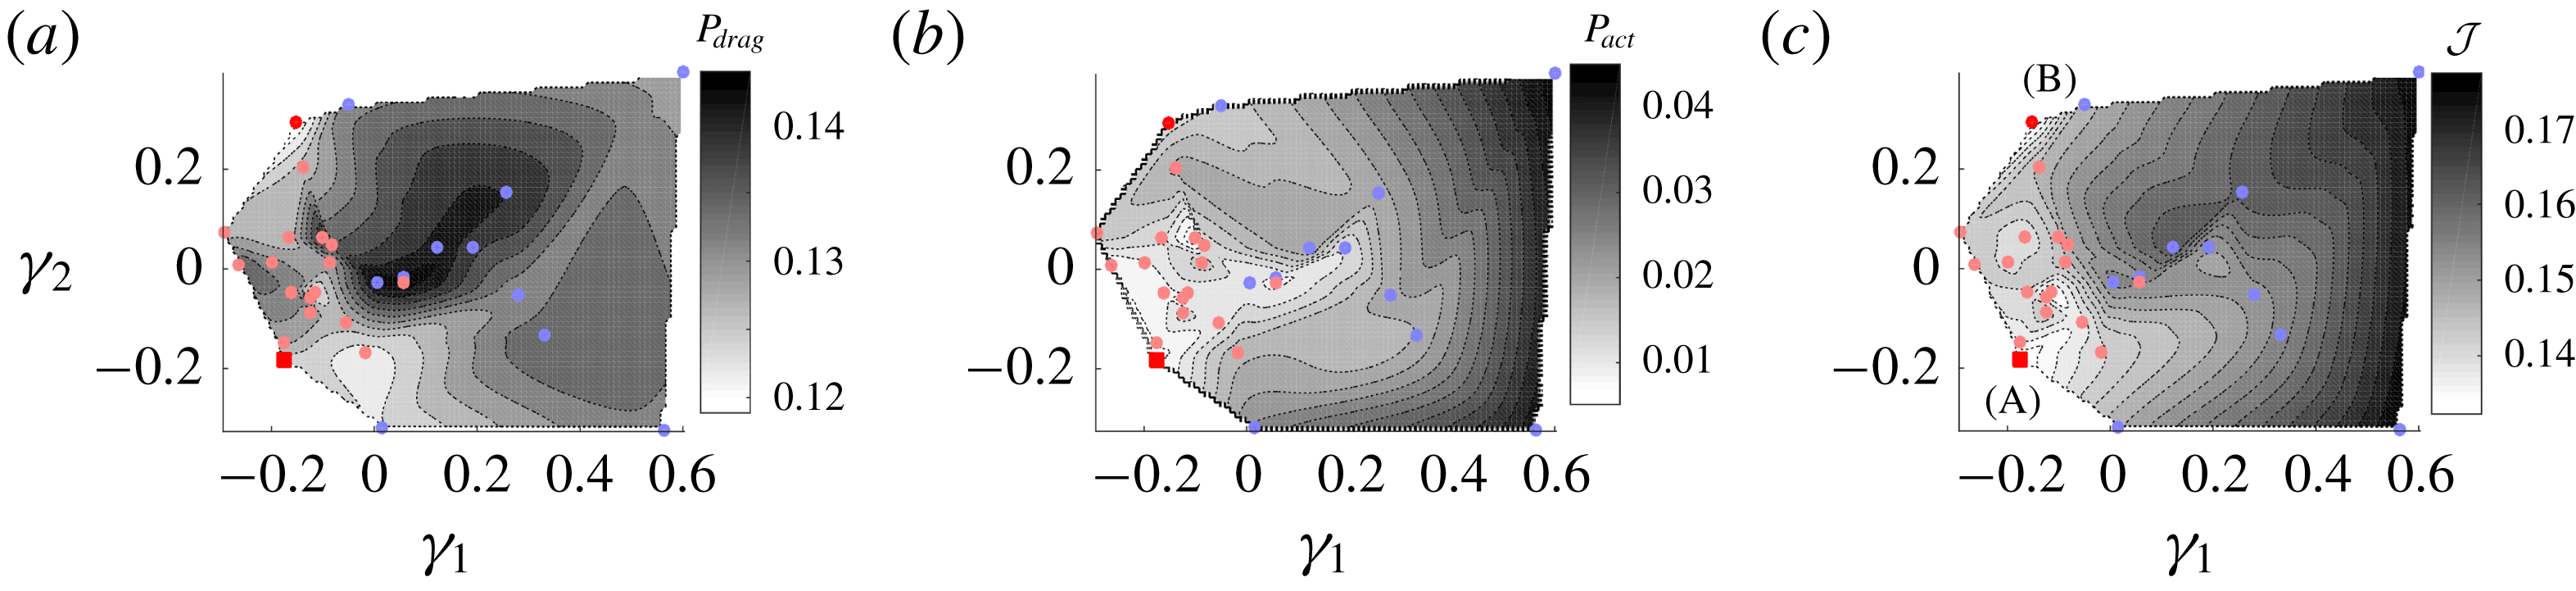
The control landscape over the minimization variables is analysed with MDS as shown in figure 15. Compared to the 2-D control effort, the proximity map is more complex for 3-D flow control. Although the actuation power
 $P_{act}$
increases for
 $\unicode[STIX]{x1D6FE}_{1}>0$
, the aerodynamic power
 $P_{drag}$
does not decrease correspondingly. The control landscape converges at the optimal location for the cost function
 ${\mathcal{J}}$
balancing both power considerations. Control cases A and B occupy different positions in the proximity map shown in figure 15. The cluster-based procedure is able to extract not only the global minima but also the local minima, highlighted from different regions of the proximity map. For further optimization of the control laws with lower
 $\overline{C}_{\unicode[STIX]{x1D707}}$
, a simplex consisting of
 $K+1$
cases near the current optimized case A can be chosen. For further optimization of the control laws with higher
 $\overline{C}_{\unicode[STIX]{x1D707}}$
and better aerodynamic performance, a simplex consisting of
 $K+1$
cases near case B can be chosen. The gradient-free searching algorithms for optimizing cluster control amplitudes explore different regions of the control landscape effectively. Thus, the proximity map can serve as a guide for tracking the performance of the flow control cases.
3-D flow control landscape, (a)
 $P_{drag}=P_{drag}(\unicode[STIX]{x1D6FE}_{1},\unicode[STIX]{x1D6FE}_{2})$
, (b)
 $P_{act}=P_{act}(\unicode[STIX]{x1D6FE}_{1},\unicode[STIX]{x1D6FE}_{2})$
and (c)
 ${\mathcal{J}}={\mathcal{J}}(\unicode[STIX]{x1D6FE}_{1},\unicode[STIX]{x1D6FE}_{2})$
, using multidimensional scaling. The transparent blue dots indicate initial simplex control cases and the red square symbol denotes the optimized case.

Using the same cluster control amplitudes
 $\{b_{k}^{opt}\}_{k=1}^{K}$
associated with the optimized case A, let us increase the feedback gain
 $\unicode[STIX]{x1D6FD}=1.6$
in equation (2.4) to evaluate the effect of increasing actuation input on control performance. This yields an increased
 $\overline{C}_{\unicode[STIX]{x1D707}}=0.016$
. This cluster-based control case with higher feedback gain will be referred to as case C in the following discussion. We also perform flow control with steady blowing at
 $\overline{C}_{\unicode[STIX]{x1D707}}=0.016$
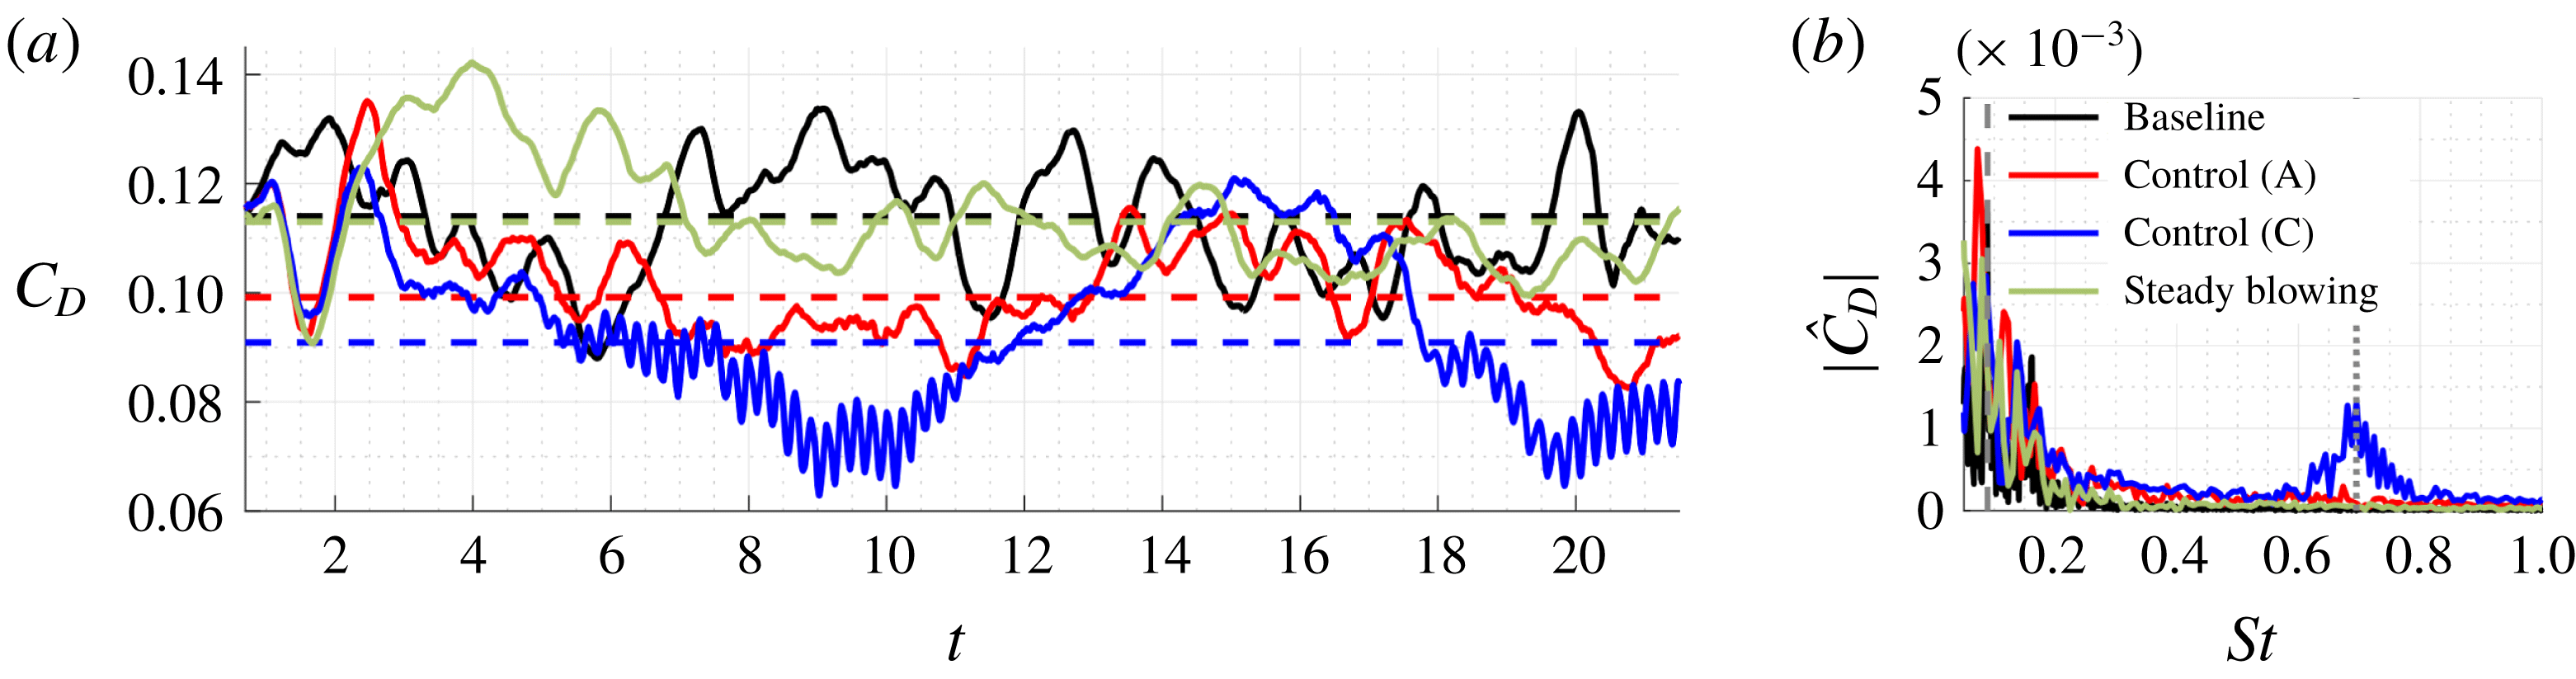
to compare with the cluster-based control cases A and C. The drag coefficient obtained in the three control cases is compared with the baseline as shown in figure 16(a). The black, red, blue and green dashed lines indicate the mean drag associated with the baseline, case A, case C and steady blowing, respectively. We obtain a
 $13\,\%$
drag reduction for case A and
 $20\,\%$
drag reduction for case C. We do not get any significant drag reduction with steady blowing. This is consistent with the work by Munday & Taira (Reference Munday and Taira2018), where it was shown that the time-averaged separated flow was not significantly modified with steady blowing at
 $\overline{C}_{\unicode[STIX]{x1D707}}=0.01$
and comparable drag reduction was achieved only at much higher
 $\overline{C}_{\unicode[STIX]{x1D707}}=0.021$
. Thus, the optimized cluster-based control laws, even with a lower
 $\overline{C}_{\unicode[STIX]{x1D707}}$
performs much better than steady blowing. It must be emphasized that the objective of the control strategy is to minimize power consumption. With that objective, we are able to achieve drag reduction in 3-D separated flows.
A spectral analysis of the drag coefficient is performed to highlight the associated amplitude and frequency range of forcing, as shown in figure 16(b). Here,
 $|{\hat{C}}_{D}|$
is the single-sided amplitude. For the optimized control case A, the forcing is applied in the range of wake frequencies with the peak at
 $St^{+}=0.0844$
, close to the dominant shedding frequency. We notice that the single-sided amplitude near the wake frequencies for this case is much higher compared to the steady blowing case. The drag reduction obtained in case A is comparable with open-loop periodic forcing at the wake frequency examined in the work by Amitay & Glezer (Reference Amitay and Glezer2002). Using a feedback control strategy yields a faster transient response for optimized control case A than the open-loop counterpart. For control case C, along with the wake frequencies, the dominant shear-layer frequency
 $St^{+}=0.695$
is triggered with the cluster-based feedback control. The increase in feedback gain associated with the optimized control amplitudes results in enhanced aerodynamic characteristics, observed from the resulting drag reduction in figure 16(a). The fact that the cluster-based control strategy is able to adaptively force the flow at characteristic frequencies, corresponding to fundamental instabilities of the baseline flow purely from the feedback of select observables, demonstrates the power of this data-based approach.
Comparison of baseline, the optimized 3-D flow control case A (
 $\overline{C}_{\unicode[STIX]{x1D707}}=0.0068$
), the control case C with higher feedback gain (
 $\unicode[STIX]{x1D6FD}=1.6,\overline{C}_{\unicode[STIX]{x1D707}}=0.016$
) and steady blowing (
 $\overline{C}_{\unicode[STIX]{x1D707}}=0.016$
). (a) Drag coefficient, (b) spectral analysis of drag data. The dashed lines in (a) indicate the mean drag values. The dashed line in (b) corresponds to the dominant shedding frequency and the dotted line corresponds to the shear layer frequency.

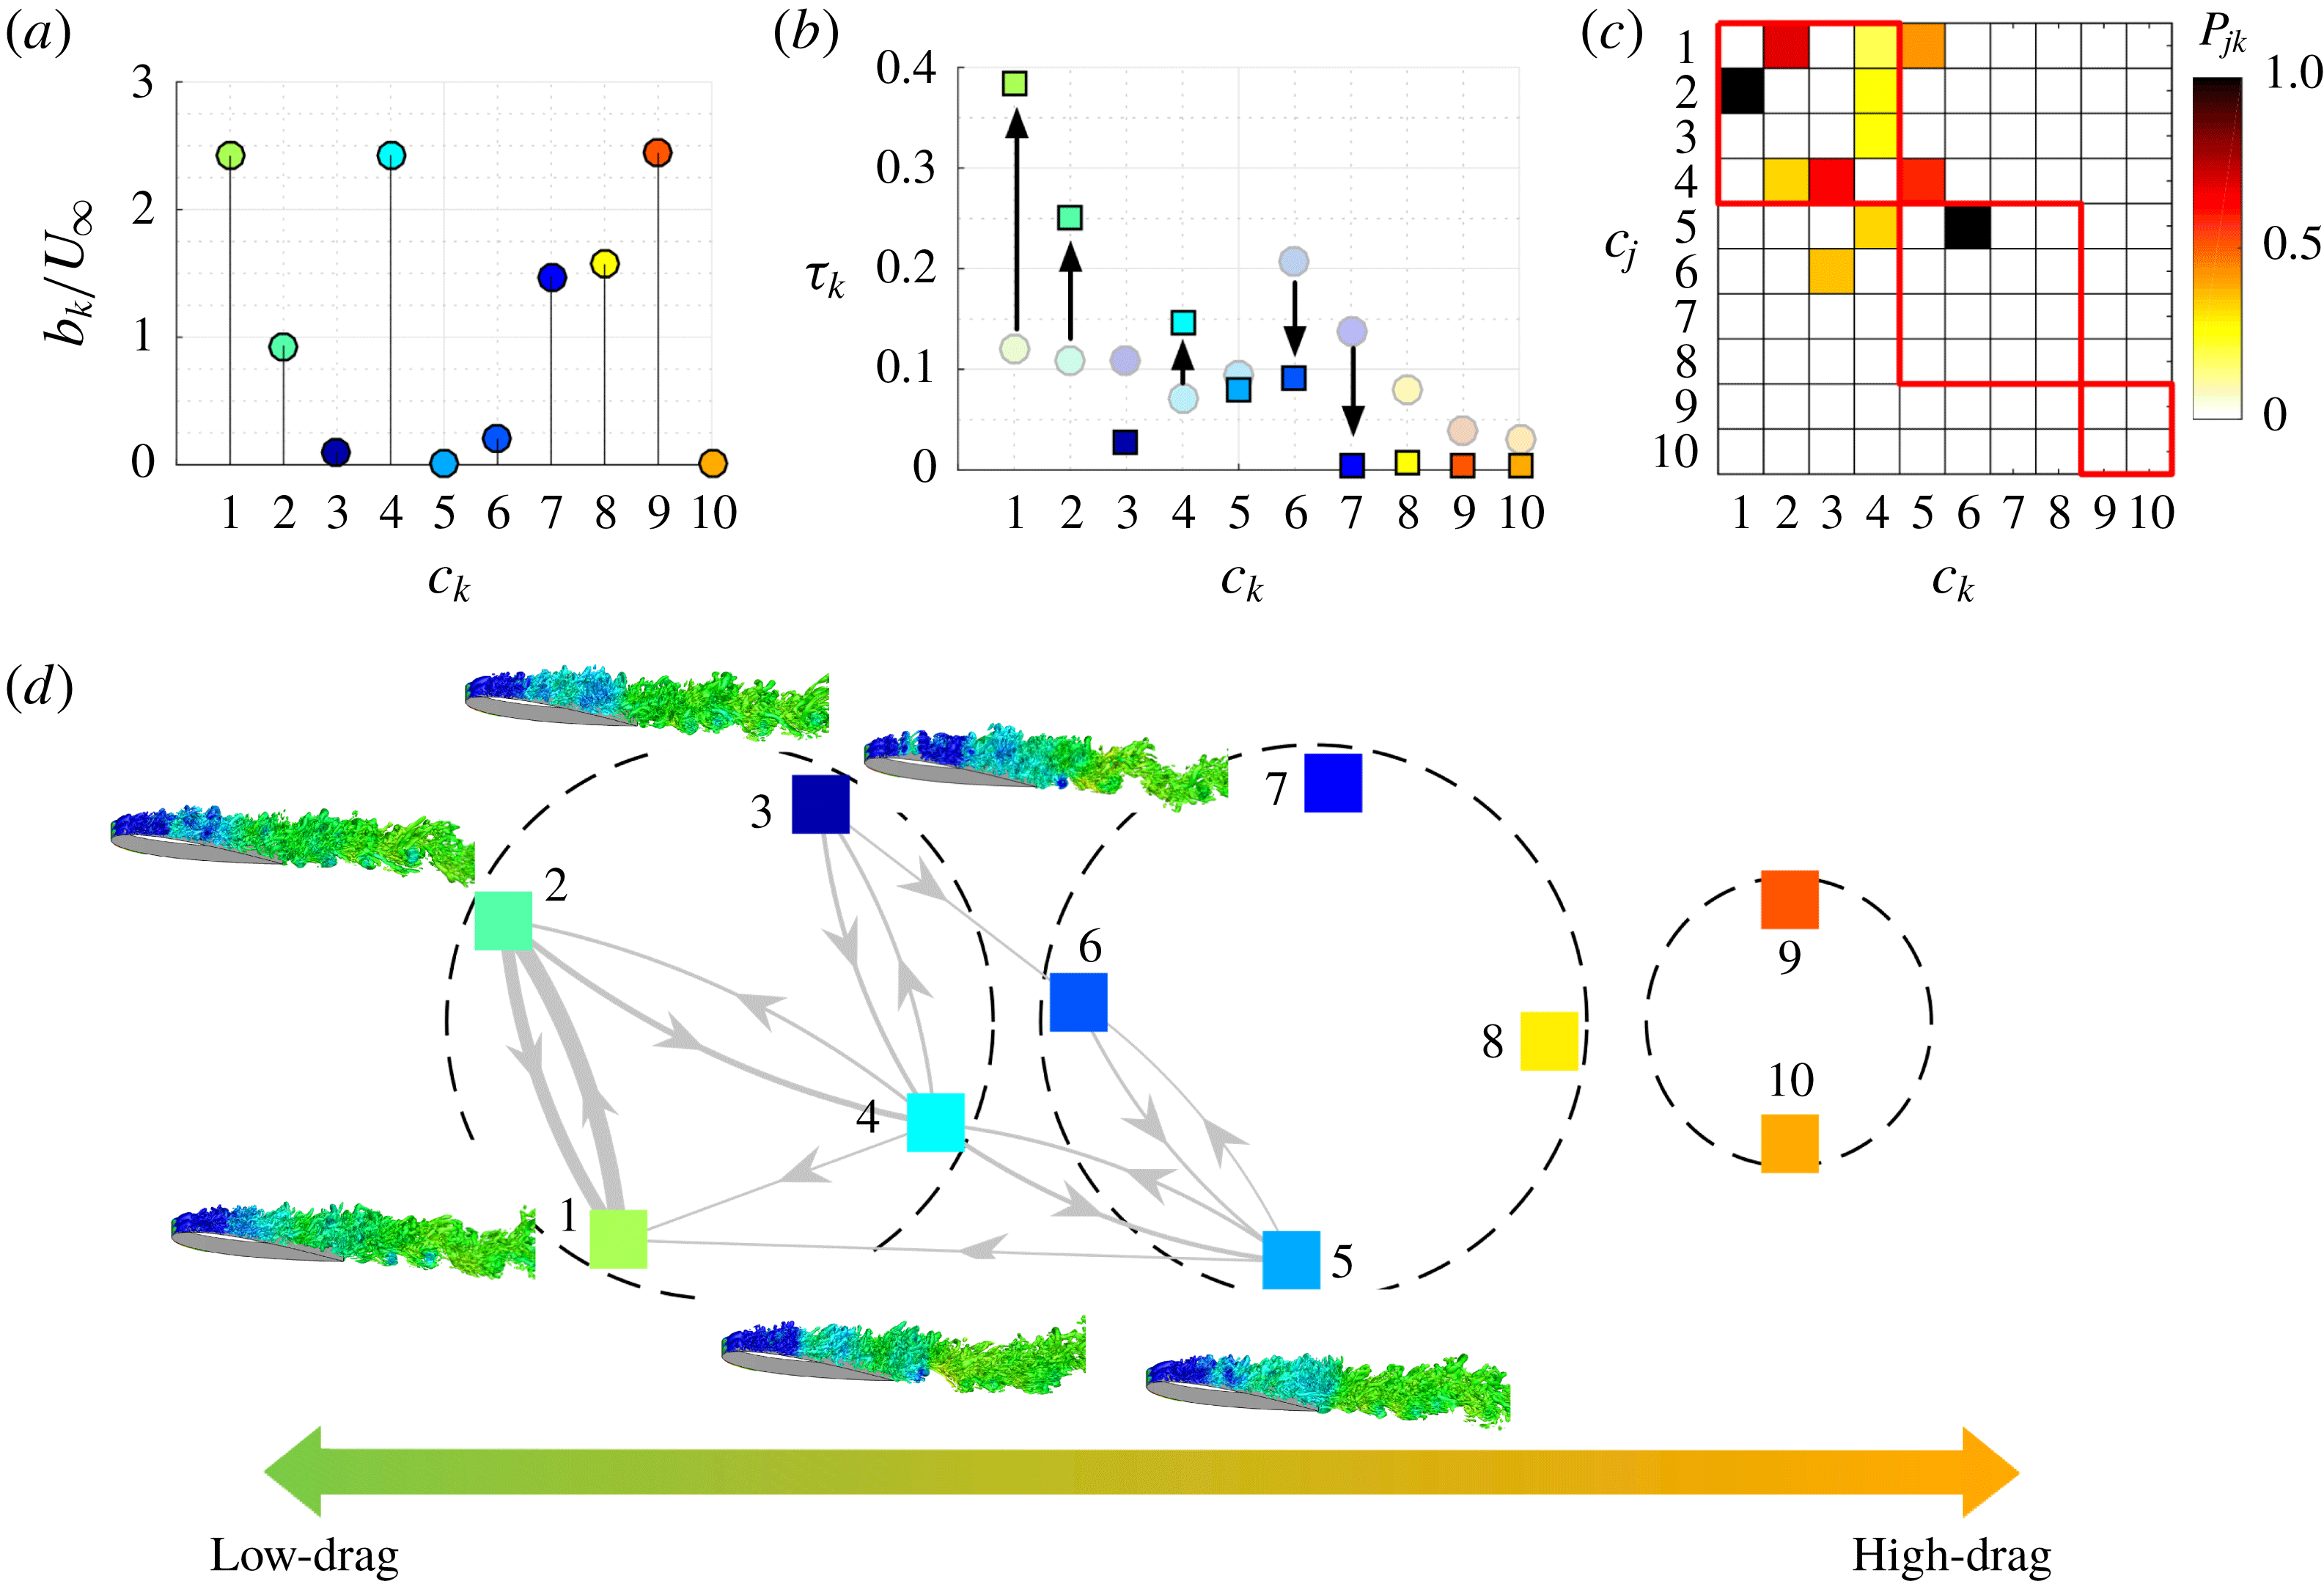
The cluster based control amplitudes
 $b_{k}$
corresponding to the optimized control case A is shown in figure 17(a). Only positive amplitudes are present which indicate that only blowing is introduced by all clusters as constrained in the optimization procedure. For this optimal case, we observe that high amplitudes of blowing are adopted for clusters
 $7$
,
 $8$
and
 $9$
, which is produced when the state trajectory moves towards the high-drag clusters. As a consequence, the vortices that build-up the low-pressure core, are pushed away from the suction surface before they are further strengthened over the prolonged formation time at clusters
 $9$
and
 $10$
. The present cluster-based control therefore limits the formation time of leading-edge vortices, ensuring the vortex shedding takes place over the time scale of the natural period while avoiding the intermittent occurrence of long-period shedding. Consequently, the cluster pathway is rerouted from the high-drag subset to clusters
 $5$
and
 $6$
, eventually redirecting the flow to low-drag cluster states, as confirmed in the Markov transition network in figures 17(c) and 17(d). As a result, the controlled flow spends extended times in the low-drag states of clusters
 $1$
,
 $2$
and
 $4$
, as shown in figure 17(b), achieving drag reduction.
Comparison of optimized 3-D flow control case A with baseline; (a) Cluster jet velocities (
 $b_{k}/U_{\infty }$
), (b) cluster probability
 $\unicode[STIX]{x1D70F}_{k}$
for baseline (shown in transparent round symbols) and controlled flows (shown in square symbols). (c) Cluster transitions for controlled case A, (d) Markov chain associated with optimally controlled flow.

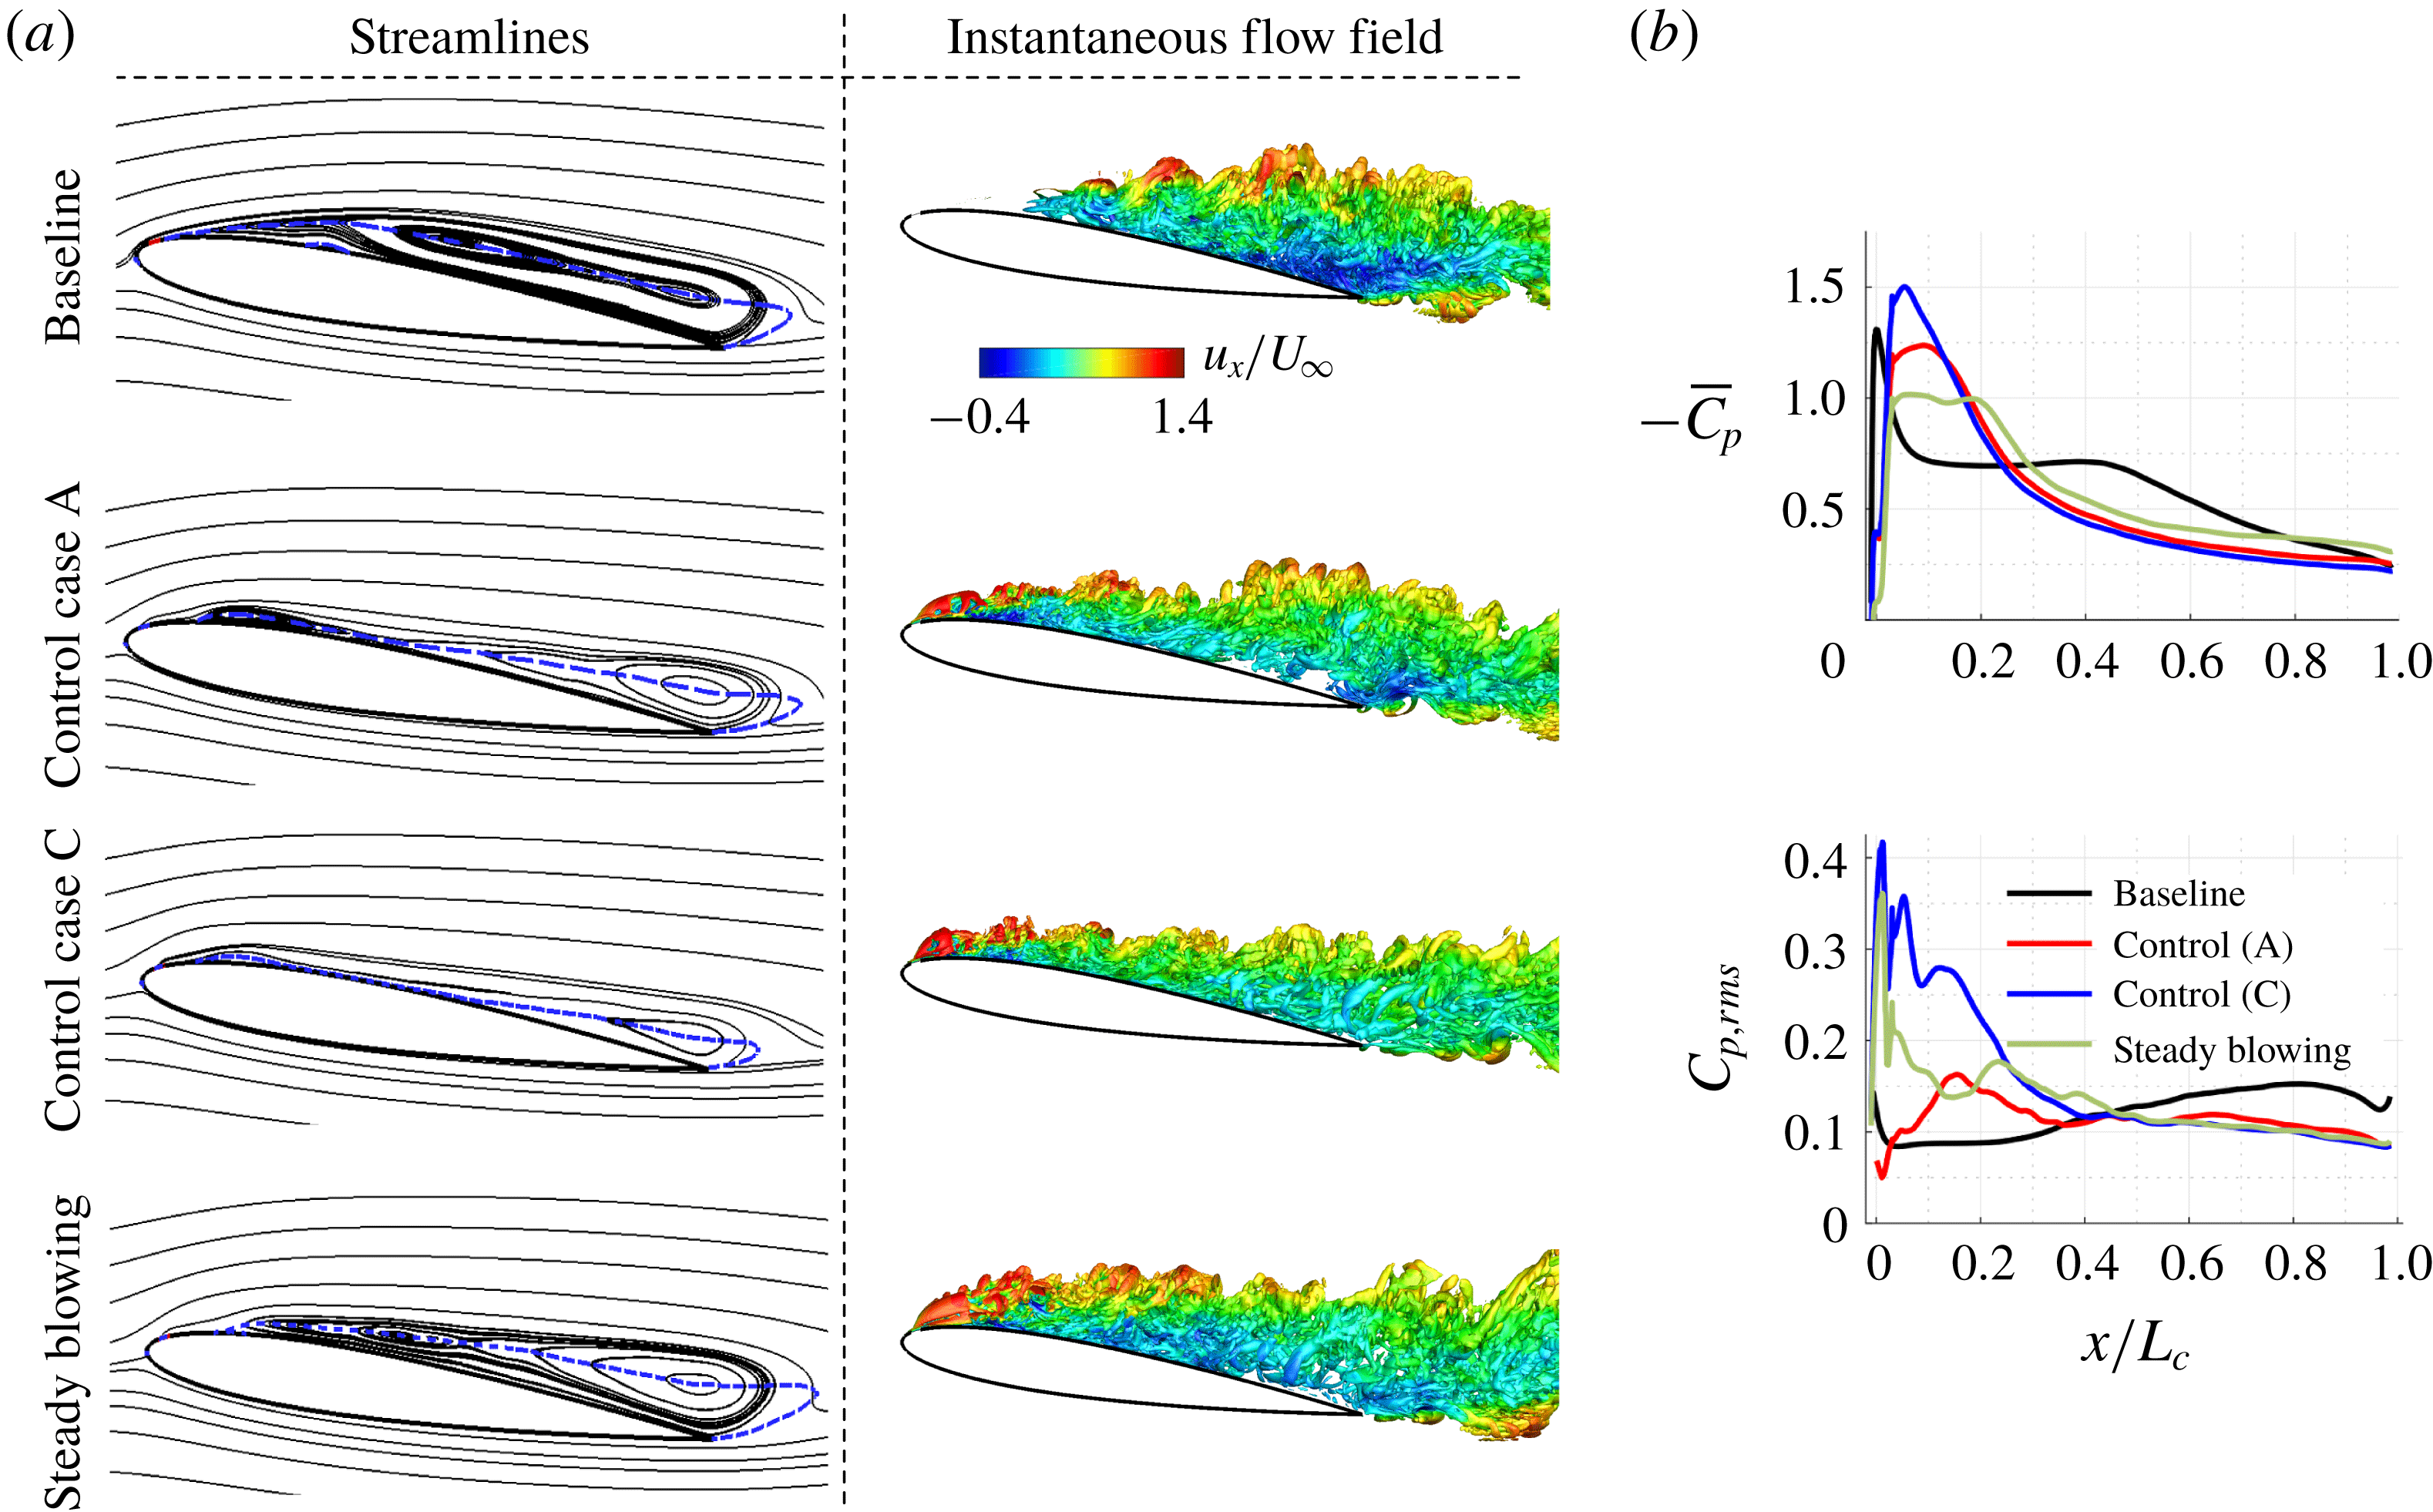
We also show the streamlines and instantaneous flow fields associated with the baseline, control cases A, C and steady blowing case in figure 18(a). The blue dashed lines indicate the contour lines corresponding to time- and spanwise-averaged streamwise velocity,
 $\bar{u}_{x}/U_{\infty }=0$
. This characterizes the extent of the separation region in the flow. For both control cases, the size of the separation bubble is reduced compared to the baseline flow. For case A, the flow reattaches near the mid-chord of the airfoil. However, in this case, the flow separates near the trailing edge. Streamwise velocity deficit upstream translates to this trailing edge separation. In the control case C, the size of the separated region is considerably reduced. The vortical structures in the flow field are highlighted by a level set of the
 $Q$
-criterion, which is coloured by the streamwise velocity component. The vortical perturbations triggered by unsteady forcing at shear-layer frequencies result in a break-up of spanwise vortices. Suppression of separation due to an accelerated laminar-turbulent transition over the separation bubble is obtained, which results from the break-up of spanwise vortices. The coherence in the wake originating from von Kármán vortical structures is correspondingly lost leading to entrainment of free-stream momentum and mixing, which is consistent with the findings in Greenblatt & Wygnanski (Reference Greenblatt and Wygnanski2000) and Yeh & Taira (Reference Yeh and Taira2019). The effectiveness of the cluster-based strategy can be highlighted by observing the time-averaged streamlines and instantaneous flow fields associated with the steady blowing case. Control case C reduces the separated region much more than the steady blowing case as it takes advantage of fundamental instabilities in the flow. It must be noted, however, that no a priori knowledge of such instabilities are provided for the flow control design.
Comparison of baseline, optimized control case A (
 $\overline{C}_{\unicode[STIX]{x1D707}}=0.0068$
), control case C with higher feedback gain (
 $\unicode[STIX]{x1D6FD}=1.6,\overline{C}_{\unicode[STIX]{x1D707}}=0.016$
) and steady blowing at
 $\overline{C}_{\unicode[STIX]{x1D707}}=0.016$
; (a) time-averaged streamlines and instantaneous flow field (highlighted by
 $Q$
-criterion) coloured by streamwise velocity. The blue dashed lines indicate the contour line of zero time- and spanwise-averaged streamwise velocity. (b) Time-averaged and root-mean-square fluctuation of coefficient of pressure distributions on suction side of the airfoil.

In both control cases A and C, we observe a low-frequency modulation in the drag coefficient. This modulation causes an increased unsteadiness in the drag force. These have been observed before in pulse-modulated actuated studies reported in Amitay & Glezer (Reference Amitay and Glezer2006). Such modulation results from a sub-optimal pressure recovery closer to the trailing edge. Previous studies with model-based feedback control have shown that suppressing this low-frequency modulation can yield additional performance benefits (Nair, Brunton & Taira Reference Nair, Brunton and Taira2018). There is an opportunity for a model-free extension to suppress the low-frequency modulation using the current feedback control strategy using additional clusters (G-Michael, Gunzburger & Peterson Reference G-Michael, Gunzburger and Peterson2018). We also want to emphasize that complete flow reattachment is not the objective of the present work. The cluster-based control strategy is primarily designed to minimize aerodynamic power consumption. The optimized control laws yielded drag reduction and the reduction in the size of the separation bubble as additional benefits of the flow control strategy.
The time average and root-mean-square fluctuations of the pressure coefficient distributions over the suction surface of the airfoil are shown in figure 18(b). For control case C, the average suction pressure is the highest at
 $x/L_{c}=0.1$
. For both control cases, the flat pressure region disappears indicating an accelerated laminar-turbulent transition. In contrast, for steady blowing, we see a flat pressure region indicating a slower laminar-turbulent transition. The accelerated roll-up and transition can be observed by peaks in the root-mean-square fluctuations of the pressure coefficient over the suction surface around
 $x/L_{c}=0.15$
.
With 3-D flow control, we minimize the power consumption using the present cluster-based control strategy. As demonstrated, the optimized cluster-based control amplitudes lead to a transformed transition network, essentially re-routing trajectories to desirable state-space regions. The model-free, iterative optimization of the global control law over the coarse-grained feature space leads to optimized cluster transitions and cluster probabilities that minimize the aerodynamic power consumption. The approach can easily be extended to achieve other desired performance objectives. Moreover, only the information of the feature space trajectories is required for both control and optimization of the feedback control laws.
5 Concluding remarks
We propose a feedback control strategy applying data-based clustering and optimization. The approach is demonstrated for 2-D and 3-D separated flows over a NACA 0012 airfoil at an angle of attack
 $\unicode[STIX]{x1D6FC}=9^{\circ }$
, Reynolds number
 $Re=23\,000$
and Mach number
 $M_{\infty }=0.3$
. The main objective of this study is to develop a model-free flow characterization technique and perform optimization of a global feedback control law, particularly to minimize the power consumption for aerodynamic flight.
The basic steps of the approach consist of feature space selection, clustering analysis and optimization of control laws. The feature space is defined by the aerodynamic forces,
 $s^{b}(t)=(C_{L}(t),{\dot{C}}_{L}(t),C_{D}(t))$
, collected from the baseline (unforced) LES. Centroid-based clustering analysis is performed to partition the feature space trajectories into few discrete clusters using the
 $k$
-means algorithm. The clusters segregate the characteristic phase regimes of the flow. The Markov transition dynamics between clusters characterize the coarse-grained, probabilistic dynamics of post-stalled flows. The different phases of vortex shedding can be analysed by the characteristic flow fields associated with each cluster. Using a directed modularity maximization algorithm, groups of clusters (subsets) are extracted. These subsets divide the baseline trajectory into low, intermediate and high-drag states. For the Markov chain network associated with the 2-D and 3-D baseline flows, switching clusters are identified. These clusters are associated with key transitions from low- to high-drag states. A modification of fundamental cluster transitions in a model-free manner is sought, which can be interpreted as a re-routing of trajectories associated with the baseline configuration to maximize desired performance objectives.
Control amplitudes (blowing or suction jet velocity) are assigned to each cluster centroid for control. These cluster control amplitudes are interpolated over the entire low-dimensional feature space. A measurement of the current position on the trajectory relative to the cluster centroids is used to deduce a global control law. The control parameters in each cluster are then iteratively optimized to minimize power consumption. At each iteration step, the control law with the updated actuation parameters is evaluated in the simulation and the associated value of the cost function penalizing aerodynamic power and actuation power is determined. The optimization procedure yields a set of control laws iteratively minimizing the cost functional. This optimization would be prohibitively expensive if performed on the full state-space; in contrast, our approach scales with the number of clusters. For 3-D flow control, additional constraints were added to the optimization procedure to determine the unsteady feedback control laws for pure blowing.
In the 2-D flow control effort, a drag reduction of
 $41\,\%$
is achieved with the optimized feedback control law along with complete flow reattachment. The optimized cluster-based control law involves suction at the low-drag clusters and blowing at the intermediate and high-drag clusters. The optimized control law in 3-D flow control achieves a
 $13\,\%$
drag reduction. This control law primarily operates in the range of wake frequencies associated with vortex shedding behaviour. Drag reduction was accompanied by a decrease in the turbulent kinetic energy in the flow. Upon increasing the feedback gain associated with the optimized cluster amplitudes, vortical perturbations at forcing frequencies corresponding to the shear-layer instabilities are triggered in addition to the dominant wake frequencies. Although the actuation power increases with this feedback gain, an enhanced break-up of the spanwise vortical structures is obtained, yielding a
 $20\,\%$
drag reduction. Both cluster-based control cases perform significantly better than control with steady blowing.
The cluster-based control approach reduces the formation time associated with the leading-edge vortices. It also avoids the intermittent bursts to high-drag clusters which are associated with long-periodic shedding due to blowing at the high-drag cluster states and switching clusters. For both 2-D and 3-D optimized control cases, the cluster probabilities, i.e. the probability of the flow to reside in a particular cluster, of the low-drag states are increased with control and the probabilities associated with the high-drag states are decreased. A posteriori analysis of the transition dynamics reveals that the baseline Markov transition network is optimally modified with control to allow transitions that result in control of flow separation and drag reduction. The optimization of the cluster-based control laws is typically achieved in a limited number of runs, which scales with the number of discrete clusters. Using proximity maps, similarity between the iterative control laws can be examined and both local and global minima can be identified.
In summary, the feedback control design using data-driven clustering provides a general, model-free and automated formulation for flow control. The proposed cluster-based control is geared towards computational fluid dynamics as it allows for the self-learning of a general smooth control law for a nonlinear actuation dynamics in only few dozen simulations. The computational load is small as compared to optimal Navier–Stokes-based control based on an assumed linearized dynamics. The learning time may also be contrasted with machine learning control (MLC) based on genetic programming requiring thousands of runs. Intriguingly, MLC simulations and experiments (Noack Reference Noack, Zhou, Kimura, Peng, Lucey and Huang2019) indicate that most feedback mechanisms and associated control are simple and react on well-defined events or on oscillatory coherent structures. These findings encourage cluster-based control also for experiments. The feature space, an evident design parameter, can be constructed from the sensor signals and would be identical in case of direct sensor feedback. In case of realizations of (N)ARMAX-based control strategies, time-delay coordinates may need to be included (Hervé et al. Reference Hervé, Sipp, Schmid and Samuelides2012). Also, the number of centroids may need to be larger in case of more complex actuation mechanisms, such as the suppression of multiple Rossiter modes in cavity flow. There is a huge untapped potential for cluster-based control, even for broadband turbulence, in designing the feature space and optimizing the initial conditions among others. The cluster-based approach combines the modern-day computing capabilities with data-driven techniques and can elevate future flow control efforts.
Acknowledgements
A.G.N., C.-A.Y., S.L.B. and K.T. are grateful for the support given by the U.S. Air Force Office of Scientific Research (award no. FA9550-16-1-0650; Program Manager: Dr D. R. Smith). A.G.N., C.-A.Y. and K.T. acknowledge the computational resources provided by the High Performance Computing Modernization Program at the U.S. Department of Defense and the Research Computing Center at the Florida State University. A.G.N., B.R.N. and K.T. also thank the international exchange programme supported by U.S. Air Force Office of Scientific Research. B.R.N. acknowledges the support from the public grants overseen by the French National Research Agency (ANR) as part of the ‘Investissement d’Avenir’ programme, through the ‘iCODE Institute project’ funded by the IDEX Paris-Saclay (ANR-11-IDEX-0003-02) and ANR grants (‘ACTIV_ROAD’ and ‘FlowCon’). E.K. gratefully acknowledges support by the Washington Research Foundation, Moore Foundation (award no. 2013-10-29), Sloan Foundation (award no. 3835) and the University of Washington eScience Institute.
Appendix A
To computationally examine the separated flows, LES are performed using a compressible flow solver CharLES (Brès et al.
Reference Brès, Ham, Nichols and Lele2017). The solver uses a second-order accurate finite-volume scheme and a third-order Runge–Kutta method for time integration. The streamwise, normal and spanwise coordinate directions are denoted by
 $x,y$
and
 $z$
, respectively. The computational domain is chosen to be
 $x/L_{c}\in [-19,26],~y/L_{c}\in [-20,20],~z/L_{c}\in [-0.1,0.1]$
, following the work by Yeh, Munday & Taira (Reference Yeh, Munday and Taira2017). To perform LES, Vremen’s subgrid-scale model (Vreman Reference Vreman2004) is utilized. Henceforth,
 $u_{x},u_{y}$
, and
 $u_{z}$
stand for streamwise, normal and spanwise velocity, respectively. We apply Dirichlet boundary conditions of
 $[\unicode[STIX]{x1D70C},u_{x},u_{y},u_{z},p]=[\unicode[STIX]{x1D70C}_{\infty },U_{\infty },0,0,p_{\infty }]$
at the inflow. Here,
 $\unicode[STIX]{x1D70C}_{\infty }$
is the free stream density and
 $p_{\infty }$
is the free stream pressure. A far-field boundary with a sponge zone is specified near the outlet over
 $x/L_{c}\in [16,26]$
to avoid numerical reflections (Freund Reference Freund1997). A no-slip adiabatic boundary condition is prescribed over the airfoil. Spanwise periodicity is enforced in the 3-D simulations. A structured mesh consisting of
 $32$
million volume elements is utilized for the 3-D LES. The 2-D LES consider the same mesh discretization in the
 $x-y$
plane with
 $0.32$
million volume elements.
The computational domain (
 $x-y$
plane) and mesh are shown in figure 2(a) (left). The streamlines for the time-averaged 3-D baseline separated flow is shown in figure 2(a) (right). The chordwise direction is denoted by
 $\tilde{x}$
. We notice the presence of a recirculation bubble in this separated flow. To characterize the extent of the separation region, a contour line of time- and spanwise-averaged streamwise velocity,
 $\bar{u}_{x}/U_{\infty }=0$
, is shown by the blue dashed line, which extends over the length of the airfoil. Here,
 $\bar{q}$
indicates time-average (mean) of flow variable
 $q$
. The instantaneous flow field and TKE for 3-D baseline flow are shown in figure 2(b). The TKE is defined as
 $\overline{({u_{x}^{\prime }}^{2}+{u_{y}^{\prime }}^{2}+{u_{z}^{\prime }}^{2})}/U_{\infty }^{2}$
, where
 $u^{\prime }\equiv u-\bar{u}$
. The vortical structures in the flow field are highlighted by a level set of the
 $Q$
-criterion (Hunt, Wray & Moin Reference Hunt, Wray and Moin1998), coloured by the streamwise velocity (
 $u_{x}$
). The laminar separation at the leading edge forms a shear layer that rolls up and evolves into spanwise vortical structures. Turbulent kinetic energy increases in this region of spanwise vortex formation reaching a maximum value at
 $x/L_{c}\approx 0.55$
.
The drag coefficient
 $C_{D}$
, lift coefficient
 $C_{L}$
, and pressure coefficient
 $C_{p}$
are defined as
 $$\begin{eqnarray}C_{D}=\frac{F_{x}}{\frac{1}{2}\unicode[STIX]{x1D70C}_{\infty }U_{\infty }^{2}A},\quad C_{L}=\frac{F_{y}}{\frac{1}{2}\unicode[STIX]{x1D70C}_{\infty }U_{\infty }^{2}A},\quad C_{p}=\frac{p-p_{\infty }}{\frac{1}{2}\unicode[STIX]{x1D70C}_{\infty }U_{\infty }^{2}},\end{eqnarray}$$
where
 $F_{x}$
and
 $F_{y}$
are the drag and lift forces on the airfoil,
 $A=L_{c}w$
is the projected area,
 $w$
is the width of the airfoil, and
 $p$
is the pressure at the airfoil surface. For validation of the numerical set-up, we compare the time-averaged coefficient of pressure distribution (
 $\overline{C}_{p}$
) for the 3-D baseline separated flow with Kojima et al. (Reference Kojima, Nonomura, Oyama and Fujii2013) in figure 2(c), where agreement can be seen. In particular, a strong negative pressure peak on the suction side near the leading edge is visible followed by a plateau in pressure distribution. This pressure plateau indicates the presence of the separation bubble (Benton & Visbal Reference Benton and Visbal2018). For the 2-D baseline simulation, the mean drag
 $\overline{C}_{D}=0.127$
and the mean lift
 $\overline{C}_{L}=0.818$
. For the 3-D baseline simulation,
 $\overline{C}_{D}=0.114$
and
 $\overline{C}_{L}=0.557$
. The separation locations for 2-D and 3-D flows are
 $x_{s}/L_{c}=0.032$
and
 $0.037$
, respectively.
Appendix B
As we have
 $K$
cluster control amplitudes to optimize, visualization of the control landscape over all the clusters can be very insightful but also challenging. The MDS visualizes the organization of high-dimensional objects by finding a low-dimensional subspace, which optimally preserves the distances between objects in the high-dimensional space (Young & Householder Reference Young and Householder1938). Here, we employ MDS to visualize the similarity between control laws by finding a low-dimensional embedding maintaining pairwise distances between them (Kaiser et al.
Reference Kaiser, Noack, Spohn, Cattafesta and Morzyński2017b
; Kaiser, Li & Noack Reference Kaiser, Li and Noack2017a
). In addition to measuring the similarity (or dissimilarity) between the evaluated control laws, the visualization helps in tracking of the search directions tending towards the optimum of our objective. The pairwise distances in MDS are defined as
 $$\begin{eqnarray}D_{ij}=\sqrt{\frac{1}{2}\mathop{\sum }_{t=1}^{T}[b(b_{k}^{i},s^{i}(t))-b(b_{k}^{\,j},s^{i}(t))]^{2}+\frac{1}{2}\mathop{\sum }_{t=1}^{T}[b(b_{k}^{i},s^{j}(t))-b(b_{k}^{\,j},s^{j}(t))]^{2}},\end{eqnarray}$$
where
 $b$
is defined by equation (2.4). The superscripts
 $i$
and
 $j$
indicate the iteration number corresponding to the control cases in the optimization procedure. Multidimensional scaling then aims to find a set of points
 $\{\unicode[STIX]{x1D6FE}^{i}\}_{i=1}^{N_{c}}$
, where
 $N_{c}$
is the total number of evaluated control laws, in a low-dimensional subspace such that
 $\Vert \unicode[STIX]{x1D6FE}^{i}-\unicode[STIX]{x1D6FE}^{j}\Vert \approx D_{ij}$
is approximated in a least-squares sense. Here, we find the two-dimensional subspace,
 $\unicode[STIX]{x1D6FE}^{i}=\{\unicode[STIX]{x1D6FE}_{1},\unicode[STIX]{x1D6FE}_{2}\}$
, for visualization purposes.
To extract the two-dimensional coordinate subspace, we construct
 $B=-\frac{1}{2}CD^{2}C$
using a centring matrix
 $\unicode[STIX]{x1D63E}=\unicode[STIX]{x1D644}-(1/M)11^{\prime }$
, where
 $M$
is the number of control cases. Here,
 $\unicode[STIX]{x1D644}$
is the identity matrix and
 $1$
is column array of all ones of size M. We then determine
 $(\unicode[STIX]{x1D6FE}_{1},\unicode[STIX]{x1D6FE}_{2})=V\unicode[STIX]{x1D6EC}^{1/2}$
, where
 $\unicode[STIX]{x1D6EC}$
and
 $V$
contain the first two eigenvalues and eigenvectors of
 $B$
. In general, we can find a
 $m$
-dimensional subspace retaining the first
 $m$
eigenvalues and eigenvectors. This proximity map evaluates the relative performance of each control case with iterative optimization based on the variations in
 $\unicode[STIX]{x1D6FE}_{1}$
and
 $\unicode[STIX]{x1D6FE}_{2}$
variables, which capture the two directions in the identified subspace. Moreover, these proximity maps can accelerate the optimization process by estimating the performance of untested control laws as proposed by Kaiser et al. (Reference Kaiser, Li and Noack2017a
). Beyond the analysis of the optimization procedure, these proximity maps can help accelerate the control law optimization by estimating the expected performance of control laws without evaluating them, which can then be discarded if a control law with a similar performance has already been evaluated.