Introduction
Undernutrition in infants under 2 years of age remains a major public health issue, particularly in low- and middle-income countries (LMICs).Reference Black, Victora and Walker1,Reference Umeta, West and Verhoef2 The 2011 United Nation Children&s Fund (UNICEF) Global Nutrition report indicated that more than 311 million children (32% of all children) under 5 years of age were undernourished. Globally, more than four million children died within a year of their birth due to inadequate nutrition.3 In addition, poor infant nutrition has been shown to be responsible for more than 40% of deaths in children younger than 5 years, particularly during their first month of life.Reference Black, Victora and Walker1 The adverse effects of infant undernutrition include physical disabilities,Reference Said-Mohamed and Pettifor4 poor school attendance,Reference Black, Victora and Walker1 diabetes,Reference Black, Victora and Walker1 hypertension and cardiovascular disease,Reference Bouvier, Papart and Wanner5 which may affect the subsequent generation.Reference Black, Victora and Walker1,Reference Victora, Adair and Fall6 Therefore, undernutrition may have negative long-term consequences for a country’s economic growth and development.3
Sixty percent of all undernutrition occurs in sub-Saharan Africa (SSA) and South Asia.3 The impact of undernutrition on child growth and development starts in utero. Maternal undernutrition has been associated with poor foetal growth,Reference Black, Victora and Walker1,Reference Richter, Orkin and Roman7,Reference Wrottesley, Lamper and Pisa8 which may result in low birth weight (LBW, weight at birth less than 2500 g),Reference Black, Victora and Walker1 small for gestational age (SGA, newborns weighing less than the 10th percentile of a sex-specific reference population) and preterm birth (PTB, children born before 37 gestational weeks).3,Reference Lee, Katz and Blencowe9 In 2016, UNICEF reported that 15% (20 million) of newborns worldwide had LBW and 10% (15 million) PTB.3 In 2010, 32.4 million newborns worldwide were SGA.Reference Lee, Katz and Blencowe9 The prevalence of SGA was 27% in LMICs, with SSA having one of the highest prevalence.Reference Lee, Katz and Blencowe9–Reference Lee, Kozuki and Cousens11 Studies in LMICs have shown that LBW, SGA and PTB are the predictors of infant undernutrition in children below the age of 2 years.Reference Budree, Goddard and Brittain12–Reference Christian, Lee and Donahue Angel15 Undernourished infants may present with underweight (weight-for-age (WAZ) less than −2 standard deviation (−2SD) of the median of the World Health Organization (WHO) growth standard) or wasting (weight-for-height (WHZ) less than −2SD of the median of the WHO growth standard) which are sometimes combined with a third form of undernutrition, stunting (height-for-age (HAZ) less than −2SD of the median of the WHO growth standard).Reference Black, Victora and Walker1,3 Globally, among children under 5 years of age in 2011, 25.9% were stunted, 15.7% were underweight and 8% were wasted.Reference Bouvier, Papart and Wanner5,Reference Christian, Lee and Donahue Angel15 In 2016, Africa had the second largest prevalence (31.6%) of undernutrition in children under 5 years of age in the world, and the absolute number of affected children is continuing to increase.3
To formulate strategies to prevent and reduce maternal and infant undernutrition in SSA, a major public health concern in the region, it is critical to understand the contextual factors associated with LBW, PTB, SGA, stunting, wasting and underweight. The period between conception and 2 years of age, the first thousand days, has been shown to be an opportune time for interventions such as immunisation, deworming, nutrient supplementation (vitamin A, iodine) that optimise child growth and development.Reference Bhutta, Das and Rizvi16 However, the prevalence of undernutrition varies between SSA countries, probably due to different factors including socio-economic status (SES), cultural and political landscapes.3 The UNICEF causal framework for maternal and child undernutrition, the first version of which was described in 1990, outlined that infant undernutrition is associated with basic, underlying and immediate factors.3,17 Maternal demographic characteristics and socio-economic factors have been identified as basic causes of undernutrition.3 Empirical studies in LMICs have reported associations between household and maternal demographic characteristics and SES factors with stunting in preschool children (between 2 and 5 years of age).Reference Efevbera, Bhabha, Farmer and Fink18 Maternal education,Reference Debela, Demmler, Rischke and Qaim19,Reference Setswe20 maternal occupation,Reference Hien and Hoa21 household povertyReference Richter, Orkin and Roman7,Reference Engle22,Reference Leslie and Pawloski23 and marital statusReference Efevbera, Bhabha, Farmer and Fink18 have been shown to be associated with adverse birth outcomes and child undernutrition.Reference Black, Victora and Walker1 However, most studies in SSA report those associations in children under 5 years of age as a group, overshadowing evidence during the first thousand days period. In addition, the directions of the associations between the various SES factors and infant undernutrition are not consistent throughout the studies in SSA. Therefore, we undertook a systematic review of the literature to summarise the findings on the associations between maternal demographics and household SES factors and LBW, PTB, SGA, stunting, wasting and underweight in children under 2 years of age in SSA.
Methods
Protocol and registration
This systematic review followed the Preferred Reporting Items for Systematic reviews and Meta-Analyses (PRISMA) guidelines.Reference Moher, Liberati, Tetzlaff and Altman24,Reference Liberati, Altman and Tetzlaff25 The protocol was registered under the International prospective register of systematic reviews (PROSPERO, https://www.crd.york.ac.uk/prospero/#myprospero, number CRD42018076828).
Eligibility criteria
We considered studies published between 1990 and June 2018, which investigated the associations between maternal socio-demographic characteristics and household SES factors with birth outcomes and nutritional status of children under 2 years of age, in 52 SSA countries (Supplementary sheet S1).
Data sources
Studies included in this review were obtained from three databases: PubMed, ScienceDirect and Scopus. For studies that were not sourced through these databases, we contacted the corresponding authors to request a copy of the original publication.
Search strategy and study selection
The following combination of category of keywords was used to search for eligible studies: maternal demographic characteristics and household SES factors (maternal education, maternal occupation, maternal marital status, maternal income and household wealth) and birth outcomes and child undernutrition (LBW or SGA or PTB or stunting or wasting or underweight or undernutrition) and 52 SSA countries. We sequentially screened titles, abstracts and the full text to identify studies that matched our inclusion and exclusion criteria. The study search and selection were performed separately by two co-authors (CBN and DM) and conflicts were resolved by a third co-author (RS-M).
Data
Maternal socio-demographic characteristics and household socio-economic factors
In accordance with the UNICEF conceptual framework,3 we considered the following maternal socio-demographic characteristics and household SES factors: maternal education, maternal occupation, maternal income, maternal marital status and household wealth. Maternal education was measured as educational milestones, qualifications attained or literacy level.Reference Howe, Galobardes and Matijasevich26 In LMICs, repeating school years is considered the most appropriate measure for education level of individuals.Reference Howe, Galobardes and Matijasevich26 Maternal marital status referred to the civil status of each mother in relation to the marriage laws in the country under consideration.27 Maternal income and maternal occupation in LMICs are more difficult to measure because of the presence of an informal economy, self-employment and seasonal activity. Similarly, occupation was measured by informal employment and domestic work.Reference Howe, Galobardes and Matijasevich26 Household wealth index (HWI) was based on ownership of a range of durable assets, household measures of SES characteristics or access to basic services such as health or education.Reference Howe, Galobardes and Matijasevich26
Birth outcomes
The following birth outcomes were considered: LBW, SGA and PTB. PTB or prematurity was defined as a baby born before 37 completed gestational weeks or 259 days of pregnancy.Reference Lee, Katz and Blencowe9,Reference van den Broek, Ntonya, Kayira, White and Neilson28 LBW was defined as birth weight less than 2500 g regardless of gestational age.3 Newborns classified as SGA were defined as those whose birth weight was below the 10th percentile when compared to the 1991 US national reference populationReference Black29 or the WHO standard curve.Reference Lee, Katz and Blencowe9,Reference Katz, Lee and Kozuki30
Undernutrition in children between birth and 2 years of age
The following categories of undernutrition were considered: stunting, wasting and underweight. Stunting was defined as children with length-for-age/HAZ adjusted for sex, less than −2SD of the median of the WHO growth standard curve.31 Wasting and underweight were defined as WHZ and WAZ less than −2SD of the median of the WHO growth standard curve, respectively.31
Synthesis of results
We extracted the following data from each study included in this systematic review: author names, year of publication, study aims, country, study design, study setting, participant’s age, study sample size, SES factors, growth outcomes and quality of evidence.
Data collection process and summary measures
Data were extracted separately by two co-authors (BN and DM) and conflicts were resolved by a third co-author (RS-M). Data extraction was done independently by the first and second authors. Odds ratios (ORs) and/or adjusted odds ratios (aORs), relative risk and/or adjusted relative risk and related confidence intervals (CIs) were extracted for each association of interest.
Quality appraisal and risk of bias for primary studies
The quality of the studies included in this systematic review was assessed using the GRADE approach by two independent co-authors (BN and DM) with involvement of a third co-author (RS-M) when there was no consensus. Consensus was reached by two co-authors for five (45.4%) studies.Reference Assefa, Berhane and Worku32–Reference Watson-Jones, Weiss and Changalucha36 (Supplementary Table S2). Eight parameters were used to score the quality of each study: study design, risk of bias, inconsistency, indirectness, imprecision, publication bias, magnitude of effect, confounding and dose–response.Reference Balshem, Helfand and Schunemann37 The quality of the studies was graded as follows: high (four points), moderate (three points), low (one point), and very low (zero points).
Risk of bias
The risk of bias was identified using the GRADE approach.Reference Balshem, Helfand and Schunemann37,Reference Guyatt, Oxman and Akl38 Studies were evaluated on three domains: recruitment of the participants (two criteria on randomisation), conduction of the study (one criterion on blinding) and the reporting of the study outcomes (two criteria). For each study, each criterion was rated as high, low or unclear. Studies were then categorised as being high risk (low rate in three or more characteristics), moderate risk (low rate in two characteristics), low risk or very low risk (low rate in less than two characteristics).
Quantitative analysis
A meta-analysis was not conducted in this systematic review as the definitions of SES factors varied across studies. In addition, for studies for which we could harmonise definitions of SES factors (maternal education and marital status), critical data necessary for the meta-analyses were not available in the published manuscript and could not be retrieved by contacting the authors.
Results
Description of studies
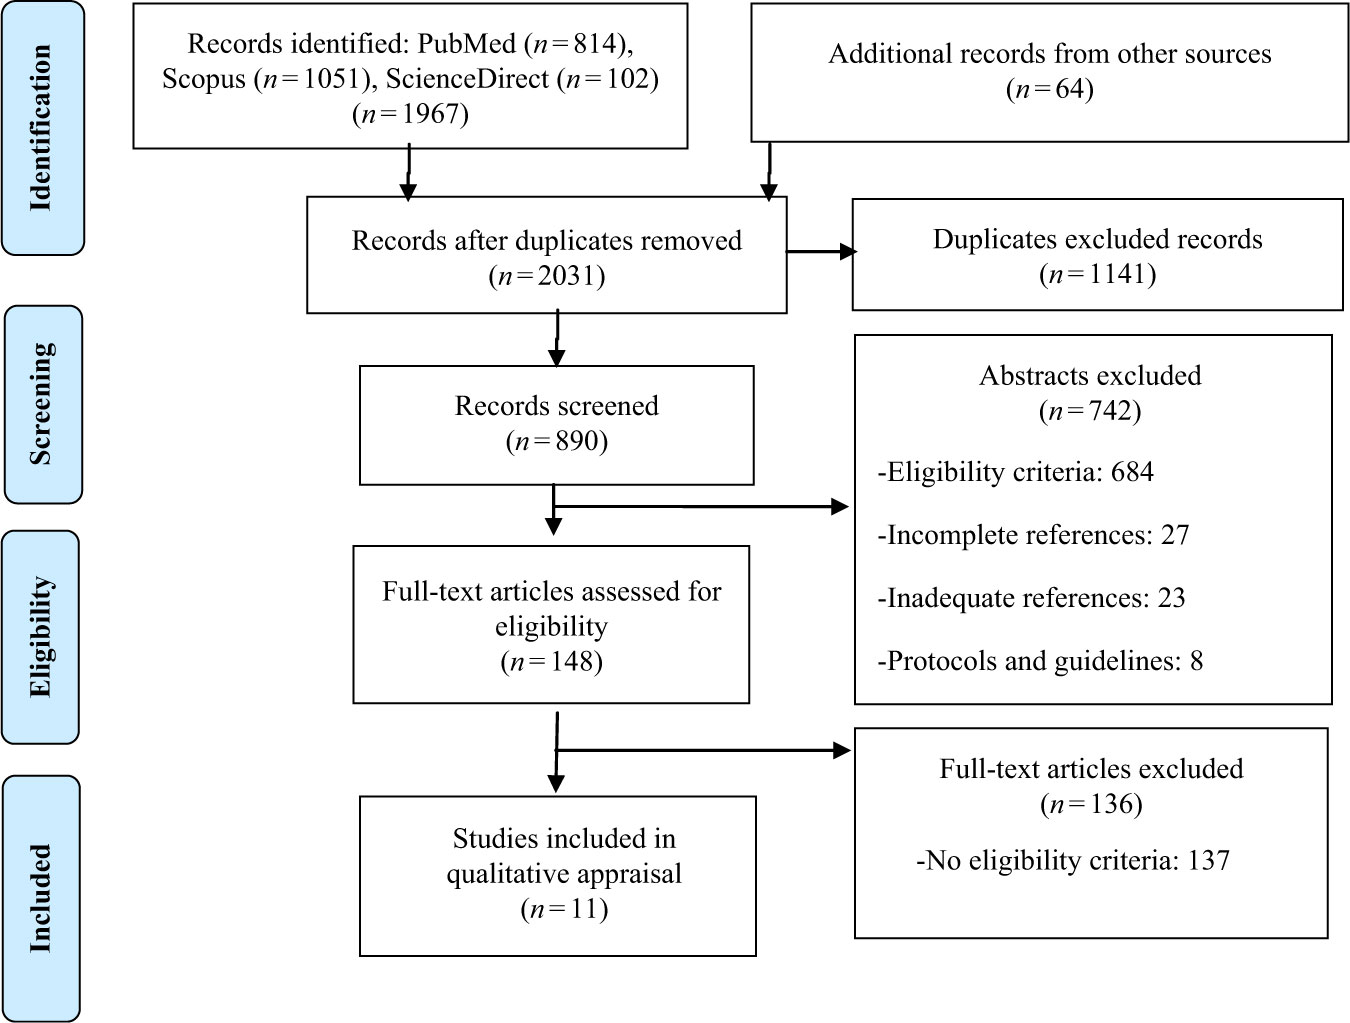
The processes of search, selection, inclusion and exclusion of relevant studies for this systematic review are presented in Fig. 1. We identified 2031 studies from the databases. After removing duplicate studies (1141 articles), titles and abstracts of 890 studies were screened and 148 studies were retained for full-text screening. The reasons for exclusion were as follows: duplicated study, publications before 1990, studies conducted in countries outside of SSA, no SES factors included in the study, no outcomes of interest included in the study, conference papers, editorials, newsletters, comments and notes. We included 11 studies in this systematic review.
Flow diagram on the association between demographic, socio-economic factors with birth and infant growth outcomes.

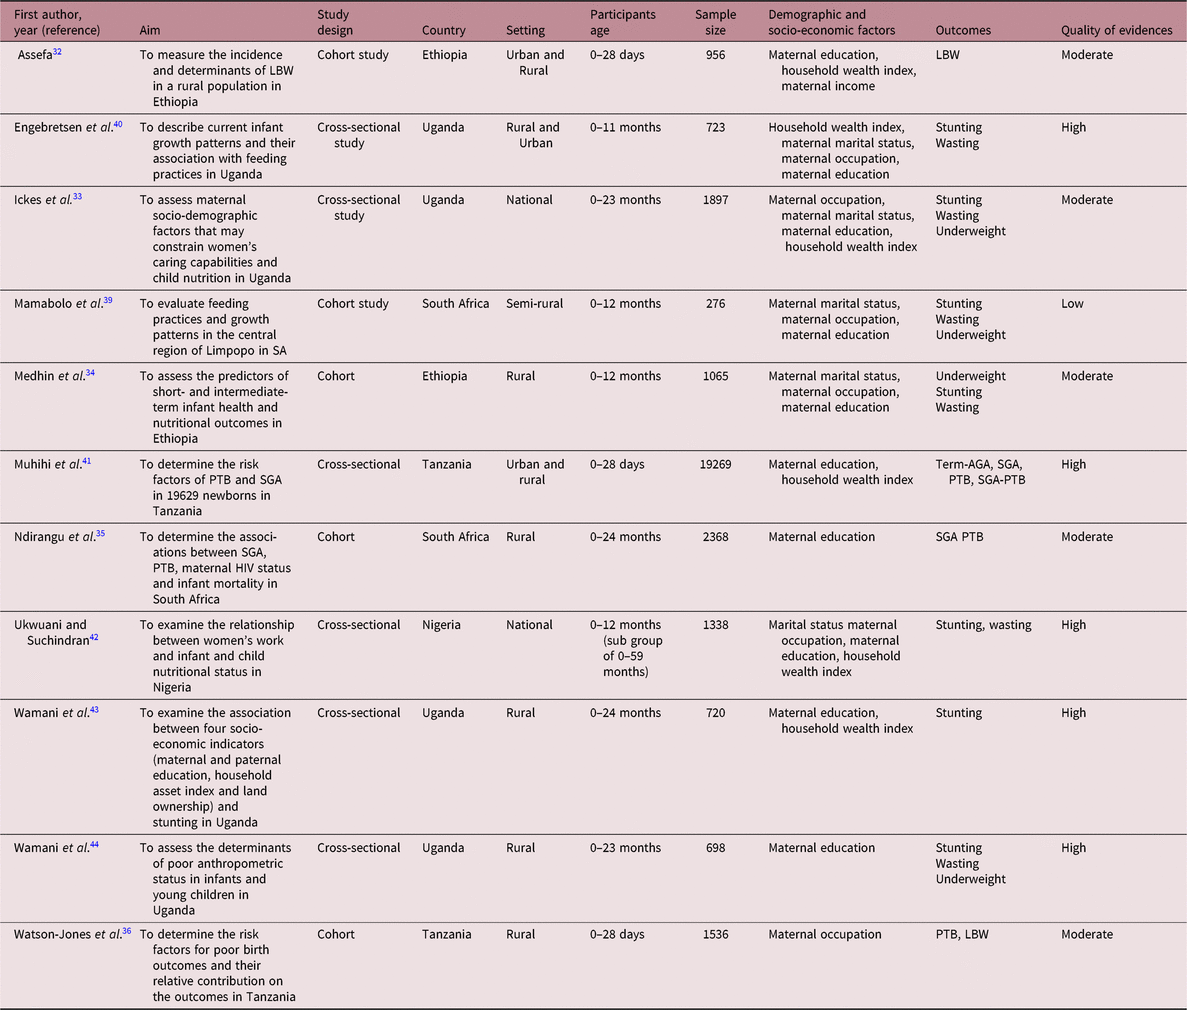
Table 1 presents the characteristics of each study. All included studies were observational and comprised five cohort studiesReference Assefa, Berhane and Worku32,Reference Medhin, Hanlon and Dewey34,Reference Watson-Jones, Weiss and Changalucha36,Reference Mamabolo, Alberts and Mbenyane39 and six cross-sectional surveys.Reference Ickes, Hurst and Flax33,Reference Engebretsen, Tylleskär, Wamani, Karamagi and Tumwine40–Reference Wamani, Astrom, Peterson, Tumwine and Tylleskar44 There were five (45.4%) high-quality studies,Reference Engebretsen, Tylleskär, Wamani, Karamagi and Tumwine40–Reference Wamani, Astrom, Peterson, Tumwine and Tylleskar44 five of moderate-qualityReference Assefa, Berhane and Worku32–Reference Watson-Jones, Weiss and Changalucha36 and one low-quality study.Reference Mamabolo, Alberts and Mbenyane39
Characteristics and summary of studies included in the systematic review

AGA, appropriate gestational age; HIV, human immunodeficiency virus; LBW, low birth weight; PTB, preterm birth; SA, South Africa; SGA, small for gestational age.
Although the studies covered the four regions of SSA, they were conducted in only five countries: four in Uganda,Reference Ickes, Hurst and Flax33,Reference Engebretsen, Tylleskär, Wamani, Karamagi and Tumwine40,Reference Wamani, Tylleskär, Åstrøm, Tumwine and Peterson43,Reference Wamani, Astrom, Peterson, Tumwine and Tylleskar44 two each in South Africa,Reference Ndirangu, Newell, Bland and Thorne35,Reference Mamabolo, Alberts and Mbenyane39 EthiopiaReference Assefa, Berhane and Worku32,Reference Medhin, Hanlon and Dewey34 and Tanzania,Reference Watson-Jones, Weiss and Changalucha36,Reference Muhihi, Sudfeld and Smith41 and one study in Nigeria.Reference Ukwuani and Suchindran42 Most of the studies were conducted exclusively in rural areas,Reference Medhin, Hanlon and Dewey34–Reference Watson-Jones, Weiss and Changalucha36,Reference Mamabolo, Alberts and Mbenyane39,Reference Wamani, Tylleskär, Åstrøm, Tumwine and Peterson43,Reference Wamani, Astrom, Peterson, Tumwine and Tylleskar44 five were conducted in both rural and urban areas,Reference Assefa, Berhane and Worku32,Reference Ickes, Hurst and Flax33,Reference Engebretsen, Tylleskär, Wamani, Karamagi and Tumwine40–Reference Ukwuani and Suchindran42 and two were national surveys.Reference Ickes, Hurst and Flax33,Reference Ukwuani and Suchindran42
Only four studies focused on the birth outcomes of interest,Reference Assefa, Berhane and Worku32,Reference Watson-Jones, Weiss and Changalucha36,Reference Muhihi, Sudfeld and Smith41,Reference Ndirangu, Gatimu, Mwinyi and Kibiwott45 while seven studies focused on undernutrition from birth to 2 years of age.Reference Ickes, Hurst and Flax33,Reference Medhin, Hanlon and Dewey34,Reference Mamabolo, Alberts and Mbenyane39,Reference Engebretsen, Tylleskär, Wamani, Karamagi and Tumwine40,Reference Ukwuani and Suchindran42–Reference Wamani, Astrom, Peterson, Tumwine and Tylleskar44 The distribution of studies per outcome of interest was as follows: three for LBW,Reference Assefa, Berhane and Worku32,Reference Watson-Jones, Weiss and Changalucha36,Reference Muhihi, Sudfeld and Smith41 four for PTB,Reference Ndirangu, Newell, Bland and Thorne35,Reference Watson-Jones, Weiss and Changalucha36,Reference Muhihi, Sudfeld and Smith41,Reference Ndirangu, Gatimu, Mwinyi and Kibiwott45 two for SGA,Reference Ndirangu, Newell, Bland and Thorne35,Reference Muhihi, Sudfeld and Smith41 seven for stunting,Reference Ickes, Hurst and Flax33,Reference Medhin, Hanlon and Dewey34,Reference Mamabolo, Alberts and Mbenyane39,Reference Engebretsen, Tylleskär, Wamani, Karamagi and Tumwine40,Reference Ukwuani and Suchindran42–Reference Wamani, Astrom, Peterson, Tumwine and Tylleskar44 seven for wastingReference Ickes, Hurst and Flax33,Reference Medhin, Hanlon and Dewey34,Reference Mamabolo, Alberts and Mbenyane39,Reference Engebretsen, Tylleskär, Wamani, Karamagi and Tumwine40,Reference Ukwuani and Suchindran42,Reference Wamani, Astrom, Peterson, Tumwine and Tylleskar44 and four for underweight.Reference Ickes, Hurst and Flax33,Reference Medhin, Hanlon and Dewey34,Reference Mamabolo, Alberts and Mbenyane39,Reference Wamani, Astrom, Peterson, Tumwine and Tylleskar44
Maternal socio-demographic characteristics and household SES factors investigated in the studies were: maternal education in 11 studies,Reference Assefa, Berhane and Worku32–Reference Medhin, Hanlon and Dewey34,Reference Watson-Jones, Weiss and Changalucha36,Reference Mamabolo, Alberts and Mbenyane39–Reference Ndirangu, Gatimu, Mwinyi and Kibiwott45 maternal occupation in 5 studies,Reference Ickes, Hurst and Flax33,Reference Watson-Jones, Weiss and Changalucha36,Reference Mamabolo, Alberts and Mbenyane39,Reference Engebretsen, Tylleskär, Wamani, Karamagi and Tumwine40,Reference Wamani, Astrom, Peterson, Tumwine and Tylleskar44 maternal marital status in 5 studiesReference Ickes, Hurst and Flax33,Reference Medhin, Hanlon and Dewey34,Reference Mamabolo, Alberts and Mbenyane39,Reference Engebretsen, Tylleskär, Wamani, Karamagi and Tumwine40,Reference Ukwuani and Suchindran42 and maternal or HWI in 5 studies.Reference Ickes, Hurst and Flax33,Reference Medhin, Hanlon and Dewey34,Reference Engebretsen, Tylleskär, Wamani, Karamagi and Tumwine40,Reference Ukwuani and Suchindran42,Reference Wamani, Tylleskär, Åstrøm, Tumwine and Peterson43 Maternal education was defined as illiterate or not,Reference Assefa, Berhane and Worku32,Reference Ickes, Hurst and Flax33 educated or not,Reference Ickes, Hurst and Flax33,Reference Wamani, Tylleskär, Åstrøm, Tumwine and Peterson43 student or not,Reference Mamabolo, Alberts and Mbenyane39 formal or not formalReference Muhihi, Sudfeld and Smith41 and the level of education (i.e., none, primary and secondary education level).Reference Ndirangu, Newell, Bland and Thorne35,Reference Mamabolo, Alberts and Mbenyane39,Reference Muhihi, Sudfeld and Smith41,Reference Ukwuani and Suchindran42 Maternal occupation was measured as follows: staying at home vs. not staying home,Reference Assefa, Berhane and Worku32 working in a skilled job vs. unskilled work such as farming,Reference Watson-Jones, Weiss and Changalucha36 working vs. not working,Reference Ickes, Hurst and Flax33,Reference Ukwuani and Suchindran42 being a housewife vs. not being a housewife.Reference Mamabolo, Alberts and Mbenyane39 Ukwuani and SuchindranReference Ukwuani and Suchindran42 defined occupation in combination with other variables such as mother earning a cash payment, and taking her child with her to work. Maternal marital status was defined as follows: polygamous vs. non-polygamous marriage,Reference Medhin, Hanlon and Dewey34,Reference Ukwuani and Suchindran42 or married/living with a partner vs. divorced/widowed/not living togetherReference Ickes, Hurst and Flax33 or married vs non married.Reference Engebretsen, Tylleskär, Wamani, Karamagi and Tumwine40 Lastly, HWI was categorised into three classes (better off, middle or poor)Reference Assefa, Berhane and Worku32 or five quintiles.Reference Ickes, Hurst and Flax33,Reference Engebretsen, Tylleskär, Wamani, Karamagi and Tumwine40,Reference Muhihi, Sudfeld and Smith41,Reference Wamani, Astrom, Peterson, Tumwine and Tylleskar44 In some studies, the HWI compared mothers using a 60% cut-off for the HWIReference Ickes, Hurst and Flax33 or a poverty index from 1 to 12.Reference Medhin, Hanlon and Dewey34
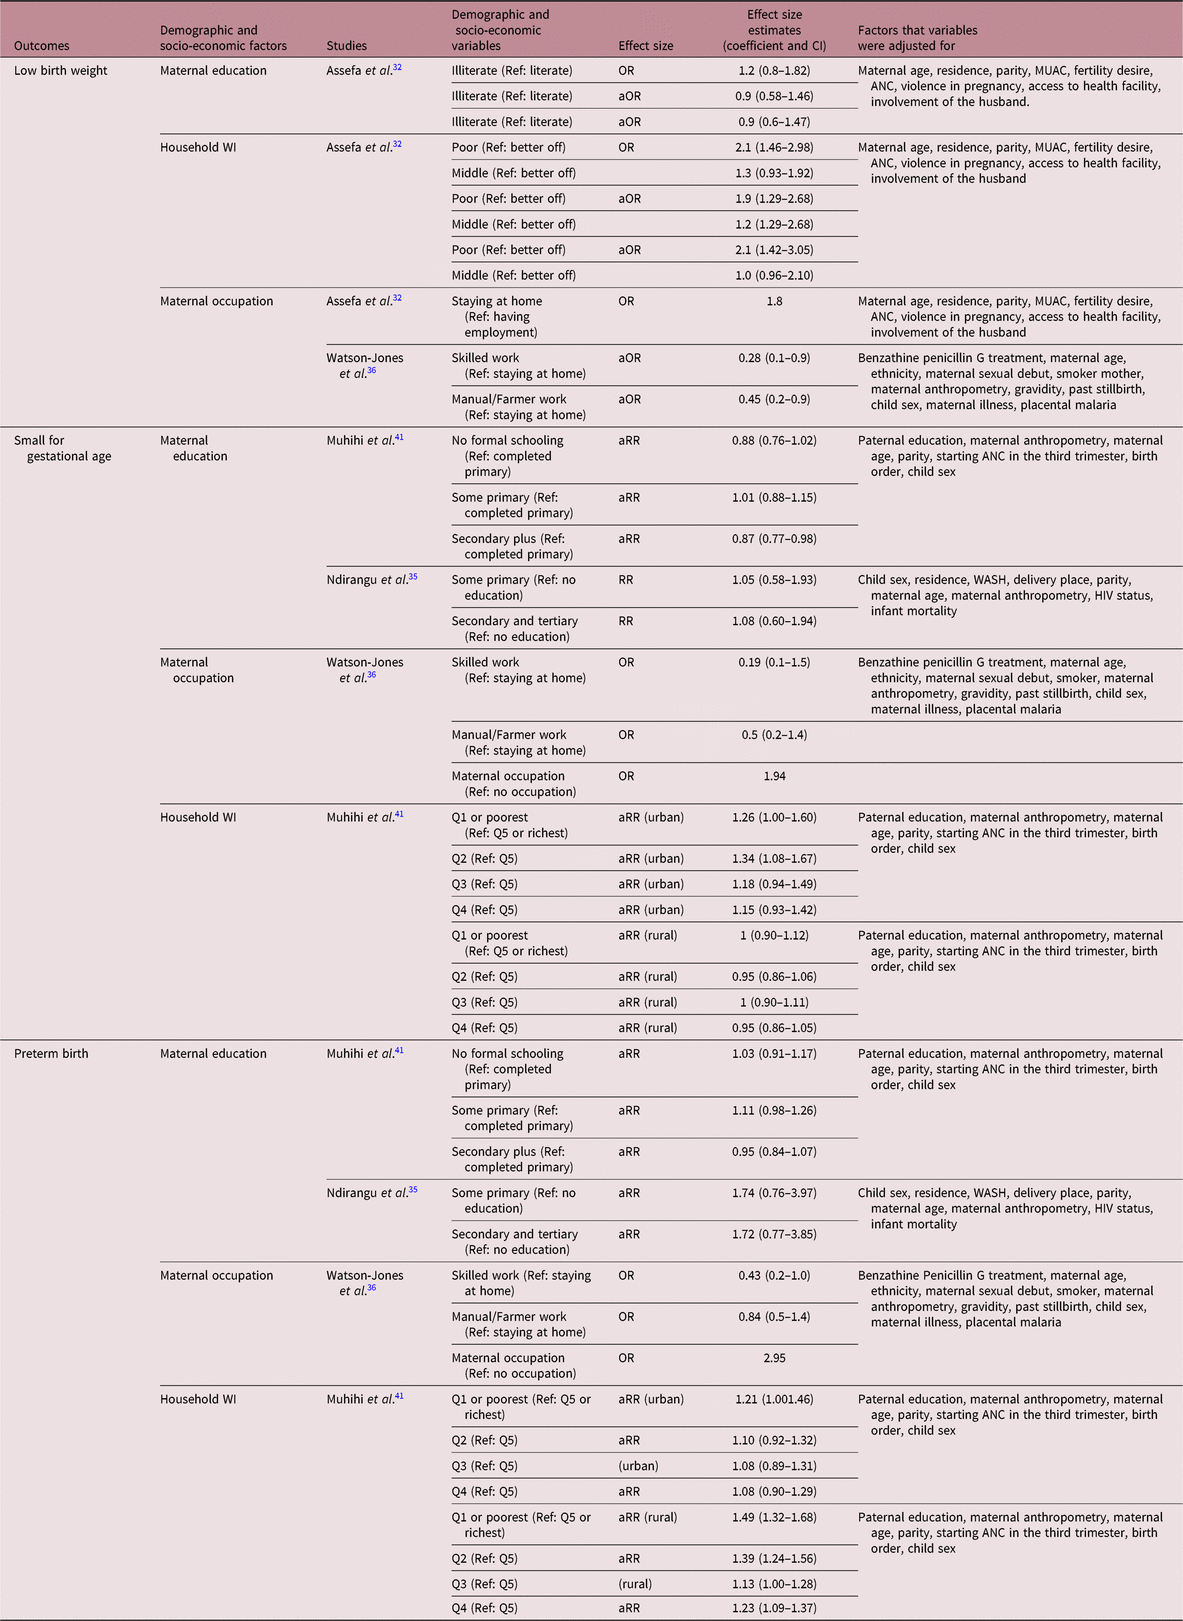
Associations between maternal socio-demographic characteristic, household socio-economic factors and birth outcomes (Table 2)
In three studies, maternal level of education was not associated with LBW and PTB.Reference Assefa, Berhane and Worku32,Reference Ndirangu, Newell, Bland and Thorne35,Reference Muhihi, Sudfeld and Smith41 However, when cut-offs for PTB and SGA were 37th week and 3rd percentile, respectively, Muhihi et al.Reference Muhihi, Sudfeld and Smith41 found that having a mother with no formal schooling was associated with simultaneous PTB and SGA compared to having a mother who completed formal schooling. In another study, a maternal education higher than secondary level reduced the odds of SGA by 13% after adjusting for maternal age, residence, parity, maternal height and infant male sex.Reference Muhihi, Sudfeld and Smith41
Associations between demographic and socio-economic factors with LBW, PTB and SGA

A, activity; ANC, antenatal care; aOR, adjusted odds ratio; aRR, adjusted relative risk; C, Cash; CI, confidence interval; HIV, human immunodeficiency virus; LBW, low birth weight; MUAC, mid-upper arm circumference; OR, odds ratio; PTB, preterm birth; Q (1,2,3,4,5), quintile (1,2,3,4,5); RR, relative risk; SGA, small for gestational age; WASH, water sanitation hygiene; WI, wealth index.
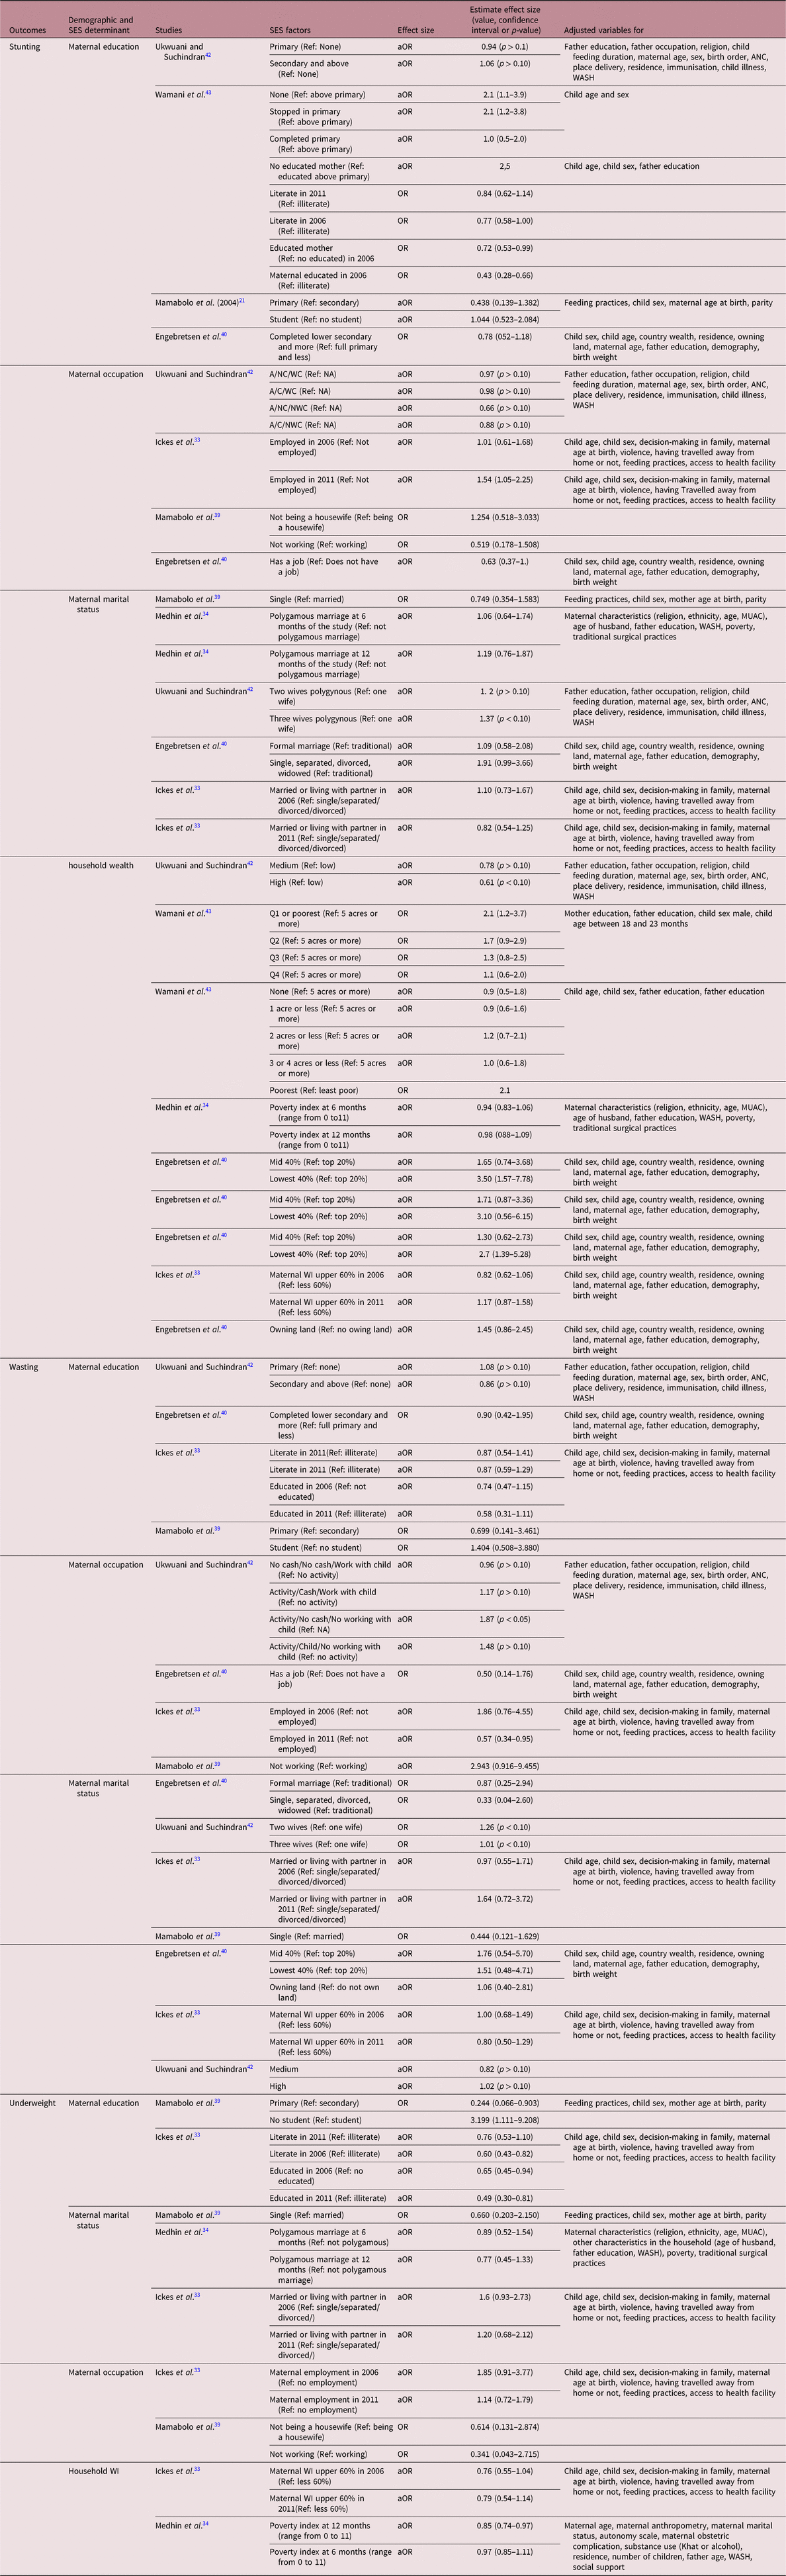
Associations between demographic and socio-economic factors with infant growth outcomes (stunting, wasting and underweight)

A, activity; AC, activity with cash; ANC, antenatal care; aOR, adjusted odds ratio; C, cash; HIV, human immunodeficiency virus; MUAC, mid-upper arm circumference; NA, not active; NC, no cash; NWC, no work with child; OR, odds ratio; Q (1,2,3,4,5), quintile; SES, socio-economic status; WASH, wash, sanitation and hygiene; WC, work with child; WI, wealth index.
There was no significant association between maternal occupation and either SGA or PTB.Reference Watson-Jones, Weiss and Changalucha36 Stay-at-home mothers had 80% greater odds of having an LBW child compared to those who were working.Reference Assefa, Berhane and Worku32 Another studyReference Watson-Jones, Weiss and Changalucha36 found that, the odds of having LBW were lower by 72% for those mothers who had skilled work compared to only 55% for those mothers who had unskilled work after adjusting for maternal characteristics (age, anthropometry, fertility desire and parity), paternal support, geographical location (residence), behavioural characteristics (physical violence) and health (access to the antenatal care services).
HWI was not significantly associated with SGA in one study.Reference Muhihi, Sudfeld and Smith41 However, the poorest households had 21% and 49% greater risk of PTB than affluent households in urban and rural settings, respectively.Reference Muhihi, Sudfeld and Smith41 Another study showed that the poorest households had 110% greater odds of having an LBW child than the richest households after adjusting for maternal mid-upper arm circumference, antenatal care (ANC) attendance, violence during pregnancy and access to a health facility.Reference Assefa, Berhane and Worku32
Associations between maternal demographic characteristics, household socio-economic factors and stunting (Table 3)
Several studies found that maternal marital status was not significantly associated with stunting.Reference Ickes, Hurst and Flax33,Reference Medhin, Hanlon and Dewey34,Reference Mamabolo, Alberts and Mbenyane39,Reference Ukwuani and Suchindran42 The relationship between maternal level of education and stunting was not consistent across the studies reviewed. Having a mother with either no education or schooling up to primary school level was associated with 110% greater odds of stunting compared to having a mother who had been educated beyond primary school level.Reference Wamani, Tylleskär, Åstrøm, Tumwine and Peterson43 Ickes et al.Reference Ickes, Hurst and Flax33 found that educated mothers had 57% lower odds of having stunted infants, but there was no significant association between maternal literacy and infant stunting. Two studies did not find an association between maternal education and stunting.Reference Engebretsen, Tylleskär, Wamani, Karamagi and Tumwine40,Reference Ukwuani and Suchindran42
Ickes et al.Reference Ickes, Hurst and Flax33 found that having a mother with an occupation was positively associated with 54% greater odds of stunting. The association between occupation and stunting was adjusted for child age, breastfeeding, maternal religion, maternal age, maternal education, marital status, decision maker in the family, domestic violence, maternal exposure to media, mothers travelling during pregnancy, delivering in a health facility, water sanitation and hygiene and HWI.Reference Ickes, Hurst and Flax33,Reference Ukwuani and Suchindran42 However, Engebretsen et al.Reference Engebretsen, Tylleskär, Wamani, Karamagi and Tumwine40 did not find any association between maternal occupation and risk of stunting. Studies have defined household wealth using wealth index (tercilesReference Ukwuani and Suchindran42), (quintilesReference Ickes, Hurst and Flax33,Reference Engebretsen, Tylleskär, Wamani, Karamagi and Tumwine40,Reference Wamani, Tylleskär, Åstrøm, Tumwine and Peterson43,Reference Wamani, Astrom, Peterson, Tumwine and Tylleskar44 ), or cut-offs which varied between studies), land ownershipReference Engebretsen, Tylleskär, Wamani, Karamagi and Tumwine40,Reference Wamani, Tylleskär, Åstrøm, Tumwine and Peterson43,Reference Wamani, Astrom, Peterson, Tumwine and Tylleskar44 and poverty index.Reference Medhin, Hanlon and Dewey13 Wamani et al.Reference Wamani, Tylleskär, Åstrøm, Tumwine and Peterson43 and Engebretsen et al.Reference Engebretsen, Tylleskär, Wamani, Karamagi and Tumwine40 found that the lowest HWIs were associated with higher odds of stunting,Reference Engebretsen, Tylleskär, Wamani, Karamagi and Tumwine40,Reference Wamani, Astrom, Peterson, Tumwine and Tylleskar44 while other studies reported no significant association between HWI and infant stunting.Reference Ickes, Hurst and Flax33,Reference Medhin, Hanlon and Dewey34,Reference Ukwuani and Suchindran42
Association between maternal socio-demographic characteristic, household socio-economic factors and wasting (Table 3)
Maternal occupation was associated with 43% lower odds of wasting in the study by Ickes et al.Reference Ickes, Hurst and Flax33; however, in the study by Ukwuani and Suchindran,Reference Ukwuani and Suchindran42 mothers who were not remunerated in cash and did not take their child to work had 87% greater odds of having a wasted child. Two other studies found no association between maternal occupation and wasting.Reference Mamabolo, Alberts and Mbenyane39,Reference Engebretsen, Tylleskär, Wamani, Karamagi and Tumwine40 In two of the studies reviewed, there was no significant association between the HWI and wasting.Reference Ickes, Hurst and Flax33,Reference Engebretsen, Tylleskär, Wamani, Karamagi and Tumwine40 Engebertsen et al.,Reference Engebretsen, Tylleskär, Wamani, Karamagi and Tumwine40 Ickes et al.Reference Ickes, Hurst and Flax33 and Ukwuani and Suchindran Reference Ukwuani and Suchindran42 did not find any significant association between wasting and maternal level of education or marital status.Reference Ickes, Hurst and Flax33,Reference Engebretsen, Tylleskär, Wamani, Karamagi and Tumwine40,Reference Ukwuani and Suchindran42
Associations between maternal socio-demographic characteristic, household socio-economic factors and underweight (Table 3)
The odds of having an underweight child were 40% lower for literate mothers vs illiterate mothersReference Ickes, Hurst and Flax33: 35% lower for educated mothers vs non-educated mothersReference Ickes, Hurst and Flax33; 76% lower for mothers who had completed primary school compared with those who had completed secondary school.
Discussion
This review has identified a lack of research in SSA (only 11 studies for 52 countries), a region with one of the highest prevalence of child undernutrition, and the role of maternal and household socio-economic determinants of impaired growth and development during the first thousand days. Furthermore, we highlighted interesting methodological challenges when assessing maternal or household socio-economic characteristics as well as important empirical findings pertaining to SSA context. Methodologically, although the definitions of LBW, SGA, PTB, stunting, wasting and underweight were standard, studies used varying definitions of SES factors that made comparison and generalisability of their results challenging. However, overall, lower HWI, maternal unemployment and low maternal education were shown to be important SES predictors of adverse birth outcomes (LBW and SGA) and infant undernutrition (stunting, wasting and underweight) in SSA.
Socio-economic factors and adverse birth outcomes
Evidence gathered in this systematic review has shown that PTB is associated with lower maternal occupation and lower HWI.Reference Watson-Jones, Weiss and Changalucha36,Reference Muhihi, Sudfeld and Smith41 While the risk for a newborn to be SGA was associated with a lower level of maternal education in one out of two studies reviewed,Reference Muhihi, Sudfeld and Smith41 LBW was predicted by living in a household with a lower HWI.Reference Assefa, Berhane and Worku32,Reference Muhihi, Sudfeld and Smith41 In addition, having a mother with an occupation, and therefore a source of income, was associated with lower risk of LBW. In a review of studies in 22 LMICs, Watson-Jones et al.Reference Watson-Jones, Weiss and Changalucha36 and Vogel et al.Reference Vogel, Lee and Souza46 found that less-educated mothers had and increased risk of having a newborn that was PTB. However, in a recent study in Kenya, Wagura et al.Reference Wagura, Wasunna, Laving, Wamalwa and Ng&ang&a47 found that maternal level of education had no significant association with PTB but was significantly associated with previous PTB. Furthermore, in Brazil, Zambonato et al.Reference Zambonato, Pinheiro, Horta and Tomasi48 found an association between SGA in Brazilian newborns and a lower family income, similar to the study conducted in Tanzania in this review.Reference Muhihi, Sudfeld and Smith41 Similarly, in Japan, mothers living in prefectures with higher socio-economic inequality (measured by the Gini coefficient) had 24% greater risk of having a SGA newborn.Reference Fujiwara, Ito and Kawachi49 In addition, lower parental education and household income was associated with SGA.Reference Fujiwara, Ito and Kawachi49 The protective effect of maternal education, occupation and aggregated SES indices against LBW has been shown in previous studies in other LMICs (South Africa,Reference Budree, Goddard and Brittain12 Pakistan,Reference Ghouse and Zaid50 VietnamReference Bui, Nguyen and Phung51 and BangladeshReference Khan, Islam, Awan and Muurlink52), as well as in a meta-analysis of studies conducted in middle- and high-income countries.Reference Silvestrin, Silva and Hirakata53 In this systematic review, we did not find any study that investigated the association between maternal marital status and birth outcomes.
Socio-economic factors and infant undernutrition between birth and 2 years of age
Most studies included in this review reported that higher level of maternal education was protective against stunting and underweight, while maternal occupation and low HWI increased the risks for a child to be stunted.Reference Ickes, Hurst and Flax33,Reference Engebretsen, Tylleskär, Wamani, Karamagi and Tumwine40,Reference Wamani, Tylleskär, Åstrøm, Tumwine and Peterson43,Reference Wamani, Astrom, Peterson, Tumwine and Tylleskar44 The evidence was not consistent for underweight; studies found positive and negative associations with maternal education.Reference Medhin, Hanlon and Dewey13,Reference Ickes, Hurst and Flax33,Reference Mamabolo, Alberts and Mbenyane39 While some studies found that maternal occupation reduced the risks of wasting, others have shown the contrary.Reference Ickes, Hurst and Flax33,Reference Ukwuani and Suchindran42 No study found an association between marital status and stuntingReference Ickes, Hurst and Flax33,Reference Medhin, Hanlon and Dewey34,Reference Mamabolo, Alberts and Mbenyane39,Reference Engebretsen, Tylleskär, Wamani, Karamagi and Tumwine40,Reference Ukwuani and Suchindran42 or wasting,Reference Ickes, Hurst and Flax33,Reference Mamabolo, Alberts and Mbenyane39,Reference Engebretsen, Tylleskär, Wamani, Karamagi and Tumwine40,Reference Ukwuani and Suchindran42 and the association between marital status and underweight had not been explored.
A review on malnutrition over 15 years in LMICs showed that higher maternal/caregivers’ level of education and greater HWI reduced the odds of stunting during infancy.Reference Arthur, Nyide and Soura54 In a pooled analysis of five cohort studies including South Africa,Reference Richter, Orkin and Roman7 the results showed that low maternal education, low maternal income, low social class (measured by paternal occupation) and low paternal education were predictors of stunting at 2 years of age. However, SES factors (maternal education, maternal income, paternal occupation and paternal education) had less influence on stunting than biological factors (birth weight and maternal height), particularly in South Africa.Reference Richter, Orkin and Roman7 Similarly, a study in Ivory Coast found that having an educated mother was protective against stunting in 3-year-old children.Reference Barankanira, Molinari, Msellati, Laurent and Bork55
In Bangladesh, Raihan et al.Reference Raihan, Farzana and Sultana56 found that low SES (assets, maternal and household income and maternal education) increased the risk of wasting in children younger than 5 years of age. They also found that water sanitation and hygiene characteristics (e.g., use of soap, use of hygienic latrine and safe drinking water), often used as a composite of HWI and/or as a risk factor of infectious disease, mediated the association between SES factors and wasting.Reference Raihan, Farzana and Sultana56
The outcomes of this review align with the existing findings in children aged between 6 and 23 months in MyanmarReference Mya, Kyaw and Tun57 and in children under 3 years of age in Vietnam,Reference Hien and Hoa21 which reported that children of working mothers had a higher risk of being stunted. Also in Vietnam,Reference Hien and Hoa21 maternal occupation was a predictor of all forms of undernutrition (stunting, wasting and underweight), whereas maternal education and income were not. In contrast, Ukwuani and Suchindran Reference Ukwuani and Suchindran42 found that in Nigeria maternal occupation was protective against wasting suggesting that working women have an income that allows for provision of food and better care, and that mothers breastfeed for longer than their non-working peers.
Maternal and household SES factors during the first 1000 days
At the country level, a review of 121 surveys in 36 LMICsReference Vollmer, Harttgen and Subramanyam58 found that a 5% increase in per capita gross domestic product decreased the risk of undernutrition in children aged between 0 and 35 months, but this association did not occur in the poorest households, suggesting that poverty and socio-economic inequalities are both vehicles of infant undernutrition. The first thousand days, the period between conception and 2 years after birth,Reference Black, Victora and Walker1 have been acknowledged as a critical period for child growth and development and for adult health outcomes.Reference Vollmer, Harttgen and Subramanyam58 Evidence from this review highlights that low maternal and household SES are more likely to have a negative effect on growth and development during that period.Reference Bhutta, Ahmed and Black59
The socio-economic environment is both a contributory factor to and a consequence of infant undernutrition.Reference Black, Victora and Walker1 Maternal and household lower SES is an underlying factor of household food insecurity, and therefore of maternal and child health and undernutrition.Reference Mutisya, Kandala, Ngware and Kabiru60 Children living in households with low SES were found to consume more carbohydrates and less protein and less fat with subsequent undernutrition.Reference Murayama61 Educated mothers have greater knowledge, better job opportunities, higher income, a healthy lifestyle and access to health care, all of which impact infant growth and nutritional status.Reference Silvestrin, Silva and Hirakata53,Reference Shavers62 Although the level of education of the general population is improving in SSA countries, education of females is still lower than that of males.63 McGovern et al.,Reference McGovern, Krishna, Aguayo and Subramanian64 in their systematic review on stunting and economic growth, concluded that education of women is a cost-effective investment that reduces poor infant growth and translates into greater future opportunities for children.
One study included in this review found that maternal occupation had a detrimental effect on child growth.Reference Shavers62 Having a job may generate an income for mothers and their households, but it can limit the time spent with their newborn. While having an occupation provides an income that enables greater access to health care, working mothers are not always available to breastfeed their children or to access health care when necessary.Reference Shavers62 Lack of support systems (social support, maternity leave, etc.) may jeopardise mothers’ possibilities to provide optimal care for their children (including exclusive breastfeeding), thereby exposing children to the risks associated with early weaning, introduction of solid food and infectious diseases.Reference Said-Mohamed and Pettifor4 In this review, we did not find any studies conducted in SSA on the association between maternal marital status and infant undernutrition. Having a partner (married or concubine) may have a positive effect on maternal and child health through the widest network of social support, and additional income that this situation may provide; however, domestic violence may offset those benefits.Reference Ackerson and Subramanian65,Reference Yount, DiGirolamo and Ramakrishnan66
Based on the studies included in this review, socio-economic factors were generally assessed as contextual variables (HWI) and/or as compositional measurements (education, income, occupation).Reference Shavers62 In addition, we highlighted that across studies, contextual and compositional SES factors were defined using different characteristics.Reference Shavers62 The lack of standardisation and harmonisation of SES measures may explain discrepancies observed between the studies included in this review. For example, whereas a study showed that higher maternal education level was associated with lower risk of stunting,Reference Wamani, Tylleskär, Åstrøm, Tumwine and Peterson43 one study found no association between maternal literacy and stunting.Reference Wamani, Tylleskär, Åstrøm, Tumwine and Peterson43 It may be that either the influence of education is different depending on the social and economic contexts, or that having a higher level of education, which is indicative of the knowledge acquired, is more important than maternal literacy, which reflects a skill. Wamani et al.Reference Wamani, Astrom, Peterson, Tumwine and Tylleskar44 found that in rural Uganda having a secondary education level was the critical threshold at which maternal level of education was protective against stunting. The use of a variety of SES indicators may also limit comparisons within and between countries, and therefore, the identification of critical maternal and household factors to target in national or regional intervention programs that aim to promote foetal and infant optimal growth.
The majority of studies reviewed did not specifically focus on the assessment of the association between SES factors and birth outcomes or infant undernutrition. Possibly, the choice of SES indices might have been dictated by the main objective of the study. Therefore, another source of discrepancies between studies could be the covariates in the multivariate analyses. The UNICEF causal framework3 has established that several immediate, underlying and basic causes play a role in infant undernutrition. Various combinations of causal factors were taken into account across the articles reviewed here, including infant gender,Reference Barankanira, Molinari, Msellati, Laurent and Bork55,Reference Mutisya, Kandala, Ngware and Kabiru60 infant feeding practices,Reference Arthur, Nyide and Soura54,Reference Mya, Kyaw and Tun57 maternal age,Reference Barankanira, Molinari, Msellati, Laurent and Bork55 maternal anthropometry,Reference Silvestrin, Silva and Hirakata53 maternal morbidity (urinary tract infection, hypertensive disorders, malaria, human immunodeficiency virus, infection, gestational diabetes, pre-eclampsia, pregnancy induced hypertension, antepartum haemorrhage, pre-labour rupture of membranes, placental bleeding),Reference Vogel, Lee and Souza46 maternal obstetrical history (parity, previous PTB, gestation number),Reference Vogel, Lee and Souza46,Reference Zambonato, Pinheiro, Horta and Tomasi48,Reference Teixeira, Queiroga and Mesquita67 access and usage of antenatal care services, household food insecurity,Reference Barankanira, Molinari, Msellati, Laurent and Bork55,Reference Mutisya, Kandala, Ngware and Kabiru60 household size and level of urbanisation.Reference Arthur, Nyide and Soura54,Reference Mutisya, Kandala, Ngware and Kabiru60
Limitations
This review has some limitations. Firstly, studies were selected using English keywords, which given the linguistic diversity in the SSA region, studies written in only other languages may have been missed. Secondly, the various definitions and measurement of SES and the inability to retrieve some key data from publications did not allow us to undertake a meta-analysis. Thirdly, one (9%) studyReference Mamabolo, Alberts and Mbenyane39 was rated low because of lack of randomisation in recruitment, no blinding in the conduction of the study, lack of adjustment for any variable and no CIs in the results.Reference Balshem, Helfand and Schunemann37,Reference Guyatt, Oxman and Akl38 Finally, the accuracy of gestational age may vary across studies depending on the method of assessment. These limitations could lead to a low power of the data included (quality and quantity) in the review.
Conclusion
In conclusion, despite the paucity of studies that have explored the relationship between maternal and household SES and LBW, PTB, SGA, stunting, wasting and underweight in SSA, results from this review emphasise the negative long-term effects of poor maternal and household SES on child growth during the first thousand days. More research, including using a qualitative approach, has to be undertaken to improve our understanding of contextual SES factors that are associated with undernutrition during the first thousand days in the different SSA countries. Furthermore, early intervention from pre-pregnancy through infancy may prevent undernutrition during the first 2 years of life and any irreversible damages caused by undernutrition during infancy. Finally, promoting maternal education and female employment as well as alleviating female poverty and inequality are key interventions to favour optimal maternal and child health.
Supplementary materials
To view supplementary material for this article, please visit https://doi.org/10.1017/S2040174419000680
Acknowledgements
We are grateful to Innocent Maposa for statistical support. We acknowledge the librarians from the Medical School at the University of the Witwatersrand for their assistance with the search of publications.
Financial support
This study was made possible through the support of the South African Medical Research Council by the DST-NRF Centre of Excellence in Human Development (SAN and RS-M, grant number: ACC2017007) and by the DST-NRF Centre of Excellence in Food Security (DM and RS-M, grant number: 160502).
Conflicts of interest
All the authors declare that they have no conflict of interest.
Ethical standards
This research did not involve human and/or animal experimentations and therefore does not warrant ethical standards statement.
Authors’ contribution
Conceptualisation of the review: CBN, SN, RS-M.
Search, inclusion of studies and data extraction: CBN, DM, RS-M.
Data interpretation: BN, LC, SN, RS-M.
Integrity of data: BN.
Editing manuscript: AM.
Drafting and revising manuscript: BN, DM, LC, AM, SN, RS-M.