Introduction
Temporal dynamics in visual processing
Visual perception is not instantaneous. The perceptual representation of our environment builds up through successive stages of perceptual formation, unfolding within the first few hundred milliseconds after stimulus presentation. The latest theories of visual processing stress temporal aspects and emphasize the difference between two phases: (1) a temporally early phase of processing—mediated by neuronal feedforward activation, and (2) a later phase of processing—mediated by recurrent activation (i.e., neuronal feedback between higher and lower levels of the visual hierarchy and horizontal connections within these levels; e.g., Bullier, Reference Bullier2001; Hochstein & Ahissar, Reference Hochstein and Ahissar2002). The recurrent processing in the later phase is thought to be a necessary precondition for many aspects of visual perception (e.g., scene categorization, Malcolm et al., Reference Malcolm, Nuthmann and Schyns2014; visual awareness, Lamme & Roelfsema, Reference Lamme and Roelfsema2000). This implies that temporally early and late processing phases might generate different visual percepts (for reviews see Ögmen & Breitmeyer, Reference Ögmen and Breitmeyer2006; Hegdé, Reference Hegdé2008; van Zoest et al., Reference van Zoest, Hunt and Kingstone2010).
Visual illusions as tools to study temporal dynamics
Here, we study qualitative differences between early and later processing phases by using the well-known Ebbinghaus or Titchener illusion in which the perceived size of a central element varies with the size of surrounding context elements (so that the observer’s visual percept differs from the physical characteristics of the central element; Fig. 1). Generally, visual illusions are inconsistencies between an observer’s visual percept and a stimulus’ physical characteristics, often as a result from long-term adaptation of the visual system to our environment (Howe & Purves, Reference Howe and Purves2005). After only sporadic investigations in earlier times (e.g., Piaget, Reference Piaget1969), there is a renewed interest in the study of the temporal development of visual illusions (e.g., van Zoest & Hunt, Reference van Zoest and Hunt2011; de Brouwer et al., Reference de Brouwer, Brenner, Medendorp and Smeets2014; Schmidt & Haberkamp, Reference Schmidt and Haberkamp2016). Generally, these studies show variations in the strength of illusion effects that are driven by variations in illusion presentation time or in the speed of observers’ saccades or manual responses. As visual illusions often demonstrate basic characteristics of visual processing, these studies thereby demonstrate the importance of the temporal factor in visual perception and action.
Illustration of the Ebbinghaus illusion in which the size of two identical discs (red) appears different depending on context.

Integration of information across space, as that of the central element and illusion-inducing context in the Ebbinghaus illusion (Fig. 1) might be mediated either feedforward, by the increasing receptive field size from lower to higher levels of the visual hierarchy, or recurrent, by modulatory feedback from higher to lower levels or horizontal connections within levels. Some studies investigated the spatial, hierarchical aspects of the processing of visual illusions (i.e., where in the visual processing pathway is the illusion percept represented; e.g., Murray et al., Reference Murray, Boyaci and Kersten2006; Fang et al., Reference Fang, Boyaci, Kersten and Murray2008). Their results suggest an involvement of early visual area V1 in the representation of the illusion percept. However, the microgenesis of this percept is unclear: although the Ebbinghaus illusion has been at the heart of a long and prolific history of research, the time course of its processing remains elusive. When participants perform a speeded visual search for an Ebbinghaus target stimulus within an array of Ebbinghaus distracter stimuli, their search is driven by the illusory size of the target and the distracters (Busch & Müller, Reference Busch and Müller2004), suggesting that the illusion is effective within early phases of processing. However, Murray et al. (Reference Murray, Boyaci and Kersten2006) hypothesize that the representation of the illusion percept in V1 (also see Song et al., Reference Song, Schwarzkopf and Rees2011) is based on feedback signals from other levels of the visual hierarchy. Consequently, the Ebbinghaus illusion should critically depend on this feedback and not be effective within the early, feedforward phase of processing. Footnote 1
Introducing a visuomotor dissociation paradigm
Most studies that investigated the time course of visual illusions measured the strength of the illusion percept as a function of illusion presentation time or of stimulus-onset asynchrony (SOA) between the illusion and a following mask. Few studies also tested the illusion percept as a function of participant’s response times (e.g., saccade latency, van Zoest & Hunt, Reference van Zoest and Hunt2011; de Brouwer et al., Reference de Brouwer, Brenner, Medendorp and Smeets2014). Here, we combine two approaches to study the time course of the Ebbinghaus illusion. First, we use a response priming paradigm (Klotz & Wolff, Reference Klotz and Wolff1995; Schmidt et al., Reference Schmidt, Haberkamp and Schmidt2011a) to study the influence of illusion primes on fast visuomotor processing. In this paradigm, priming effects can be analyzed as a function of response speed and prime-target SOA (Schmidt & Haberkamp, Reference Schmidt and Haberkamp2016). Here, we analyze priming effects induced by the Ebbinghaus illusion as a function of decreasing response speed and of increasing SOA—because both leave the visual system with more time to process the stimuli (Experiment 1a). This design allows us to identify potential dissociations between temporally early (priming) and late (perception) processing phases (Vorberg et al., Reference Vorberg, Mattler, Heinecke, Schmidt and Schwarzbach2003; Schmidt & Vorberg, Reference Schmidt and Vorberg2006). Second, we measure the appearance of the illusion primes in a perceptual task (Experiment 1b). Additionally, we performed two control experiments: one testing priming effects of Ebbinghaus displays with removed central elements (Experiment 2) and one testing priming effects of Ebbinghaus displays with context elements of different shape and number (Experiment 3).
Experiment 1a
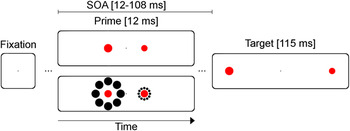
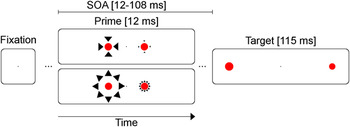
In the primed flanker task—a variant of the response priming paradigm—we used primes that were either physically the same as the targets (control primes) or Ebbinghaus primes (Fig. 2). Typically, consistent primes speed responses to the targets whereas inconsistent primes slow responses, and this response priming effect (i.e., the difference between consistent and inconsistent trials) increases with prime-target SOA.
Stimuli and procedure. Primes and flanking targets were presented in the sequence displayed (distances between stimuli are not to scale). In this example, control primes (mid upper panel) are consistent and Ebbinghaus primes (mid lower panel) are inconsistent with the targets. See text for further details.

While the control primes should produce standard response priming effects, the Ebbinghaus primes should only produce priming effects when the illusion is effective in rapid visual processing. Most important, if we are successful in dissociating early and late visual processing, the effect of the Ebbinghaus illusion should be different for shorter SOAs and in faster responses compared to for longer SOAs and in slower responses. For example, if the illusion would not be established in early visual processing, resulting priming effects should increase with decreasing response speed and with increasing SOA (see Schmidt & Haberkamp, Reference Schmidt and Haberkamp2016, for a demonstration of this effect in the Ponzo illusion).
Materials and methods
Participants
10 students from the University of Kaiserslautern, Germany (3 female, ages 21–23), with normal or corrected vision participated in Experiment 1a and b. Sample size was based on previous research (e.g., Schmidt & Haberkamp, Reference Schmidt and Haberkamp2016). All participants provided written informed consent in accordance with the Declaration of Helsinki. They were treated in accordance with the ethical guidelines of the American Psychological Association and were debriefed after the final session.
Apparatus and stimuli
Participants were seated in a dimly lit room in front of a cathode ray tube (CRT) color monitor (1280 × 1024 pixels) with a monitor retrace rate of 85 Hz at a viewing distance of approximately 70 cm. They responded with their left and right index fingers via a standard keyboard. Stimulus presentation and timing was controlled by Presentation® software (www.neurobs.com).
For the priming task, targets were small (0.82 deg diameter) or large (1.15 deg diameter) red discs (10 mm ≈ 0.82 deg of visual angle). Control primes (that should induce a standard priming effect) were two red discs the same size as the targets. Ebbinghaus primes were two red discs of medium size (0.98 deg diameter), surrounded either by small (0.33 deg diameter) or large (1.15 deg diameter) black discs with a center-to-center distance of 0.74 deg and 1.72 deg, respectively. The color of the context elements was chosen different (black) to the color of the central elements (red) to render confusions between both unlikely.
Primes and targets were presented on the left and right of a fixation square (0.08 deg × 0.08 deg). The center-to-center distance between fixation and targets was 5.16 deg, that between fixation and primes 2.46 deg (note that control primes were presented at the same positions as the central elements of the Ebbinghaus primes).
Stimuli were presented in black (0.13 cd/m2) and red (44.20 cd/m2) against a white background (60.00 cd/m2). The fixation square remained on screen at all times.
Procedure
This task was designed to measure the effect of the Ebbinghaus illusion on rapid visuomotor processing. A pair of primes at the center of the screen was succeeded by a pair of flanking targets (Fig. 2; Schmidt & Schmidt, Reference Schmidt and Schmidt2014). Participants responded as quickly and accurately as possible whether the small (half of participants: large) target disc was on the left or right side of the display by pressing a left or right button, respectively. For control stimuli, the larger prime disc was either on the same side as the larger target disc (consistent trials) or on the same side as the smaller target disc (inconsistent trials). For Ebbinghaus stimuli, the prime surrounded by small black discs was either on the same side as the larger target disc (consistent trials) or on the same side as the smaller target disc (inconsistent trials). Participants were asked to focus on fixation at all times.
Primes were presented for 12 ms and targets for 115 ms. The time interval from onset of fixation square to onset of target was constant at 1000 ms to allow for preparation to the target. The prime-target SOA varied between 12, 36, 60, 84, and 108 ms. Each participant completed two sessions of the priming task that started with a practice block followed by 36 blocks of 44 trials each. Of these, we analyzed 1760 trials (i.e., 88 trials per participant per condition) since one third of blocks featured the Delboeuf illusion and one sixth of all trials were no-go trials. Footnote 2 Summary feedback on response times and error rates was provided after each block.
Data treatment and statistical methods
In the priming task, practice trials and trials with responses faster than 100 ms or slower than 1000 ms were not analyzed (cut-off criteria that eliminated 0.41% of trials). Also, we had to remove the first three blocks (132 trials) of one participant due to instruction failure. We performed repeated-measures analyses of variance (ANOVAs) for response times and error rates with factors of consistency (C), prime-target SOA (S), and prime stimulus (P). The priming effect is captured by the consistency factor.
To analyze the time course of responses in more detail, we looked at the response time distributions. We vincentized raw response times (full distribution without any setting of cut-off criteria) by sorting them into multiple ordinal bins of data (Ratcliff, Reference Ratcliff1979). Each bin summarized 10% of the cumulative distribution, starting from the fastest responses all the way through the slowest ones. We did this sorting separately for each participant and condition (defined by the levels of consistency and SOA, separately for control and Ebbinghaus stimuli). ANOVAs were calculated separately for each level of SOA and included the new factor of bin (B) so that priming effects could be examined as a function of SOA and response speed. The last bin was not included in the analysis because it is likely to be distorted by outliers.
All P values are Huynh–Feldt-corrected and F values are reported with subscripts indicating the respective effect (e.g., F C×S for the interaction of consistency and prime-target SOA). All error rates were arcsine-transformed to comply with ANOVA requirements. Additionally, we report the effect size η 2, where 0.01 reflects a small, 0.059 a medium, and 0.138 a large effect (Cohen, Reference Cohen1988; Levine & Hullet, Reference Levine and Hullett2002).
Results and discussion
In case the Ebbinghaus illusion is based on feedforward processing, it should produce priming effects already for short SOAs and in fast responses that should not change for longer SOAs and in slower responses (Schmidt et al., Reference Schmidt, Haberkamp, Veltkamp, Weber, Seydell-Greenwald and Schmidt2011b). In case the Ebbinghaus illusion is based on slower, recurrent processing, it should produce either no priming effects or effects that—compared to the standard response priming effects—increase for longer SOAs and in slower responses (Schmidt & Haberkamp, Reference Schmidt and Haberkamp2016). Finally, in case the effect of the Ebbinghaus illusion is different in early and late visual processing, it should be different for shorter SOAs and in faster responses compared to for longer SOAs and in slower responses.
Response times and error rates
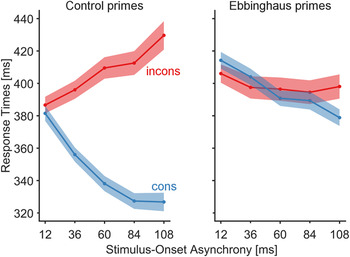
Response time results for control and Ebbinghaus primes are displayed in Fig. 3. As priming effects in response times and error rates were different for the two different prime types [F C×P(1,9) = 44.70, P < 0.001, η 2 = 0.224; F C×P(1,9) = 52.64, P < 0.001, η 2 = 0.518], we performed separate analyses for both.
Results of the priming task for control stimuli (left panel) and Ebbinghaus stimuli (right panel). Each panel displays mean response times in consistent (blue) and inconsistent (red) trials as a function of prime-target SOA. Error margins denote 95% confidence intervals.

For control primes, we observed regular response priming effects: responses were faster [F C(1,9) = 65.89, P < 0.001, η 2 = 0.484] and error rates lower [F C(1,9) = 109.13, P < 0.001, η 2 = 0.835] in consistent compared to inconsistent trials, and these priming effects increased with SOA [F C×S(3.09,27.78) = 52.73, P < 0.001, η 2 = 0.248; F C×S(4,36) = 82.79, P < 0.001, η 2 = 0.711].
This pattern of results was different for Ebbinghaus stimuli: there was no main effect of consistency but priming effects were negative for SOAs <84 ms and positive for SOAs >84 ms [F C×S(2.68,24.11) = 4.90, P = 0.010, η 2 = 0.033; F C×S(2.20,19.78) = 3.53, P = 0.045, η 2 = 0.064]. This qualitative difference points to a fundamental modulation of Ebbinghaus priming effects by temporal factors.
Response time distributions
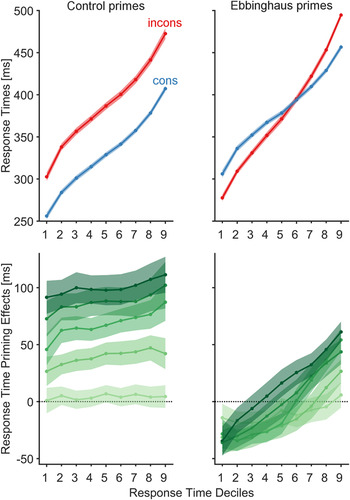
The SOA is only one determinant of prime processing time; another is the spontaneous variation in a participant’s response speed from trial to trial. Thus, we look at response time priming effects for control and Ebbinghaus primes as a function of response speed and SOA (Fig. 4). As response speed influenced priming effects differently for the different primes [F C×S×P×B(10.70,96.26) = 2.66, P = 0.005, η 2 = 0.022], we performed separate analyses for both. For control primes, priming effects were increasing with SOA, and slightly increasing with slower response speeds [F C×S(2.75,24.75) = 48.42, P < 0.001, η 2 = 0.263; F C×B(1.64,14.80) = 6.92, P = 0.010, η 2 = 0.012; no interaction between both factors: F C×S×B(8.90,80.08) = 1.07, P = 0.392, η 2 = 0.003].
Response time distributions in the priming task for control stimuli (left panels) and Ebbinghaus stimuli (right panels). Upper panels: Mean response times in consistent (blue) and inconsistent (red) trials as a function of response speed (deciles 1 to 9). Lower panels: Mean response time priming effects as a function of response speed (deciles 1 to 9), separately for the different levels of SOA (saturation increasing with SOA). Error margins denote 95% confidence intervals.

For Ebbinghaus primes, effects were negative for shorter SOAs and positive for longer SOAs [F C×S(2.94,26.44) = 5.10, P = 0.007, η 2 = 0.031], negative in faster responses and positive in slower responses [F C×B(2.55,22.95) = 24.02, P < 0.001, η 2 = 0.138], and the difference between priming effects in faster and slower responses was increasing with SOA [F C×S×B(8.56,77.06) = 5.85, P < 0.001, η 2 = 0.032]. Note that response time bins are calculated from individual participant data so that the observed modulation of priming effects is not just resulting from interindividual differences.
In sum, the strength of the Ebbinghaus illusion effect depended on the time the visual system had to process the primes before the target signal entered the system (SOA) or before the motor response was executed (response speed). In fact, the effect of the illusion reverses, with a negative effect for shorter SOAs and in fast responses and a positive effect for longer SOAs and in slower responses (Fig. 4). We calculated the relative influence of SOA and response speed on the Ebbinghaus illusion effect by calculating correlations between (1) priming effects and SOA and (2) priming effects and response time bins calculated from prime onset (as a measure of available processing time). We found that SOA explained about 19% of the variance [r(48) = 0.44, P = 0.001], while time since prime presentation explained about 56% of the variance [r(82) = 0.75, P < 0.001].
Experiment 1b
In Experiment 1b, we measure the perceptual strength of the Ebbinghaus illusion in a traditional, perceptual forced choice discrimination task with the same stimuli, and experimental surroundings as in Experiment 1a.
Materials and methods
Participants
The same participants took part in Experiments 1a and b.
Apparatus and stimuli
The apparatus was the same as in Experiment 1a. Control comparison stimuli were 11 red discs that varied in size between small (0.57 deg diameter) and large (1.39 deg diameter) in steps of approximately 0.08 deg (including two stimuli of the same size as the targets). For Ebbinghaus comparison stimuli, these control comparison stimuli were surrounded with large black discs (1.15 deg diameter), equivalent to the Ebbinghaus stimulus with large context elements from Experiment 1a (see Fig. 5 for examples). Stimuli were presented at the same positions as the primes in Experiment 1a.
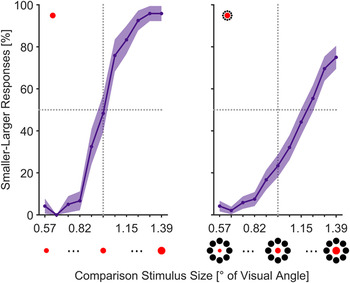
Results of the perceptual task for control stimuli (left panel) and Ebbinghaus stimuli (right panel). Each panel displays percent of smaller-larger responses with respect to a target stimulus (upper left in each graph) as a function of the comparison stimulus size (examples below each graph). The horizontal dotted lines indicate chance performance; the vertical dotted lines indicate the points of objective (physical) equality. Error margins denote 95% confidence intervals. Note that the comparison stimulus in the Ebbinghaus condition was always the central red disc surrounded by eight large black discs.

Procedure
The perceptual task was designed to directly measure the perceived size of the primes, given the same stimulus arrangement, stimulus duration, and directives as in the priming task. This is important because the perceptual effects of illusions are susceptible to the method of measurement (Foster & Franz, Reference Foster and Franz2014).
Each trial presented two central stimuli at the same positions as the primes in the priming task. One was a red disc of medium size (0.98 deg diameter), either without surrounding context (control) or with surrounding small black discs (Ebbinghaus). The other stimulus was picked randomly from the set of control comparison stimuli (control) or the set of Ebbinghaus comparison stimuli (Ebbinghaus), respectively (Fig. 5).
Participants responded as accurately as possible whether the small (half of participants: large) disc was on the left or right side of the display by pressing a left or right button, respectively. There was no time limit. Participants were asked to focus on fixation at all times.
Stimuli were presented for 12 ms. Participants responded to two sessions of the perceptual task, each after one session of the priming task. Each session started with a practice block followed by 15 blocks of 22 trials each. Of these, we analyzed 396 trials since 40% of blocks featured the Delboeuf illusion. Footnote 2 No feedback was provided.
Data treatment and statistical methods
In the perceptual task, practice trials were not analyzed. Participants’ responses were analyzed with respect to the physical difference between the two discs in the control and Ebbinghaus stimuli, respectively. We collapsed responses across participants and compared the point of subjective equality between the different stimuli.
Results and discussion
The results are displayed in Fig. 5. For control stimuli, participants performed at chance level when discs were about equal size and were increasingly better at estimating relative size with increasing difference between discs. For Ebbinghaus stimuli, participants performed at chance level when discs were different by about 21% (0.21 deg; Ebbinghaus comparison stimulus: 1.19 deg vs. medium disc: 0.98 deg). This was about 65% of the physical difference between the actual target discs (0.33 deg; small disc: 0.82 deg vs. large disc: 1.15 deg). Note that this positive effect of the illusion was observed in all participants and was obtained although stimuli were displayed for only 12 ms; also note that the differences in performance did solely result from the context elements, as the variations in the size of the red discs was the same in all stimuli.
For statistical comparison, we fitted logistic functions for each participant. The estimated points of subjective equality were different for control and Ebbinghaus stimuli [T(9) = −3.45, P = 0.007], validating the perceptual effect of the illusion.
Experiment 2
The results of Experiment 1a for shorter SOAs and in faster responses might be considered to be driven by the context elements of the Ebbinghaus stimuli (i.e., by the black discs) rather than by an interaction of the context elements with the central element. This might either result from a complete dismissal of the central element (e.g., because context elements are closer to the targets), or from a confusion of central and context elements (e.g., because both have the same shape). Both might exclusively happen for shorter SOAs and in fast responses, for example, because of a time-consuming internal shift of attention from the context elements to the central element. In both cases, when only context elements would be considered, the Ebbinghaus stimulus with large context elements would be considered a large prime and the Ebbinghaus stimulus with small context elements would be considered a small prime, explaining our results of Experiment 1a. To control for these possibilities, we performed two control experiments: one testing priming effects of Ebbinghaus displays with removed central elements (Experiment 2) and one testing priming effects of Ebbinghaus displays with context elements of different shape and number (Experiment 3).
Materials and methods
Participants
Eight students from the University of Kaiserslautern, Germany (three female, ages 21–23), with normal or corrected vision participated in the experiment. For other details, see Experiment 1a.
Apparatus and stimuli
See Experiment 1a. As primes, we included Ebbinghaus displays with central elements as well as without central elements.
Procedure: Priming task
See Experiment 1a. Each participant completed a single session of the priming task (one practice block followed by 30 blocks of 40 trials each).
Data treatment and statistical methods
See Experiment 1a. We only report analyses and results for response time distributions.
Results and discussion
Priming task: Response time distributions
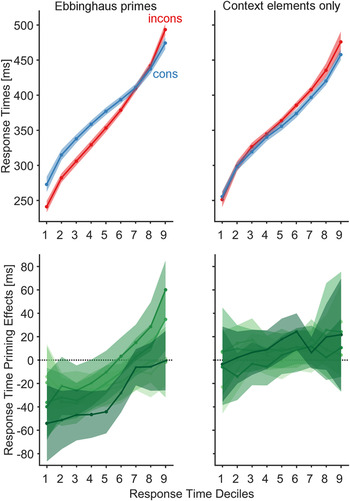
Response time priming effects for Ebbinghaus displays with and without central elements are shown as a function of response speed and SOA (Fig. 6).
Response time distributions in the priming task for Ebbinghaus displays (left panels) and Ebbinghaus displays with removed central elements (right panels). For further details see Fig. 4.

As response speed influenced priming effects by trend differently for the different primes [F C×P×B(3.68,18.38) = 2.87, P = 0.056, η 2 = 0.018], we performed separate analyses for Ebbinghaus displays with and without central elements. For Ebbinghaus displays with central element, we observed the same pattern of results as that in Experiment 1: a negative priming effect in fast responses and a positive effect in slower responses [F C×B(2.82,19.75) = 11.57, P < 0.001, η 2 = 0.082]. However, the effect of SOA was somewhat different; specifically, the longest SOA did not produce any positive priming effect. Importantly, for Ebbinghaus displays without central element we did not observe any significant priming effect and no significant modulation of priming effects by SOA or response speed.
In sum, the results for the Ebbinghaus displays with central elements were qualitatively similar to those of Experiment 1a. However, we did not observe priming effects for the Ebbinghaus displays without central elements, showing that the context elements alone cannot induce a pattern of results as that observed in Experiment 1a. This implies that the reversed effect in shorter SOAs and faster responses cannot be explained by an isolated effect of context elements, for example, as a result of an internal shift of attention.
Experiment 3
In Experiment 3, we tested whether the reported results for the Ebbinghaus illusion of Experiment 1 stem from a confusion of the central and the context elements because both have the same shape. This might exclusively happen for shorter SOAs and in fast responses, for example, because of a time-consuming internal shift of attention from the context elements to the central element.
Materials and methods
Participants
Eight students from the University of Kaiserslautern, Germany (two female, ages 21–23), with normal or corrected vision participated in the experiment. For other details, see Experiment 1a.
Apparatus and stimuli
See Experiment 1a. Ebbinghaus primes were two red discs of medium size (0.98 deg diameter), surrounded by different small and large black context elements. These were either four small (0.29 deg × 0.20 deg) or large (1.07 deg × 0.69 deg) triangles or eight small (0.29 deg × 0.25 deg) or large (0.98 deg × 0.87 deg) triangles (Fig. 7). In general, using different shapes for central and context elements reduces the perceptual effect but still produces a positive illusion effect (e.g., Rose & Bressan, Reference Rose and Bressan2002).
Stimuli and procedure. Primes were either Ebbinghaus primes with four triangle context elements (mid upper panel) or with eight triangle context elements (mid lower panel). For further details see Fig. 2.

Central and context elements were arranged with a center-to-center distance of 0.74 deg and 1.72 deg, respectively. Primes and targets were presented on the left and right of a fixation square (0.08 deg × 0.08 deg). The center-to-center distance between fixation and primes was 2.46 deg and that between fixation and targets was 5.16 deg.
Stimuli were presented in black (0.13 cd/m2) and red (44.20 cd/m2) against a white background (60.00 cd/m2). The fixation square remained on screen at all times.
Procedure: Priming task
See Experiment 1a. Prime-target SOA varied between 12, 60, and 108 ms. Each participant completed one session of the priming task (one practice block followed by 24 blocks of 30 trials each).
Data treatment and statistical methods
See Experiment 1a. We only report analyses and results for response time distributions.
Results and discussion
Priming task: Response time distributions
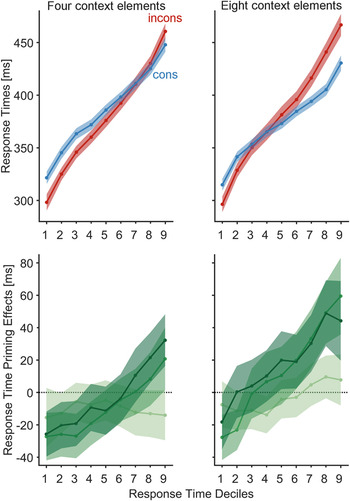
Response time priming effects for four and eight context elements are displayed as a function of response speed and SOA (Fig. 8). As response speed influenced priming effects differently for the different primes [F C×P×B(4.18,29.27) = 7.56, P < 0.001, η 2 = 0.004], we performed separate analyses for four and eight context elements. For four context elements, we observed a small negative priming effect that reversed into a positive effect in the slowest responses [F C×B(1.81,12.64) = 8.59, P = 0.005, η 2 = 0.029]. This reversal was more pronounced with longer SOAs [F C×S×B(4.58,32.07) = 5.11, P = 0.002, η 2 = 0.021]. For eight context elements, we observed exactly the same pattern of results, although priming effects were overall stronger [F C×B(2.91,20.39) = 25.45, P < 0.001, η 2 = 0.071; F C×S×B(5.14,36.01) = 3.69, P = 0.008, η 2 = 0.017].
Response time distributions in the priming task for Ebbinghaus primes with four context elements (left panels) and eight context elements (right panels). For further details see Fig. 4.

In sum, the results were qualitatively similar to those of Experiment 1a. Although priming effects were smaller for the Ebbinghaus primes with context elements of different shape, priming effects still reversed, with a negative illusion effect with shorter SOAs and in fast responses and a positive illusion effect with longer SOAs and in slower responses. This argues against an explanation in which the reversal effect is based on a confusion of context elements and central element.
General discussion
We studied the temporal dynamics of visual processing via the Ebbinghaus illusion. We observed a dissociation between the illusion effects in fast responses and the effects in slow responses. Thereby, our results illustrate the role of response speed for actions within our visual environment. They show that under specific circumstances different response speeds can promote opposite action alternatives.
Specifically, we observed a dissociation between priming effects of the Ebbinghaus illusion for shorter SOAs and in fast responses and those priming effects for longer SOAs and in slower responses (Experiment 1a). In slower responses and for long SOAs, effects were in the expected direction of the illusion (i.e., the red disc was acting as a small prime when surrounded by large black discs and as a large prime when surrounded by small black discs). However, in fast responses and for short SOAs, these effects were reversed. This was the case although our stimuli induced the typical perceptual illusion effect in each participant (Experiment 1b). We replicated the reversal effect with a different set of participants (Experiment 2) and for Ebbinghaus primes with context elements of different shape and number (Experiment 3), but not with context elements alone (Experiment 2). These results make it unlikely that the reversal effect results from a confusion of central and context elements or from an internal shift of attention between them.
Our findings support theories that stress the importance of temporal aspects in visual processing and differentiate between early and late phases of processing (Lamme & Roelfsema, Reference Lamme and Roelfsema2000; Bullier, Reference Bullier2001; Hochstein & Ahissar, Reference Hochstein and Ahissar2002; Roelfsema, Reference Roelfsema2006; Hegdé, Reference Hegdé2008; Schmidt et al., Reference Schmidt, Haberkamp, Veltkamp, Weber, Seydell-Greenwald and Schmidt2011b). Specifically, our results suggest that the Ebbinghaus illusion—as a result of context integration mechanisms—arises relatively late in visual processing (slower responses, long SOAs, perceptual task with no time pressure). This is in line with earlier notions (Murray et al., Reference Murray, Boyaci and Kersten2006; Song et al., Reference Song, Schwarzkopf and Rees2011; Schmidt & Haberkamp, Reference Schmidt and Haberkamp2016). However, for the first time, we report an effect of the Ebbinghaus illusion in fast responses and for short SOAs that is reversed with respect to the typical perceptual effect of the illusion.
We suggest that the observed dissociation between the effects of the illusion in early and late phases of processing is driven by the different modes of visual processing in these phases. Generally, it can be distinguished between an initial feedforward-mediated gist of the scene followed by later feedback-mediated more elaborate representations (coarse-to-fine processing, e.g., Hegdé, Reference Hegdé2008). Early processing, which is mediated by the fast magnocellular pathway and its cortical projections, is representing visual stimuli with lower spatial frequency. Later processing, which is mediated by the slower parvocellular pathway and its cortical projections, is representing visual stimuli with higher spatial frequency (Hughes et al., Reference Hughes, Nozawa and Kitterle1996; Nowak & Bullier, Reference Nowak, Bullier, Rockland, Kaas and Peters1997).
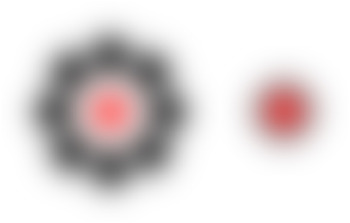
The different characteristics of these representations affect the Ebbinghaus primes in very specific ways. With low spatial frequency, some elements of the primes merge. Consequently, in its early representation, the Ebbinghaus prime with small context elements might act as a small prime and that with large context elements as a large prime (Fig. 9). Only later on, higher spatial frequency information is available so that context elements can reliably be distinguished from central elements and context integration mechanisms can take effect.
Ebbinghaus primes with a Gaussian filter that removes all spatial frequencies >0.5 cycles/degree (cf. Legge, Reference Legge1978). Now, the Ebbinghaus prime with large context elements (left) might be considered to be the larger prime.

As perceptual identification begins with the first available information and is updated online as more information becomes available (e.g., Eriksen & Schultz, Reference Eriksen and Schultz1979), this change in representations explains the observed reversal in priming effects over time. The necessary spatial resolution to identify, assign, and relate target and context information is only contained in the high-frequency information conveyed in the later representations mediated by the slow parvocellular system. Consequently, we argue that the processing characteristics of the Ebbinghaus illusion as observed in our priming task demonstrate the difference between processing in the fast magnocellular pathway and in the slow parvocellular pathway.
Our findings also stress the general importance of temporal factors in the perception and processing of visual illusions. Already Piaget (Reference Piaget1969) showed a reversed perceptual illusion effect for short presentation times of the Ebbinghaus-related Delboeuf illusion (also see Oyama & Morikawa, Reference Oyama, Morikawa and McGaugh1985) Footnote 3 and reported marked effects of presentation time on other illusions. Along with other newer studies on the temporal development of visual illusions (e.g., van Zoest & Hunt, Reference van Zoest and Hunt2011; de Brouwer et al., Reference de Brouwer, Brenner, Medendorp and Smeets2014; Schmidt & Haberkamp, Reference Schmidt and Haberkamp2016), our findings again demonstrate that it is important to consider temporal aspects when studying visual illusions—especially in tasks that involve fast motor responses.
Finally, our results suggest that the integration of information across space, which is necessary for the Ebbinghaus illusion to become effective, is not mediated by rapid feedforward mechanisms. Indeed, Ebbinghaus priming effects keep increasing even in the slowest responses. This suggests that the illusion is depending on more time-consuming mechanisms (for a similar observation, see Schmidt & Haberkamp, Reference Schmidt and Haberkamp2016). This might be modulatory feedback from higher to lower levels, or horizontal connections within levels of the visual hierarchy—given that they are even slower than feedback connections (Sugihara et al., Reference Sugihara, Qiu and von der Heydt2011). Previous studies demonstrated an involvement of V1 in the representation of the illusion percept in context illusions (Murray et al., Reference Murray, Boyaci and Kersten2006; Fang et al., Reference Fang, Boyaci, Kersten and Murray2008). Based on our results, we argue that although the Ebbinghaus illusion is at some point represented within V1, either horizontal or feedback connections contribute to this representation and the resulting illusion. This is in line with previous arguments that context illusions are based on feedback from higher visual areas which are extracting three-dimensional context of the background (Song et al., Reference Song, Schwarzkopf and Rees2011).
In conclusion, we used the Ebbinghaus illusion to study the temporal dynamics of the visual system. We observed a dissociation between early and late phases of visual processing of the illusion. Specifically, we found a reversed illusion effect in early processing and a relatively late formation of the typical illusion effect. We argue that our findings originate from the differences between early feedforward-mediated gist of the scene processing and later feedback-mediated more elaborate processing. Thereby, our findings illustrate the important role of response speed for actions within our visual environment.
Acknowledgments
Thanks to Thomas Schmidt, Thorsten Albrecht, and Florian Schiller for helpful discussions, to Michael Herzog, Stephen E. Palmer, and Johan Wagemans for comments, and to Benito Arnoldi, Lukas Hoffmann, and Lisa Noé for data collection.