Introduction
Successful lactation in the dairy cow requires that the mammary glands produce a large number of potential milk-secreting cells during pregnancy and dry periods. Both mammary growth and initiation of milk synthesis are intimately dependent upon complex interactions among hypophyseal, adrenal, ovarian and placental hormones. Placental lactogens (PLs) are structurally related to prolactins (PRLs) and growth hormones (GHs), and play a crucial role in stimulating the development of the mammary gland in synergy with steroid and thyroid hormones (Cowie et al., Reference Cowie, Tindal and Yokoyama1966; Schams et al., Reference Schams, Russe, Schellenberg, Prokopp and Chan1984; Byatt et al., Reference Byatt, Eppard, Veenhuizen, Curran, Curran, McGrath and Collier1994). Patel et al. (Reference Patel, Hirako, Takahashi, Sasaki and Domeki1996) reported that plasma bovine placental lactogen (bPL) levels were positively associated with the stage of gestation but not with fetal number, and the concentration of bPL in the fetus decreased with advancing gestation, whereas bPL concentration peaked in the maternal circulation during the last third of pregnancy and then reached a plateau. The gene coding bPL (bPL) spans approximately 12.5 kb, contains five exons, and encodes a predictive preprohormone of 236 amino acids with a signal peptide of 36 amino acids (Schuler et al., Reference Schuler, Shimomura, Kessler, Zieler and Bremel1988; Kessler and Schuler, Reference Kessler and Schuler1991).
Based on the important roles in the growth and development of mammary gland (mammogenesis), synthesis of milk (lactogenesis), and maintenance of milk secretion (galactopoiesis), bPL is considered a strong candidate gene for milk production traits in dairy cattle. However, the associations between bPL and milk production traits, as well as physical location on the chromosome in dairy cattle remain undetermined. The objectives of the current study were to detect polymorphisms of bPL and determine association of such polymorphisms with milk production traits in Chinese Holstein cattle.
Material and methods
Animals
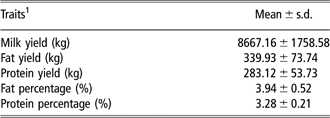
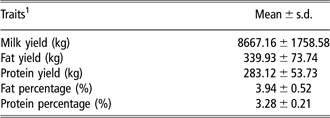
Blood samples of 1028 Chinese Holstein cows were collected randomly from eight Chinese Holstein cattle farms in Beijing, including 12 sire families with 58 to 132 daughters from each sire. Regular and standard performance testing, i.e. DHI system, has been carried out in each farm since 1999. The individual phenotype for each of five milk production traits (i.e. milk yield, fat yield, protein yield, fat percentage and protein percentage over 305 days) is composed of two or three records corresponding to different parity, and were obtained from the Beijing Dairy Cattle Center. The total number of production records was 2324, and the mean and standard deviation (s.d.) of the five traits are presented in Table 1.
Means and s.d. of five milk production traits
Genotyping and sequencing analysis
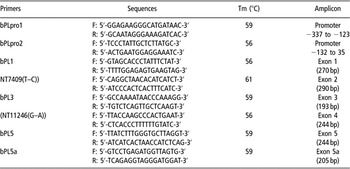
Genomic DNA was isolated from blood samples by the phenol–chloroform method. Using Oligo 6.0, eight pairs of primers corresponding to five exons and promotor regions were designed according to the genomic sequence of bPL (GenBank accession no. AH001151; Table 2). Polymerase chain reactions (PCR) were carried out in 20 μl volume including 50 ng of genomic DNA, 0.2 mM each primer and 0.5 U of Taq DNA polymerase. The PCR protocol was 94°C for 7 min, followed by 35 cycles of 94°C for 30 s, annealing for 45 s and 72°C for 30 s, with a final extension at 72°C for 10 min. The PCR products were genotyped by single-strand conformation polymorphism (SSCP) to screen the mutations within the amplified region. In total, 2 μl of the PCR product of each sample was mixed with 8 μl of denaturing buffer (98% formamide, 0.09% xylene cyanole FF and 0.09% bromophenol blue) and then denatured at 98°C for 10 min, followed by a rapid chill on ice for 10 min. The denatured PCR products were electrophoresed on 12% polyacrylamide gels for 18 h at 8 V/cm and stained by 0.2% AgNO3 for 20 min, and then 3% Na2CO3 for about 5 min (Qu et al., Reference Qu, Li, Wu and Yang2005). Genotypes were recorded according to band patterns.
Primer sequences for promoter and exons in bPL

To identify the mutation site, the PCR products of homozygotes were purified using BioGene Geneclean III Kit (Carlsbad, CA, USA), and then sequenced on the ABI 377 DNA Sequencer using the BigDyeTM Terminator Cycle Sequencing Kit (Applied Biosystems, Foster, CA, USA). Both forward and reverse primers were applied to sequencing.
The PeptideStructure program of GCG version 11.1 (Accelrys Inc., San Diego, CA, USA) was used to predict the protein secondary structure.
Association analysis
Using an animal model and the additive genetic relationship matrix, the genotypic value, differences between genotypes, and additive and dominance effects for each trait were evaluated using the PEST software (Groeneveld, Reference Groeneveld1990), respectively. Pedigrees of animals detected in the present study were traced back to three generations to create the numerator relationship matrix, and hence the A−1 matrix included 2604 animals. The animal model is as follows:

where yi is the phenotypic value for each trait of cow i, hysj the herd-year-season effect, Tk the parity number effect, Mm the month effect, Gn the fixed effect corresponding to the genotype of NT7409(T–C) or NT11246(G–A) (AA, BB, or AB), αi the random polygenic component account for all known pedigree relationships (‘animal model’; (Lynch and Walsh, Reference Lynch and Walsh1997), including ungenotyped individuals whose phenotypes were ignored), pi the permanent environmental effect and ei the random residual. All variance–covariance matrices have been estimated by restricted maximum likelihood using the EM algorithm, as applied in the REMLF90 programs (Misztal, 1999). Iterations were performed until the criterion of convergence was less than 1 × 10⁻⁷.
The additive and dominance effects were estimated according to the following formulas (Falconer and Mackay, Reference Falconer and Mackay1996):

where AA, BB and AB are the genotypic values of homozygous and heterozygous genotypes.
Radiation hybrid (RH) mapping
RH mapping was carried out with a 5000-rad RH panel consisting of 90 cell lines and bPL-specific oligonucleotide, the forward and reverse primer sequences were 5′-ATCCATCCCGTCAAAAGC-3′ and 5′-CAGTTCCTGCTATTTGTG-3′ with an expected PCR product size of 230 bp (Womack et al., Reference Womack, Johnson, Owens, Rexroad, Schlapfer and Yang1997). The PCR protocol was 94°C for 7 min, followed by 35 cycles of 94°C for 30 s, 54°C for 45 s, 72°C for 30 s and a final extension at 72°C for 10 min. The amplification of each cell line was assessed by electrophoresis in 2% agarose gel. The hybrids were scored for the presence/absence of the amplified product. Each marker was repeated twice to minimize possible experimental bias. Positions of the bPL on the map will be given relative to markers in the third-generation whole-genome comparative map of cattle and humans (Everts-van der Wind et al., Reference Everts-van der Wind, Larkin, Green, Elliott, Olmstead, Chiu, Schein, Marra, Womack and Lewin2005). RH analysis was carried out with RHMAPPER-1.22 (Slonim et al., Reference Slonim, Kruglyak, Stein and Lander1997).
Results
RH mapping
We used RH to identify the genetic position of bPL on the chromosome. Statistical analysis of the PCR results on RH mapping vectors was carried out with RHMAPPER 1.22 (Slonim et al., Reference Slonim, Kruglyak, Stein and Lander1997). Our results indicated that bPL is located near the markers RM185 and CC549051 on Bos Taurus autosome (BTA) 23 with distance 23.2 CR and LOD score 8.2.
Identification of polymorphisms
With eight pairs of primers, we successfully amplified out all the expected fragments for five exons and promoter region of bPL. After SSCP, two single-nucleotide polymorphisms (SNPs) were identified in exons 2 and 4. By comparing the sequences of two types of homozygotes on each SNP, we found that the SNP within exon 2 showed a nucleotide transition from T to C at +7409, called Nt7409(T–C), which led to an alteration of the amino acid from Val to Ala (Val 37Ala). On the other hand, the latter within exon 4 caused a base alteration of G into A at +11 246, named Nt11246(G–A). However, it was a synonymous mutation. As shown in Table 3, the frequency for Nt7409C (0.621) at the NT7409(T–C) locus was higher than that for Nt7409T (0.379), whereas for Nt11246(G–A), the frequency for Nt11246G (0.824) was much greater than that for Nt11246A (0.176).
Genotypic and allele frequencies of NT7409(T–C) and NT11246(G–A)

Note: n means the number of cows.
Further, to determine whether NT7409(T–C) induces change of the protein structure, comparison of two kinds of protein secondary structure corresponding to Val 37 and Ala 37 was performed by the GCC 11.1 program. We found that one GOR turn was present at the position of Ala 37, but absent at the position of Val37, indicating NT7409(T–C) may change the dimensional structure and function of bPL (Figure 1).
Prediction bPL protein secondary structure between Val 37 (37V) and Ala 37 (37A). The asterisk indicates position 37 and the arrowhead indicates GOR turn.

Association between bPL and milk production traits
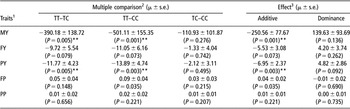
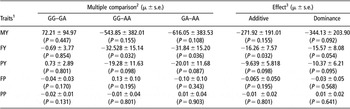
With the PEST program, the genotypic values of milk yield, fat yield, protein yield, fat percentage and protein percentage for NT7409(T–C) and NT11246(G–A) were estimated, and the differences between different genotypic values of TT, CC or TC and additive and dominant effects of NT7409(T–C) and NT11246(G–A) loci for the five milk production traits were also tested. The cows with the TT genotype NT7409(T–C) had lower milk and protein yields than those with TC (P = 0.005 and 0.005; Table 4) and CC genotypes (P = 0.001 and 0.003; Table 4). Both milk and protein yields showed no significant dominance effects (Table 4). However, no significant association was observed between NT11246(G–A) and the five milk production traits (Table 5).
Comparison between different genotypic values, additive and dominance effects of NT7409(T–C) on the five milk production traits

1MY = milk yield; FY = fat yield; PY = protein yield; FP = fat percentage; PP = protein percentage.
2Comparison between different genotypic values of MY, FY, PY, FP and PP for NT7409(T–C) locus.
3Additive and dominant effects of NT7409(T–C) locus for MY, FY, PY, FP and PP.
Comparison between different genotypic values, additive and dominance effects of NT11246(G–A) on the five milk production traits

1MY = milk yield; FY = fat yield; PY = protein yield; FP = fat percentage; PP = protein percentage.
2Comparison between different genotypic values of MY, FY, PY, FP and PP for NT11246(G–A) locus.
3Additive and dominant effects of NT11246(G–A) locus for MY, FY, PY, FP and PP.
Discussion
Many previous studies have shown that bovine bPL plays an important role in stimulating the development of the mammary gland, differentiation and function of mammary cell to secrete milk and systemic adjustments in maternal metabolism in pregnancy and lactation (Cowie et al., Reference Cowie, Tindal and Yokoyama1966; Byatt et al., Reference Byatt, Eppard, Veenhuizen, Curran, Curran, McGrath and Collier1994; Patel et al., Reference Patel, Hirako, Takahashi, Sasaki and Domeki1996). We, therefore, propose that a polymorphism in bPL may affect milk production traits in dairy cattle. In the present study, we first identified two polymorphic loci within exons 2 and 4 of bPL, of them, NT7409(T–C) within exon 2 led to a change of Val to Ala at position 37. Our association analysis further revealed that this SNP has significant associations with milk production traits. Interestingly, by comparing the secondary structure of bPL between Val 37 and Ala 37, we found that the mutation Val/Ala induced one GOR turn at position 37. Our findings implied that the missense mutation, NT7409(T–C), may be the principal factor for milk production traits by changing the dimensional confirmation and function of bPL. Determining the differences of the two profile types is critical to understanding the functional mechanism of the bPL. Further investigation is required to verify that the mutation found in this study affects the function of bPL, for example, determination of differences in the protein expression of different genotypes.
So far, in dairy cattle, many quantitative trait loci (QTLs) affecting milk production traits have been identified (http://www.vetsci.usyd.edu.au/reprogen/QTL_Map/), of which BTA3, 6, 9, 14, 20 and 23 were shown to harbor QTLs with pleiotropic effect on multiple milk production traits (Khatkar et al., Reference Khatkar, Thomson, Tammen and Raadsma2004). Bennewitz et al. (Reference Bennewitz, Reinsch, Grohs, Leveziel, Malafosse, Thomsen, Xu, Looft, Kuhn, Brockmann, Schwerin, Weimann, Hiendleder, Erhardt, Medjugorac, Russ, Forster, Brenig, Reinhardt, Reents, Averdunk, Blumel, Boichard and Kalm2003) reported that on BTA23 existed a QTL affecting milk and protein yields at a position around 60 cM. In this study, bPL was mapped to be close to RM185 by RH mapping, which was located near 60 cM on BTA 23 (Naoya et al., Reference Naoya, Takasuga, Mizoshita, Takeda, Sugimoto, Mizoguchi, Hirano, Itoh, Watanabe, Reed, Snelling, Kappes, Beattie, Bennett and Sugimoto2004). Our association result is consistent with that of linkage analysis by Bennewitz et al. (Reference Bennewitz, Reinsch, Grohs, Leveziel, Malafosse, Thomsen, Xu, Looft, Kuhn, Brockmann, Schwerin, Weimann, Hiendleder, Erhardt, Medjugorac, Russ, Forster, Brenig, Reinhardt, Reents, Averdunk, Blumel, Boichard and Kalm2003), implying that bPL may be a QTL on BTA23 affecting milk production traits. However, much more in-depth analysis will be required for the chromosomal region around 60 cM and the protein-folding work of NT7409(T–C) to prove whether the mutation is the casual site.
Taken together, our association analysis revealed an SNP within exon 2 of bPL, which showed significant associations with four milk production traits in Chinese Holstein. Further, bPL has been localized near RM185 on BTA 23 and at the same position as the region identified by previous linkage mapping. Based on the findings of this study, we think that bPL could be a potential useful genetic marker in a selection program in Holstein cattle.
Acknowledgments
This work was supported by the ‘973’ Project (2006CB102107), ‘948’ Project (2006-G48), ‘863’ Project (2007AA10Z157) and the National Key Technologies R&D Program (2006BAD04A01).