I. INTRODUCTION
Recently, diluted magnetic semiconductors (DMSs) have triggered considerable study for their potential applications in spin-based magnetic devices.Reference Žutić, Fabian and Sarma1,Reference Karamat, Rawat, Lee, Tan, Ke, Chen and Sun2 Since Dietl et al. predicted that oxide-based DMSs can possess ferromagnetic order at room temperature (RT).Reference Dietl, Ohno, Matsukura, Cibert and Ferrand3 A number of transition-metal (TM) doped oxide semiconductors, such as ZnO,Reference Wang, Xing, Yan, Yan and Li4,Reference Jayalakshmi and Balasubramaniana5 TiO2,Reference Hu, Hayashi, Fukumura, Akagi, Tsukada, Happo, Hosokawa, Ohwada, Takahasi, Suzuki and Kawasaki6,Reference Prajapati, Kumar, Kumar, Chatterjee and Ghos7 and In2O3,Reference Myagkov, Tambasov, Bayukov, Zhigalov, Bykova, Mikhlin, Volochaev and Bondarenko8,Reference Yan, Qiao, Zhong, Au and Dou9 have been reported to exhibit high-temperature ferromagnetism. Especially, indium tin oxide (ITO, or Sn-doped In2O3) with good electrical conductivity, high optical transparency, and wide band-gap (3.75 eV) has been considered as a promising host material of DMSs for achieving RT ferromagnetism. However, the origin of RT ferromagnetism for the In2O3-based DMSs still remains controversy. Intrinsic ferromagnetism and its mechanisms in this system have been reported in many literature studies.Reference Park, You, Jeon and Shin10–Reference Xing, Yi, Wang, Liao, Yu, Shen, Huan, Sun, Ding and Wu12 Whereas some groups suggest that the second magnetic phase such as TM metal clusters or TM oxides can be considered as the origin of observed ferromagnetic ordering. For example, Subías et al. conclude that the observed ferromagnetism in high-doped In2O3 and ITO films is due to the formation of metallic Co clusters.Reference Subías, Stankiewicz, Villuendas, Lozano and García13 Jiang et al. attributed the RT ferromagnetism in Fe/Sn-codoped In2O3 powders to the precipitated Fe3O4 impurity.Reference Jiang, Xi, Ma, Qin, Fan, Zhang, Zhou and Xu14 Kohiki et al. attributed the observed RT ferromagnetism to the presence of ferromagnetic Fe2O3 nanoclusters in Fe-doped In2O3 powders.Reference Kohiki, Murakawa, Hori, Shimooka, Tajiri, Deguchi, Oku, Arai, Mitome and Bando15 These may be due to the low solubility of TM dopants in the In2O3 or ITO host material. To clarify the magnetic mechanisms responsible for the observed ferromagnetism in this system, it is essential to deeply understand the chemical state as well as the local atomic and electronic structures around TM dopants. Therefore, the adequate techniques should be used to decide whether the TM dopant is substituted into the In2O3 lattice or forms small aggregates of another chemical species, such as TM metal clusters or oxides’ secondary phases. In this paper, the Co-doped ITO films with different Co concentrations were prepared by RF magnetron sputtering techniques. The influence of Co doping on the local Co structures of the films was investigated in detail by using an X-ray absorption spectroscopy (XAS) tool at Co-K edge and Co-L edge. The XAS techniques including X-ray absorption near-edge structure (XANES) and extend X-ray absorption fine structure (EXAFS) are sensitive to the valence state and local structure around the Co dopants even in a dilute concentration. These results can help us to provide new structural information for discussing the origin of ferromagnetism in the Co-doped ITO systems.
II. EXPERIMENTAL
The Co-doped ITO films with a thickness of about 400 nm were grown on Si(100) substrates at 450 °C by RF magnetron sputtering. The background pressure in the deposition chamber was evacuated to about 8 × 10⁻⁵ Pa. All the films were sputtered in 0.8 Pa of pure Ar and O2 mixed gases (purity 99.999%) with a flow rate of 10 sccm and 1 sccm, respectively. The ITO ceramic target containing some small Co pieces was used to prepare the Co-doped ITO films. By changing the number of small Co pieces, the 5, 7, 8.5, and 13 at.% Co-doped ITO films were readily prepared. The Co concentration in the ITO films was estimated using energy dispersive spectroscopy. The XAS measurements around the Co K-edge were carried out in the total fluorescence mode at 4B9A beamline of X-ray diffraction station at Beijing Synchrotron Radiation Facility (BSRF). The XAS measurements at the Co L-edge were carried out in the total electron-yield mode at the 4B7B beamline of soft X-ray station at BSRF. The XAS measurements at RT were made with X-ray polarization along the horizontal direction. The angle between the film surface and the incident X-ray was fixed to 45° to avoid a polarization effect of the incident X-rays. This incident beam was collimated by slits and monochromatized by Si(111) crystal detuned from 40 to 50% to suppress higher order harmonic content from the beam. The energy resolution ΔE/E was estimated to be about 10−4. The photon energy for the XAS measurements has been calibrated by measuring a metallic Co foil and was reproducible to within 0.1 eV between scans.
III. RESULTS AND DISCUSSION
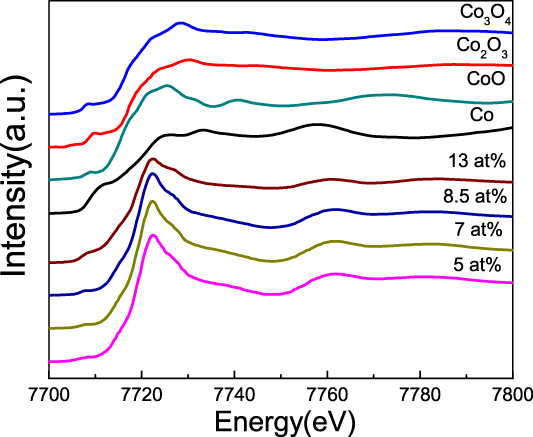
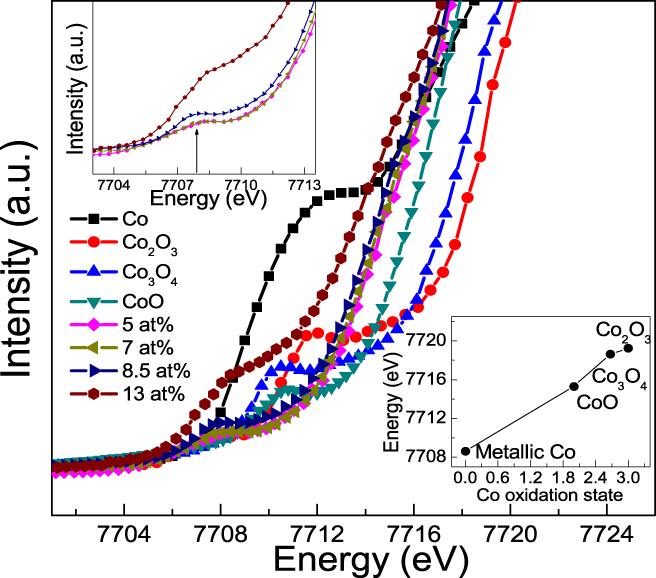
The XAS measurements including XANES and EXAFS were performed at Co K-edge, which are useful for investigating the local Co structures in the Co-doped ITO films. Figure 1 shows the Co K-edge XANES spectra for the 5, 7, 8.5, and 13 at.% Co-doped ITO films. As reference, the Co K-edge XANES spectra of standard Co metal, CoO, Co3O4, and Co2O3 are also plotted. It can be seen that the observed XANES spectral features of experimental samples are obviously different from those of reference Co metal and Co oxides, revealing that the local environments of doped Co atoms in the Co-doped ITO films are different from the Co metal and Co oxides. The enlarged view of pre-edge absorption features of XANES spectra for the 5, 7, 8.5, and 13 at.% Co-doped ITO films is shown in Fig. 2. It is well known that the energy of the edge jump can be used to quantify the oxidation state of Co for our films, which can be obtained by second derivative analysis of the XANES spectral edge. One can see that the position of the absorption edge for the Co-doped ITO films lies between that of Co and of CoO, suggesting that there exists a mixed-valent state (Co0/Co2+). With the increase of Co concentration, the absorption edge position gradually approaches that of Co metal reference, implying that more Co atoms in the films are in the 0 valence state. The bottom inset of Fig. 2 shows the threshold energy (E 0) dependence on the Co oxidation state for the reference compounds, Co, CoO, Co3O4, and Co2O3. These reference compounds show a monotonically increasing relationship between E 0 and Co oxidation states. The E 0 values corresponding to the films having 5 at.%, 7 at.%, 8.5 at.%, and 13 at.% Co doping concentrations are 7714.44 eV, 7714.15 eV, 7714.08 eV, and 7713.88 eV, respectively, again revealing that the effective oxidation state of Co atoms is between 0 and +2 in the In2O3 matrix (the E 0 values for Co and CoO are 7708.7 eV, and 7715.33 eV, respectively). Some small Co metal clusters can be responsible for this effect and should be further confirmed by the EXAFS analysis. For the 13 at.% Co-doped ITO film, the pre-edge absorption features of the XANES spectrum have a large difference from other films, revealing that the percentage of metallic Co clusters reached the maximum value. On the other hand, there exists a clear pre-edge peak about 7708 eV (marked by an arrow) for the Co-doped ITO films, as shown in the top inset of Fig. 2. The pre-edge peak originates from the Co 1s–3d transition and has a significant intensity due to 3d–2p orbital mixing that causes the dipole-allowed transition.Reference Kimura, Fukumura, Kawasaki, Inaba, Hasegawa and Koinuma16,Reference Gupta, Cao, Parekh, Rao, Raju and Waghmare17 With the increase of Co concentration, the pre-edge peak position does not almost change, but the intensity gradually increases. These strongly suggest that the number of unfilled Co 3d states gradually increases with Co doping.
Co K-edge XANES spectra of the 5, 7, 8.5, and 13 at.% Co-doped ITO films as well as Co, CoO, Co2O3, and Co3O4 foils.

Enlarged view of pre-edge features of Co K-edge XANES spectra of the 5, 7, 8.5, and 13 at.% Co-doped ITO films as well as Co, CoO, Co2O3, and Co3O4 foils. The bottom inset: the threshold energy (E 0) dependence on the Co oxidation state. The top inset: the enlarged pre-edge peak (about 7708 eV) marked by an arrow.

The XANES spectrum is also a fingerprint of the existence or absence of structural defects, such as oxygen vacancies and In interstitials (Ini) around TM dopants in ITO-based DMSs. Figure 3 shows the experimental XANES spectrum for the 5 at.% Co-doped ITO film as well as the calculated XANES spectra for seven model structures: model M1, Co substitutes for the In1 site with one Ini in the nearest coordination shell; model M2, Co substitutes for the In1 site with two VO in the nearest coordination shell; model M3, Co substitutes for the In1 site with one VO in the nearest coordination shell; model M4, Co substitutes for the In1 site; model M5, Co substitutes for the In2 site; model M6, Co substitutes for the In2 site with one VO in the nearest coordination shell; model M7, Co substitutes for the In2 site with one Ini in the nearest coordination shell. The theoretical simulations of Co K-edge XANES spectra were calculated by the real-space multiple-scattering approach using FEFF 9.0 code (Rehr Group, University of Washington, Seattle, Washington). The Hedin–Lundqvist model of the exchange correlation potential with a 0.7 eV energy shift as well as additional broadening of 0.5 eV were adopted to account for the closest match between the simulated and experimental spectra. For each model, a cluster size of 120 atoms was involved to achieve the convergence of the XANES calculations. The experimental XANES spectra for the Co-doped ITO films have similar features, therefore, only one (5 at.%) was shown. One can see that the intensity in the “valley” between the pre-edge 1s–3d feature (peak D) and the white line peak (peak A) for the experimental spectrum is obviously increased compared to those for the calculated XANES spectra with different model structures, which can be attributed to the existence of Co metal clusters in the film. It is obvious that the calculated XANES spectra of M5, M6, and M7 show quite different features (marked by A, B, and C) from the experimental spectrum. However, the calculated XANES spectra of M2, M3, and M4, namely the Co atom substituting In1 atom by the introduction of VO in the first coordination, show the similar features with the experimental one. The calculated XANES spectra of M2, M3, and M4 show a regular change. The intensity of peak A decreases and the intensity of peak B increases with introducing more VO defects. Moreover, the calculated XANES spectrum based on model M3 ( ${\rm{C}}{{\rm{o}}_{{\rm{I}}{{\rm{n}}_{\rm{1}}}}}$ + VO) can well reproduce the experimental spectral features. These results give strong evidence to the existence of the VO defect around Co dopants in the Co-doped ITO films.
Experimental XANES spectrum for the 5 at.% Co-doped ITO film and the calculated XANES spectra for different model structures:  ${\rm{C}}{{\rm{o}}_{{\rm{I}}{{\rm{n}}_{\rm{1}}}}}$ + Ini,
 ${\rm{C}}{{\rm{o}}_{{\rm{I}}{{\rm{n}}_{\rm{1}}}}}$ + 2VO,
 ${\rm{C}}{{\rm{o}}_{{\rm{I}}{{\rm{n}}_{\rm{1}}}}}$ + VO,
 ${\rm{C}}{{\rm{o}}_{{\rm{I}}{{\rm{n}}_{\rm{1}}}}}$,
 ${\rm{C}}{{\rm{o}}_{{\rm{I}}{{\rm{n}}_{\rm{2}}}}}$,
 ${\rm{C}}{{\rm{o}}_{{\rm{I}}{{\rm{n}}_{\rm{2}}}}}$ + VO,
 ${\rm{C}}{{\rm{o}}_{{\rm{I}}{{\rm{n}}_{\rm{2}}}}}$ + Ini. A–D represent some different features of the experimental and calculated XANES spectra.

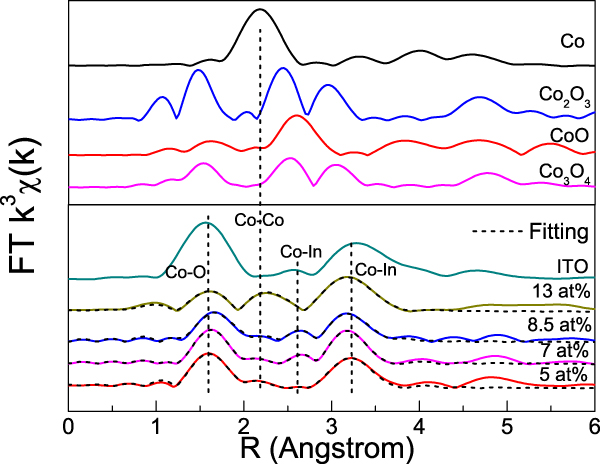
Figure 4 shows the magnitude of the Fourier-transformed EXAFS spectra for the 5, 7, 8.5, and 13 at.% Co-doped ITO films. As references, Co or In K-edge functions of standard Co, CoO, Co2O3, and Co3O4 foils as well as pure ITO film are also plotted. One can see that there exist three peaks at 1.60 Å, 2.61 Å, and 3.22 Å for the Co-doped ITO films, corresponding to the first oxygen shell (Co–O), the second and the third In shells (Co–In), respectively. These indicate that the local structure around the Co atoms is well ordered with respect to short range ordering. The three peak positions are very close to those of In atoms in pure ITO, implying that the doped Co atoms have the same local structure as that around the In atoms. However, the position of these peaks is obviously different from Co metal (2.17 Å), Co2O3 (1.47, 2.45, and 2.97 Å), Co3O4 (1.52, 2.50, and 3.04 Å), and CoO (1.61 and 2.60 Å), suggesting that the existence of Co oxides (CoO, Co2O3, and Co3O4) can be safely excluded. In addition, there exist additional peaks located at 2.15 Å, 2.16 Å, 2.19 Å, and 2.23 Å, respectively, for the 5 at.%, 7 at.%, 8.5 at.%, and 13 at.% Co-doped ITO films. The position of additional peaks is very close to the Co–Co radial distance (2.19 Å) of the standard Co metal. This phenomenon can be considered as the composition segregation of metallic Co, suggesting that not all Co atoms are incorporated into the In2O3 lattice, and a portion of them are separated to form metallic Co clusters. Also, the intensity of additional peaks gradually increases with Co doping, suggesting that more doped Co atoms form the metallic Co clusters, especially for the 13 at.% Co-doped ITO film.
Magnitude of the Fourier-transformed EXAFS spectra for the 5, 7, 8.5, and 13 at.% Co-doped ITO films. The reference Co K-edge spectra of Co, CoO, Co2O3, and Co3O4 foils as well as the In K-edge spectrum of the pure ITO film are also shown. Solid lines: experimental and dashed lines: the best fits.

In2O3 cell is composed of 80 atoms, including 8 In1 atoms and 24 In2 atoms, which correspond to trigonally distorted octahedral b sites and tetragonally distorted octahedral d sites, respectively. To obtain the quantitative structural information around the Co dopants, the EXAFS data are fitted with the cubic bixbyite structure of In2O3 using the IFEFFIT program package.Reference Ravel and Newville18 Background subtraction and data merging were carried out by the Athena and Artemis interfaces of program package. Theoretical models were constructed by the IFEFFIT codes and the crystallographic atomic positions of In2O3. The Artemis interface was used to fit the Fourier-transformed EXAFS data (R space) within the window of 0–4 Å, which includes the six first Co–O, the six second Co–In, and the six third Co–In nearest neighbor coordination shell. Comparing the EXAFS data, it is obvious that there exist two types of Co atoms, namely metallic Co (Co0) and substitutional Co (CoIn). Therefore, in the fits, the presence of metallic Co was very carefully examined. We fit the EXAFS data using the three structure models initially, namely (i) structure model for  ${\rm{C}}{{\rm{o}}_{{\rm{I}}{{\rm{n}}_{\rm{1}}}}}$; (ii) structure model for
 ${\rm{C}}{{\rm{o}}_{{\rm{I}}{{\rm{n}}_{\rm{2}}}}}$; (iii) structure model for metallic Co. It was found that the Co K-edge FT curves for all the films can be well fitted by assuming the Co atoms substitution for In1 sites of the In2O3 lattices and coexistence with metallic Co, as shown in the dashed lines of Fig. 4. Attempts to fit the FT curve using only Co substitutional model failed (not shown here). Table I lists the fitted results, which presents the average coordination number (N), bond length (R), and Debye–Waller factor (σ2) of different Co neighbor coordination shells. The R Co–O values (about 2.13–2.16 Å) in the Co-doped ITO films are a little smaller than that of In–O in In2O3 (2.19 Å). This may be caused by the slight mismatch of substitutional Co ions in the In2O3 lattice due to the fact that the radius of Co2+ ions (0.74 Å) is smaller than that of the In ion (R In3+ = 0.94 Å). With increasing Co concentration, the shortening of the Co–O bond length and the obvious increase of local static disorder σ2, especially for the first coordination cell, were observed. These effects are strong correction with the relaxation of oxygen environment of substitutional Co2+ ions.Reference Parent, Dexpert, Tourillon and Grimal19 On the other hand, metallic Co clusters significantly contribute to the FT curve in the 13 at.% high Co-doped film. It can observe a large structural disorder and low (≤3) effective coordination number.
Structural parameters around Co dopants for the 5 at.%, 7 at.%, 8.5 at.%, and 13 at.% Co-doped ITO films. N, R, and σ2 are the coordination number, bond length, and DW factor, respectively.

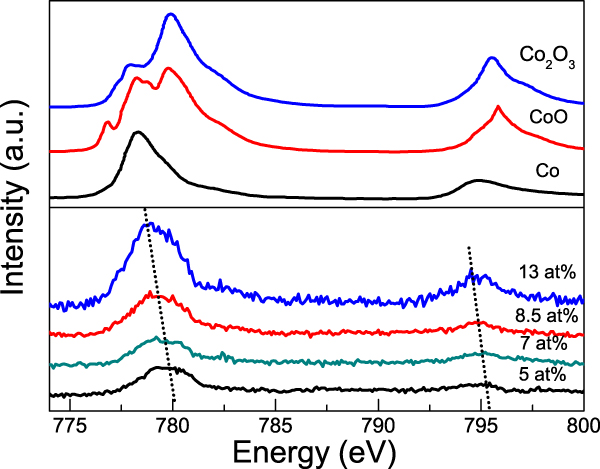
The XAS measurements at the Co L-edge can help to further study the valence state and local structures around Co dopants in the Co-doped ITO films. Figure 5 shows the Co L2,3-edge XANES spectra of the 5, 7, 8.5, and 13 at.% Co-doped ITO films. As reference samples, the spectra of standard Co, CoO, and Co2O3 foils are also shown. The peak position and the line shape of Co L2,3-edge XAS spectra strongly correlate with the local atomic and electronic structures of Co atoms, which can be used to investigate the valence state and electronic configuration. One can see that there exist two characteristic peaks at about 779 and 795 eV in the XAS spectra of Co-doped ITO films, which are corresponding to transitions from the Co 2p 3/2 (L3 edge) and Co 2p 1/2 (L2 edge) states to the continuum of empty 3d states (strictly speaking, transition to a hybridized state of Co 3d and O 2p).Reference Magnuson, Butorin, Guo and Mordgren20 The peak position of Co L-edge XAS spectra is sensitive to the valence state of Co atoms. Clearly, both the L3-edge and L2-edge peaks gradually move to lower energy with the increase of Co concentration, suggesting a decreasing valence state of Co atoms. These further confirm that there exist more Co metal clusters in the Co-doped ITO films with high Co concentration.
Co L2,3-edge XANES spectra of the 5, 7, 8.5, and 13 at.% Co-doped ITO films as well as CoO, Co2O3, and Co foils.

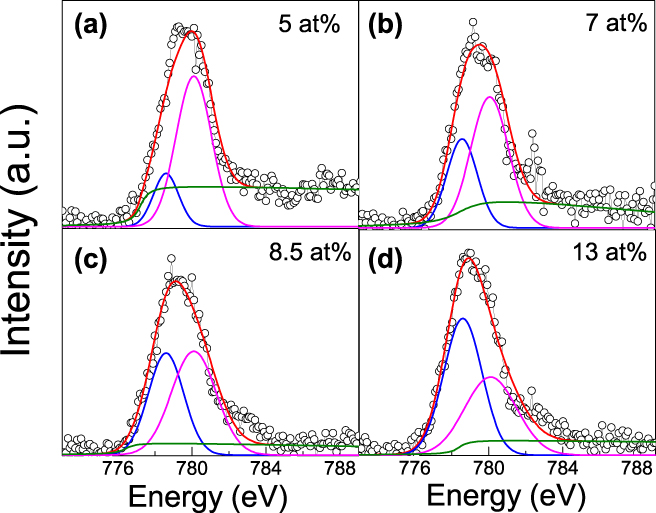
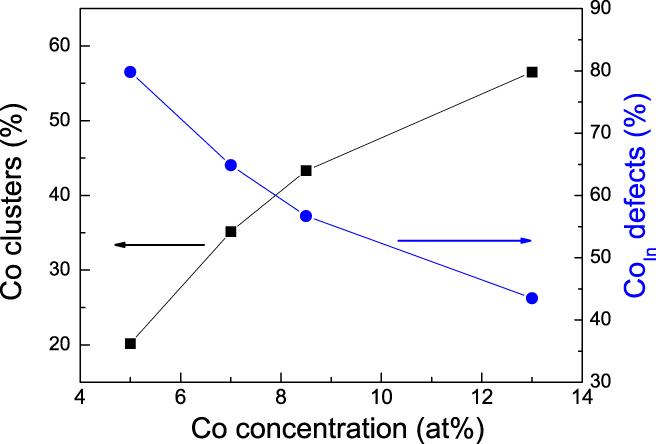
Figures 6(a)–6(d) show the Co L3-edge XAS spectra and the corresponding fitted spectra for the 5 at.%, 7 at.%, 8.5 at.%, and 13 at.% Co-doped ITO films. One can see that the Co L3-edge XAS spectra of the films show a broad absorption feature. Generally, the significant broadening in XAS spectra can be caused by the mixed valence state of TM ions, such as the L-edge broadening of (La,Ca)MnO3, is ascribed to the coexistence of Mn3+ and Mn4+ states.Reference Valencia, Gaupp, Gudat, Abad, Balcells, Cavallaro, Martínez and Palomares21 It is obvious that the L3-edge XAS spectra for all the films can be fitted with two Gaussian components located at 778.62 and 780.10 eV. The two peaks at lower energy (778.62 eV) and higher energy (780.1 eV) can be attributed to the Co reference, namely the metallic Co clusters and the substitutional Co (CoIn), respectively. The relative areas under the respective fitted peaks give an estimate of the relative concentration of the metallic Co clusters and substitutional Co. Figure 7 shows the percentage of metallic Co clusters and substitutional Co for the 5, 7, 8.5, and 13 at.% Co-doped ITO films. Clearly, the percentage of metallic Co clusters gradually increases but that of substitutional Co monotonously decreases with the increase of Co concentration. For the 5, 7, and 8.5 at.% Co-doped ITO films, the doped Co atoms mainly occupy the substitutional sites of In2O3 lattices with the metallic Co clusters being about 20–43 at.%. However, as the Co concentration increased to 13 at.%, the doped Co atoms mainly form the metallic Co clusters being about 57 at.% in the doped ITO films.
Co L3-edge XAS spectra and the corresponding fitted spectra for the (a) 5 at.%, (b) 7 at.%, (c) 8.5 at.%, and (d) 13 at.% Co-doped ITO films.

Percentage of metallic Co clusters and substitutional Co for the 5, 7, 8.5, and 13 at.% Co-doped ITO films.

IV. CONCLUSIONS
In summary, the 5, 7, 8.5, and 13 at.% Co-doped ITO films were deposited on Si(100) substrates by the RF magnetron sputtering technique. The influences of Co doping on the local structure of the Co-doped ITO films were investigated in detail by the combination of XAS at Co K-edge and L-edge. The detailed analysis of the structural properties indicates that for the Co-doped ITO films with low Co concentration (≤8.5 at.%), most Co atoms are substitutionally incorporated into the In3+ sites of the In2O3 matrix and form  ${\rm{C}}{{\rm{o}}_{{\rm{I}}{{\rm{n}}_{\rm{1}}}}}$ + VO complex with one VO around Co dopants, while a part of Co atoms forms the precipitate of Co metal clusters being about 20–43 at.%. The Co–O bond length is shortened and the corresponding DW factor (σ2) increases with Co doping, indicating the relaxation of oxygen environment of Co ions upon substitution. With further increasing Co concentration to 13 at.%, the larger structural disorder and shorter Co–O bond length are observed, approximately 57% of Co precipitates into metallic aggregates in the Co-doped ITO films. These results provide new experimental guidance in the preparation of the Co-doped ITO-based DMSs.
ACKNOWLEDGMENTS
This work was supported by Tianjin Natural Science Foundation of china (Grant No. 17JCYBJC17300) and Tianjin Undergraduate Training Program for Innovation and Entrepreneurship (Grant No. 201610060061) and by the Beijing Synchrotron Radiation Laboratory.