INTRODUCTION
Angkor was the capital district of the medieval Khmer kingdom in Southeast (SE) Asia, flourishing from approximately the 9th to the 15th centuries AD. The emergence, expansion, and demise of Angkor have been studied intensively for many decades. While the probable significance of climate variability in ancient Cambodian society is understood, the lack of high-resolution paleoclimate data from Cambodia has meant that a rigorous analysis of what role climate played in the fluorescence and demise of the Khmer kingdom has not been possible (Buckley et al. Reference Buckley, Anchukaitis, Penny, Fletcher, Cook, Sano, Le, Wichienkeeo, Ton That and Truong2010). The Indochina Peninsula, unlike the better-known South and East Asian regions (Penny Reference Penny2012), provides very few paleoclimate data sets capable of testing hypothesized links between historic societal change and climate variability. Archaeologists and historians (e.g., Lieberman Reference Lieberman2009) have instead relied on paleoclimate data from as far away as India and China to understand late Holocene climate in mainland SE Asia, despite the well-known complexity in the expression of the monsoon in these regions (e.g., Sinha et al. Reference Sinha, Stott, Berkelhammer, Cheng, Edwards, Buckley, Aldenderfer and Mudelsee2011). Recently, an annually resolved record of tree rings from a mountainous region of southern Vietnam has provided detailed climatic information back to the mid-13th century AD, revealing periods of weaker summer monsoon rainfall coincident with the demise of the massive agrarian Khmer kingdom and its capital during the 15th century AD (Buckley et al. Reference Buckley, Anchukaitis, Penny, Fletcher, Cook, Sano, Le, Wichienkeeo, Ton That and Truong2010). Gridded models based on these data and a network of other tree-ring records from the region (Cook et al. Reference Cook, Anchukaitis, Buckley, D’Arrigo, Jacoby and Wright2010) have been used to project the timing, extent and amplitude of drought over central Indochina. There remains, however, no comparable high-resolution data from the lowlands of Cambodia itself with which to validate these projections.
We have studied a speleothem, PC1, from southern Cambodia with the aim of reconstructing a continuous high-resolution climate record based on stable isotopic composition of stalagmite calcite, covering the entire Angkor period (circa 9th–15th centuries AD). The U-Th dating method is usually employed to build precise and reliable chronologies for speleothems (Hellstrom Reference Hellstrom2003; Cheng et al. Reference Cheng, Edwards, Shen, Woodhead, Hellstrom, Wang, Kong and Wang2008). However, a pilot study that attempted to date PC1 by the standard U-Th method was unsuccessful, resulting in age reversals due to suspected multiple sources of non-authigenic 230Th. This problem is commonly encountered when dating tropical speleothems (Beck et al. Reference Beck, Richards, Edwards, Silverman, Smart, Donahue, Hererra-Osterheld, Burr, Calsoyas, Jull and Biddulph2001; Partin et al. Reference Partin, Cobb, Adkins, Clark and Fernandez2007; Hua et al. Reference Hua, McDonald, Redwood, Drysdale, Lee, Fallon and Hellstrom2012a). Radiocarbon (14C) can be used as an alternative method for dating of speleothems. This dating method requires knowledge of the dead carbon fraction (DCF), a 14C reservoir effect for speleothems resulting from the contribution of “dead” carbon free of 14C from bedrock and aged soil organic matter (SOM) above the cave system. Temporal variations in DCF have been reported by several researchers (e.g., Genty et al. Reference Genty, Baker, Massault, Proctor, Gilmour, Pons-Branchu and Hamelin2001; Griffiths et al. Reference Griffiths, Fohlmeister, Drysdale, Hua, Johnson, Hellstrom, Gagan and Zhao2012; Noronha et al. Reference Noronha, Johnson, Hu, Ruan, Southon and Ferguson2014), but if DCF variability in a speleothem is properly constrained, a reliable 14C-based chronology is achievable (Genty et al. Reference Genty, Massault, Gilmour, Baker, Verheyden and Kepens1999; Hua Reference Hua2009; Hua et al. Reference Hua, McDonald, Redwood, Drysdale, Lee, Fallon and Hellstrom2012a). In an alternative approach, age-depth modeling with 14C-dated stalagmites is possible without prior knowledge of DCF, but requires the assumption of a quasi-constant growth rate (Lechleitner et al. Reference Lechleitner, Fohlmeister, McIntyre, Baldini, Jamieson, Hercman, Gasiorowski, Pawlak, Stefaniak, Socha, Eglinton and Baldini2016a). In this paper, we use 14C to generate a chronology for the top 51 mm of PC1.
MATERIAL AND METHODS
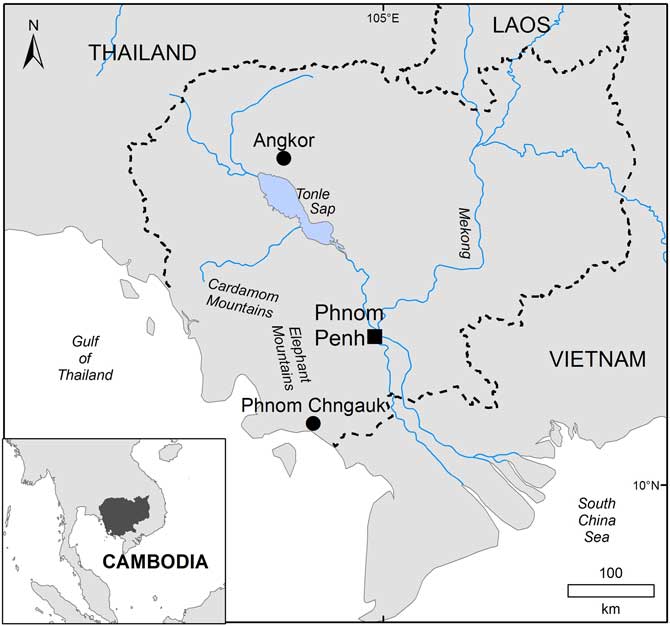
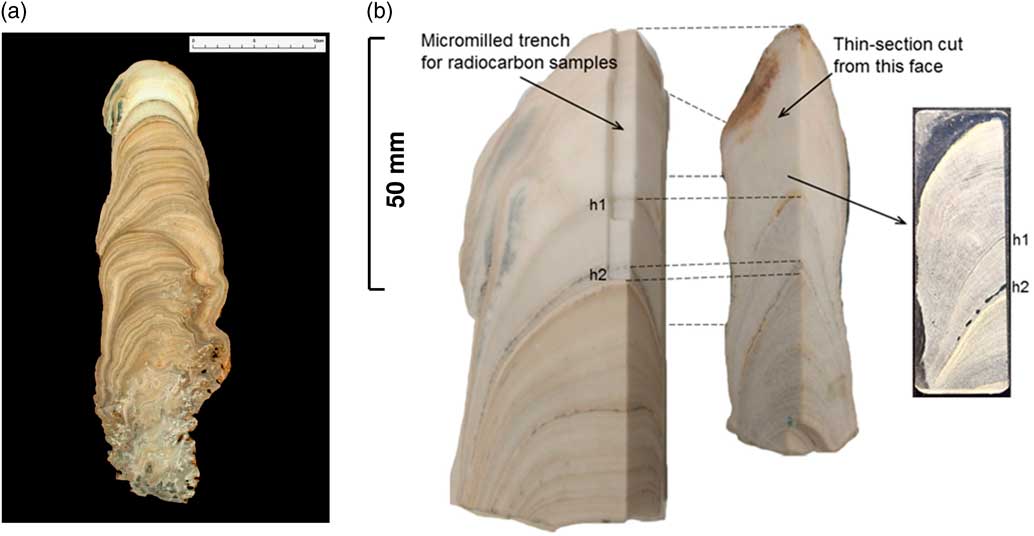
PC1 was collected in January 2007 in growth position ~280 m from the entrance of an unnamed cave on the northwest slopes of Phnom Chngauk, a limestone hill that rises 130 m above the alluvial plains northeast of Kampot in southern Cambodia (10º38′40′′N, 104º16′20′′E; see Figure 1). Thin, well-drained calcareous lithosols are found on the slopes above the cave, while the steeper slopes and ridge crests of the hill are largely exposed limestone characterized by a variety of subaerially formed rock-solution sculpture (karren). The Kampot region is in the coastal hinterland landward of the Gulf of Thailand and is characterized by a tropical monsoon climate with an average annual rainfall of ~1998 mm. The wet season from mid-May to October is driven by the southwest monsoon delivering moisture to the region from the Gulf of Thailand, and the dry season is from November to April, with drier and cooler air flowing over the region from the northeast monsoon. April is on average the warmest month with an average air temperature of 33ºC while the coolest temperatures are typically recorded in December and January with an average temperature of 23ºC. PC1 is a stalagmite (~490 mm in length, 5.4 kg by weight) composed of porous, white/brown calcite (Figure 2a). Although cave drip precipitation onto the speleothem and adjacent cave floor appeared recent with precipitates being shiny and translucent, the timing of the collection of PC1 in the middle of the dry season (January) might mean that the hydrological network was inactive and no active drips were observed within the cave.
Map of Cambodia in SE Asia showing the locations of our study site in Phnom Chngauk and Angkor.

Photos of PC1 stalagmite (a), and its top portion (b) showing micromilled trench for radiocarbon samples and thin section used for SEM examination. h1 and h2 represent section 1 and 2 discussed in the text, respectively.

In this paper we focus on the top 51 mm of PC1. In this part of the stalagmite, two small sections at depths (distance from tip) 34.4–35.2 mm (section 1) and 47.2–49.4 mm (section 2) are observably more powdery and less dense than the surrounding calcite matrix. These sections, both with clear upper and lower boundaries, might represent distinct periods of slow growth or growth hiatuses. To better understand the growth patterns of the stalagmite through these two sections, a 40-μm-thick plate of the top ~65 mm of PC1 (Figure 2b) was prepared for thin-section and scanning electron microscope (SEM) examination. We used standard SEM imaging on a JEOL JSM-6490LV variable pressure SEM with a 15 kV conventional tungsten filament thermionic source. This analysis was completed through the AZtecSynergy and AZtecEnergy software suites at the Electron Microscopy Centre (EMC) at the University of Wollongong. We used an Oxford Instruments 80 mm2 X-MaxN SDD EDS to complete semi-quantitative elemental analysis of spots and compositional mapping, enabling us to identify the major element concentrations of growth bands through these two sections.
The uppermost layer of ~0.2 mm thick at the tip of PC1 was degraded and peeled off from the stalagmite. A Micromill 2000 LE-ER system with a 0.5-mm tungsten carbide milling bit was used to collect carbonate powders along the growth axis of PC1 for accelerator mass spectrometry (AMS) 14C analysis. PC1 was milled at 200-μm intervals from 0.2 mm to 51.2 mm depth (see Figure 2b). In the top 39.8 mm, 3–4 mg of carbonate powder for each sample was collected. However, only ~0.5–2 mg of carbonate powder per sample was obtained for the depths of 39.8–51.2 mm due to changes in the direction of growth layers below the surface of the sampling track. A total of 50 carbonate samples were reacted with 85% H3PO4 on a hot block at 90ºC for 1 hr and the evolved CO2 was then converted to graphite using the Fe/H2 method (Hua et al. Reference Hua, Jacobsen, Zoppi, Lawson, Williams, Smith and McGann2001). AMS 14C measurement was carried out using the STAR Facility at ANSTO (Fink et al. Reference Fink, Hotchkis, Hua, Jacobsen, Smith, Zoppi, Child, Mifsud, van der Gaast, Williams and Williams2004) with a typical analytical precision of better than 0.4% (1σ). 14C content of the stalagmite samples, after correction for machine background, procedural blank and isotopic fractionation using measured δ13C, is reported as percent modern carbon (pMC; Stuiver and Polach Reference Stuiver and Polach1977).
The chronological reconstruction for PC1was performed using two different approaches. The first approach, described by Hua et al. (Reference Hua, McDonald, Redwood, Drysdale, Lee, Fallon and Hellstrom2012a), estimated a “maximum” range of pre-bomb DCF. To cover possible changes in DCF over a short period of time (e.g., the last ~1–2 ka), a constant DCF value with variation at double the estimated pre-bomb DCF range was used to correct the speleothem 14C reservoir effect. A chronology of PC1 was built based on a series of DCF-corrected ages using the Bayesian OxCal P_sequence deposition model (Bronk Ramsey Reference Bronk Ramsey2008). The second approach (Lechleitner et al. Reference Lechleitner, Fohlmeister, McIntyre, Baldini, Jamieson, Hercman, Gasiorowski, Pawlak, Stefaniak, Socha, Eglinton and Baldini2016a) reconstructed the chronology by calculating the best-fit growth rate between a sequence of PC1 14C data and a terrestrial 14C calibration curve, and anchoring the estimated growth rate to a point of known age. This method does not depend on any prior knowledge or estimate of the DCF. However, it requires that speleothem DCF is stationary but not necessarily constant and stalagmite growth can be well approximated with a constant rate.
RESULTS
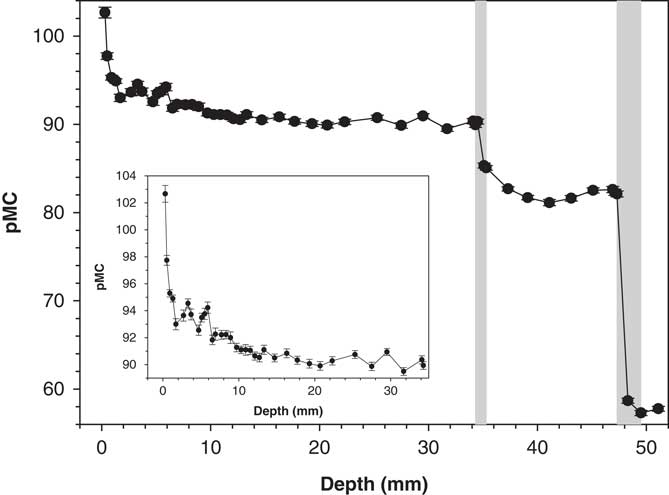
The AMS 14C results are reported in Table 1 and illustrated in Figure 3. The 14C content is ~58 pMC at depth ~48-51 mm then abruptly increases to ~82 pMC at depth ~47 mm. The value varies around 82 pMC between ~47 and ~37 mm in depth, then slightly increases to 85 pMC at depth 35.3 mm and to ~90 pMC at depth 34.5 mm. The 14C content then fluctuates around 90–91 pMC between 34.5 and 9.7 mm in depth before rising again and finally reaching a maximum value of ~103 pMC at 0.3 mm depth. In general, the 14C content increases upwards in the stalagmite as expected.
pMC values of samples taken from PC1. The inset diagram depicts 14C content for the top ~34 mm of PC1 showing the invasion of bomb radiocarbon in the top portion of the stalagmite. The gray shadings represent the speleothem sections of growth hiatus: 34.4–35.2 mm (section 1) and 47.2–49.4 mm (section 2).

Radiocarbon results.

* Samples were taken inside the two speleothem sections of growth hiatus.
Large changes in the 14C content over sections 1 and 2 are observed (Figure 3 and Table 1). For section 1 (34.4–35.2 mm depth), the values of the two samples across the upper boundary (OZT930 outside section 1 of 89.94±0.28 pMC and OZU220 inside section 1 of 90.32±0.29 pMC) agree well with each other within 1σ uncertainties. Similarly, there is good agreement within 1σ uncertainties for the two samples across the lower boundary (OZU221 inside section 1 of 85.33±0.28 pMC and OZT931 outside section 1 of 85.07±0.26 pMC). For section 2 (47.2–49.4 mm depth), good concordance within 1σ uncertainties is observed for the two samples across the upper boundary (OZT937 outside section 2 of 82.30±0.35 pMC and OZU222 inside section 2 of 82.12±0.33 pMC). In addition, the 14C content of sample OZU223, collected at depth 48.3 mm in the middle of section 2, of 58.68±0.29 pMC is slightly higher than that of sample OZT943 at depth 49.5 mm just outside section 2 of 57.29±0.29 pMC as the two values do not overlap within 2σ uncertainties. These 14C data might indicate that there are continuous growths across the boundaries of the two sections.
However, thin-section and SEM examination (Figure 4) reveals that these sections are not periods of continuous growth and are actually growth hiatuses. Figures 4a–b show a dark-colored band of section 1 (marked as h1 in the figures), composed of organic-rich, lower density deposition that must have accumulated during years of little or no drip water and calcite deposition. SEM examination of the upper boundary of section 1 confirms the dominance of dark-colored carbon-rich material inside the section (spectrum 4) close to the end of the growth hiatus (Figures 4c–d). In contrast, denser, light-colored carbonate material deposited above h1 (spectrum 1) marks the cessation of the growth hiatus and most likely records a return to more humid conditions and (more) continuous drip water flow (Figures 4c,e). Thin-section and SEM examination of section 2 showed similar findings (data are not shown). These results do not conflict the 14C data, which show good agreement across the boundaries of the two hiatus sections as discussed above, because although less abundant carbonate still occurs within these sections (see Figures 4c–d). This implies that reliable information on speleothem growth patterns and hiatuses can only be achieved by the combination of thin-section and SEM examination and dating (e.g., 14C data).
Thin-section and SEM examination of the top portion of PC1. (a) Thin section of the top ~65 mm of PC1 with h1 and h2 representing sections 1 and 2, respectively. Three bright, white regions, located below the h2 hiatus surface, are holes in the specimen from previous sample drilling, which are seen black in Figure 2b. (b) A close-up image of section 1. (c) SEM image of the upper boundary of section 1. (d) and (e) Results of SEM semi-quantitative elemental analysis of spots inside (spectrum 4) and outside (spectrum 1) section 1, respectively.

The observed pMC increases in the top 8.9 mm of PC1 (from 92 to ~103 pMC) might indicate an invasion of bomb 14C (Figure 3), which is due to atmospheric nuclear testing mostly in the late 1950s and early 1960s (Levin and Hesshaimer Reference Levin and Hesshaimer2000; Hua and Barbetti Reference Hua and Barbetti2004). The shape of the bomb curve in PC1, with two small peaks at 5.9 and 3.3 mm depth superimposed on a long-term increase in the 14C content, is not commonly observed in previous work (Hodge et al. Reference Hodge, McDonald, Fischer, Redwood, Hua, Levchenko, Waring, Drysdale and Fink2011; Hua et al. Reference Hua, McDonald, Redwood, Drysdale, Lee, Fallon and Hellstrom2012a; Noronha et al. Reference Noronha, Johnson, Southon, Hu, Ruan and McCabe-Glynn2015 and references therein). There are 3 depths, which are possible to represent the onset of bomb 14C in PC1: 1.3, 5.9, and 8.9 mm.
The first possibility means that the bomb 14C is recorded only in top 1.3 mm of PC1 because of a fast 14C increase from 93 to ~103 pMC. If this option were the case, the two pre-bomb short-term 14C variations peaked at 5.9 and 3.3 mm depth (likely spanning the period ~1940–1955) would be due to DCF changes related to changes in hydrology (Fohlmeister et al. Reference Fohlmeister, Schröder-Ritzrau, Spötl, Frisia, Miorandi, Kromer and Mangini2010; Griffiths et al. Reference Griffiths, Fohlmeister, Drysdale, Hua, Johnson, Hellstrom, Gagan and Zhao2012; Noronha et al. Reference Noronha, Johnson, Hu, Ruan, Southon and Ferguson2014; Lechleitner et al. Reference Lechleitner, Baldini, Breitenbach, Fohlmeister, McIntyre, Goswami, Jamieson, van der Voort, Prufer, Marwan, Culleton, Kennett, Asmerom, Polyak and Eglinton2016b). One would therefore expect large decreases in rainfall at the study site during ~1940–1955 (relative to the previous time interval) in order to generate DCF decreases and consequently speleothem 14C increases from ~92 pMC at depth 6.5–8.9 mm to ~93–94.5 pMC at depth 1.7–5.9 mm. However, rainfall data from CambodiaFootnote 1 indicate the period of ~1940–1955 is ~2–16% higher than the 1900–2012 annual average value. This together with the likely short soil/karst residence time of cave drip water from the literature, which is less than 1 yr (Johnson et al. Reference Johnson, Hu, Belshaw and Henderson2006; Noronha et al. Reference Noronha, Johnson, Southon, Hu, Ruan and McCabe-Glynn2015) to no more than 3–4 yr at maximum (e.g., Kluge et al. Reference Kluge, Riechelmann, Wieser, Spötl, Sültenfuß, Schröder-Ritzrau, Niggemann and Aeschbach-Hertig2010), suggests that 14C increases at 1.7–9.7 mm depth are not related to DCF changes. In addition, the onset of bomb 14C at 1.3 mm depth requires a large reduction in the growth rate for the top 1.3 mm of PC1 (1.3 mm/50 yr=0.026 mm/yr) compared to that for the previous section of 1.3–34.4 mm depth of 0.049–0.068 mm/yr derived from the two dating approaches (Hua et al. Reference Hua, McDonald, Redwood, Drysdale, Lee, Fallon and Hellstrom2012a; Lechleitner et al. Reference Lechleitner, Fohlmeister, McIntyre, Baldini, Jamieson, Hercman, Gasiorowski, Pawlak, Stefaniak, Socha, Eglinton and Baldini2016a) mentioned above. This substantial growth rate change is unlikely because there are no obvious changes in the texture of PC1 in the top 34.4 mm. Such evidence suggests that the placement of the onset of bomb 14C at 1.3 mm depth is very unlikely.
The other 2 options with the onset of bomb 14C at 5.9 and 8.9 mm depth indicate that the bomb curves in PC1 are very similar to the recently published bomb curve in an U-Th dated stalagmite (CRC-3) from southern California (McCabe-Glynn et al. Reference McCabe-Glynn, Johnson, Strong, Berkelhammer, Sinha, Cheng and Edwards2013), which shows a small and gradual 14C increase between 1955 and 1960 followed by a large and sharp rise in 14C around 1990. McCabe-Glynn et al. (Reference McCabe-Glynn, Johnson, Strong, Berkelhammer, Sinha, Cheng and Edwards2013) mentioned that contribution from a large proportion of SOM with slow turnover time led to their speleothem 14C record that was damped and lagged relative to the atmosphere. We ran a simple carbon cycle mixing model described in Fohlmeister et al. (Reference Fohlmeister, Kromer and Mangini2011) and Griffiths et al. (Reference Griffiths, Fohlmeister, Drysdale, Hua, Johnson, Hellstrom, Gagan and Zhao2012) to see whether the model can reproduce the PC1 bomb data. The modeled 14C data fit our measured 14C values for PC1 well (see Appendix and Figure A1), indicating that the onset of bomb 14C at 5.9 and 8.9 mm depth are both possible. In both options, the contribution of slow SOM reservoirs to PC1 is dominant (94% of 130-yr-old SOM reservoir for the 5.9-mm option and 86% of 80-yr-old SOM reservoir for the 8.9-mm option). This result is similar to the finding of McCabe-Glynn et al. (Reference McCabe-Glynn, Johnson, Strong, Berkelhammer, Sinha, Cheng and Edwards2013) for stalagmite CRC-3 mentioned above.
For the 2nd option with bomb 14C onset at 5.9 mm depth, the speleothem growth rate for the post-bomb is 0.118 mm/yr (5.9 mm/50 yr), which is similar to that for the previous section of PC1 (5.9–34.4 mm depth) of 0.087–0.102 mm/yr based on the two dating methods (Hua et al. Reference Hua, McDonald, Redwood, Drysdale, Lee, Fallon and Hellstrom2012a; Lechleitner et al. Reference Lechleitner, Fohlmeister, McIntyre, Baldini, Jamieson, Hercman, Gasiorowski, Pawlak, Stefaniak, Socha, Eglinton and Baldini2016a; see discussion later). While the growth rate for the 3rd option with bomb 14C onset at 8.9 mm depth is 0.178 mm/yr (8.9 mm/50 yr) for the post-bomb, which is much higher than that for the previous section of PC1 (8.9–34.4 mm depth) of 0.092–0.127 mm/yr derived from the two dating methods (data are not shown). These estimated growth rates for the top 34.4 mm, which shows no obvious changes in the calcite texture of PC1, suggest that the onset of bomb 14C at 5.9 mm depth is more likely. This, however, cannot completely rule out the 3rd option with the onset of bomb 14C at 8.9 mm depth.
The 14C results indicate the following patterns of growth in the top 51 mm of PC1 (Figure 3):
-
∙ A period of growth hiatus within section 2 (47.2–49.4 mm depth),
-
∙ A period of almost constant growth rate between 47.2 and 35.2 mm depth,
-
∙ Another short period of growth hiatus within section 1 (34.4–35.2 mm depth), and
-
∙ A period of growth in the top 34.4 mm with an almost constant rate.
CHRONOLOGIES FOR PC1
Dated speleothems based on laminae counting (compared to U-Th dated speleothems) are more appropriate for the precise determination of the timing of the onset of bomb 14C in speleothems due to small uncertainties associated with the counting. We revisited five relevant dated stalagmites from the Northern Hemisphere based on laminae counting that their bomb 14C data were published, including two (Han-stm5b and Fau-stm14) from Genty et al. (Reference Genty, Vokal, Obelic and Massault1998) and Genty and Massault (Reference Genty and Massault1999), one (Gib04a) from Mattey et al. (Reference Mattey, Lowry, Duffet, Fisher, Hodge and Frisia2008), one (Obi84) from Smith et al. (Reference Smith, Fairchild, Spötl, Frisia, Borsato, Moreton and Wynn2009), and one (HS4) from Noronha et al. (Reference Noronha, Johnson, Southon, Hu, Ruan and McCabe-Glynn2015). The timing of the onset of bomb 14C in these speleothems is in the range of 1955–1959 or 1957±2, indicating a negligible time lag between the onset of bomb 14C in speleothems and that in the atmosphere, which occurs in 1955 for the Northern Hemisphere (Hua and Barbetti Reference Hua and Barbetti2004; Hua et al. Reference Hua, Barbetti and Rakowski2013). This is because there is a fast component (e.g., root respiration and fast SOM decomposition) in the soil-to-speleothem carbon transfer system (Genty and Massault Reference Genty and Massault1999), which quickly transfers contemporary 14C into speleothems.
The likely onset of bomb 14C in PC1 is at 5.9 mm in depth (sample OZR170; see Figure 3 and Table 1) and its timing is 1957±2 AD. This timing is necessary for both chronological modeling approaches because it indicates the depth of pre-bomb samples for the estimation of pre-bomb DCF in the first approach and serves as an anchor point in the second approach.
Atmospheric 14C over tropical regions in SE Asia is a result of Northern and Southern Hemisphere air-masses mixing via the monsoon systems (Hua et al. Reference Hua, Barbetti and Zoppi2004a, Reference Hua, Barbetti, Zoppi, Fink, Watanasak and Jacobsen2004b, Reference Hua, Barbetti, Levchenko, D’Arrigo, Buckley and Smith2012b; Hua and Barbetti Reference Hua and Barbetti2007). In particular, atmospheric 14C for Thailand in the Northern Hemisphere is strongly influenced by the entrainment of Southern Hemisphere air parcels during the southwest Asian monsoon, when the Inter-Tropical Convergence Zone moves northwards. Such atmospheric transport and mixing result in a regional 14C offset for Thailand (with Thailand being younger than the Southern Hemisphere of 21±6 yr on average for the period AD 1620–1780; Hua et al. Reference Hua, Barbetti, Zoppi, Fink, Watanasak and Jacobsen2004b), which neighbors our study site in southern Cambodia. We therefore used the SHCal13 calibration data (Hogg et al. Reference Hogg, Hua, Blackwell, Niu, Buck, Guilderson, Heaton, Palmer, Reimer, Reimer, Turney and Zimmerman2013) with this small offset of –21±6 yr for the chronological development of PC1, consistent with recent work on 14C chronologies for Cambodia (Beavan et al. Reference Beavan, Halcrow, McFadgen, Hamilton, Buckley, Sokha, Shewan, Sokha, Fallon, Miksic, Armstrong, O’Reilly, Domett and Chhem2012; Hendrickson et al. Reference Hendrickson, Hua and Pryce2013, Reference Hendrickson, Leroy, Hua, Kaseka and Vuthy2017; Pryce et al. Reference Pryce, Hendrickson, Phon, Chan, Charlton, Leroy, Dillmann and Hua2014; Leroy et al. Reference Leroy, Hendrickson, Delque-Kolic, Vega and Dillmann2015; Hall et al. Reference Hall, Penny, Hendrickson, Cooke and Hua2016).
First Approach—Hua et al. (Reference Hua, McDonald, Redwood, Drysdale, Lee, Fallon and Hellstrom2012a)’s Method
Genty et al. (Reference Genty, Massault, Gilmour, Baker, Verheyden and Kepens1999) reported paired U-Th and 14C analyses for two Holocene stalagmites from Europe and first discussed the potential use of 14C with average DCF over time, derived from the paired U-Th and 14C samples, for dating speleothems. Hua et al. (Reference Hua, McDonald, Redwood, Drysdale, Lee, Fallon and Hellstrom2012a) went further to develop a method of reliable dating of young speleothems of ~1–2 ka old using 14C. This method employs a constant pre-bomb DCF similar to that used by Genty et al. (Reference Genty, Massault, Gilmour, Baker, Verheyden and Kepens1999). However, in Hua et al.’s method uncertainty associated with constant DCF value is enlarged and the relative variation in the DCF is considered large enough (see discussion later in this section) to cover possible temporal variability in DCF for a short period of time. In addition, Hua et al. (Reference Hua, McDonald, Redwood, Drysdale, Lee, Fallon and Hellstrom2012a) uses a dense sequence of 14C samples and Bayesian statistical models (e.g., OxCal and/or Bacon; Bronk Ramsey Reference Bronk Ramsey2008; Blaauw and Christen Reference Blaauw and Christen2011) to build reliable 14C chronologies for young speleothems.
DCF of a speleothem sample was calculated using the following equations:
 $${\rm DCF}\,{\equals}\,\left( {1{\minus}{{{\rm A}_{{{\rm spel}.\,{\rm initial}}} } \over {{\rm A}_{{{\rm atm}.\,{\rm initial}}} }}} \right){\times}100\,\%\,$$
where respective initial 14C contents of the speleothem and the atmosphere are given by
 $${\rm A}_{{{\rm spel}.\,{\rm initial}}} \,{\equals}\,{\rm A}_{{{\rm spel}}} /{\rm e}^{{{\minus}{\!}{\rm \lambda t}}} $$
 $${\rm A}_{{{\rm atm}.\,{\rm initial}}} \,{\equals}\,{\rm A}_{{{\rm atm}}} /{\rm e}^{{{\minus}{\!}{\rm \lambda t}}} $$
where λ=1/8267 yr−1 is the decay constant of 14C
From (1), (2), and (3)
 $${\rm DCF}\,{\equals}\,\left( {1{\minus}{{{\rm A}_{{{\rm spel}}} } \over {{\rm A}_{{{\rm atm }}} }}} \right){\times}100\,\%\,$$
where Aspel is measured pMC value of a speleothem sample at a given time t and Aatm is its associated atmospheric pMC value.
The average pre-bomb DCF value for the top portion of PC1 was determined using Equation (4) with Aspel being the weighted mean value of the 14C content of 13 samples from 6.5 to 14.7 mm depth (see Table 1) and Aatm representing the weighted mean value of contemporaneous atmospheric 14C. The top 5.9 mm of PC1, where the bomb 14C signal is observed, covers a period of 50 yr from 1957 to 2007. If there are similar growth rates for the top 14.7 mm of PC1, the timing of sample OZT195 at 14.7 mm is ~1880 AD. We, however, calculated Aatm for a much longer time period spanning between 1800 and 1950 AD (instead of 1880–1950 AD based on similar growth rates) in order to obtain a larger spread for Aatm and consequently a “maximum” range of estimated pre-bomb DCF for PC1. The pre-bomb DCF value was in the range of 6.6–8.0% (1σ) or 7.3±0.7% (1σ) calculated from Aspel of 91.28±0.65 pMC and Aatm of 98.46±0.20 pMC. This estimated DCF range was very similar if different Aatm values spanning between 20 yr (1930–1950 AD) and 200 yr (1750–1950 AD) before 1950 AD were used, confirming the robustness in our approach in estimating the “maximum” pre-bomb DCF range for PC1.
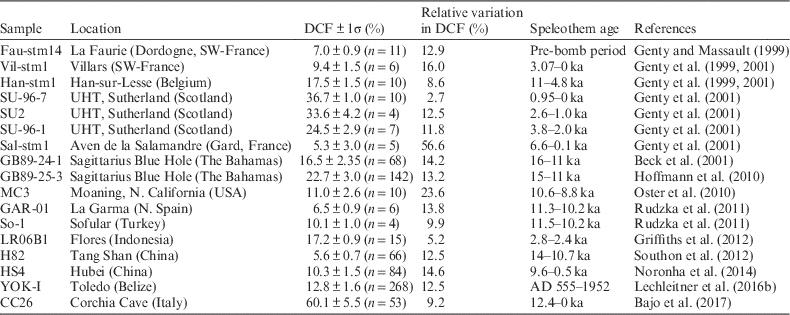
A constant pre-bomb DCF for PC1 7.3±1.4% (1σ), with double the variation (i.e., twice the calculated uncertainty of 0.7%), was used for speleothem 14C age correction. This approach aims to cover possible temporal DCF variability for PC1 for a short period of time (e.g., ~1000 yr in this study) in order to obtain an age-depth model for PC1 agreeing with its true ages within modeled age uncertainties. In addition, the pre-bomb DCF value for PC1 of 7.3±1.4%, indicating a relative variation in this DCF of (1.4/7.3) ×100%=19.2%. In most cases (15 out of 17), this relative DCF variation is higher than those of previously published speleothem DCF over different (and mostly longer) time periods (see Table 2). This comparison indicates that variability of the pre-bomb DCF value for PC1 is large enough to cover possible temporal changes in DCF for short period of time of ~1000 yr, implying reliable 14C dating of PC1 based on this method.
Previously published speleothem DCF values and their temporal variations

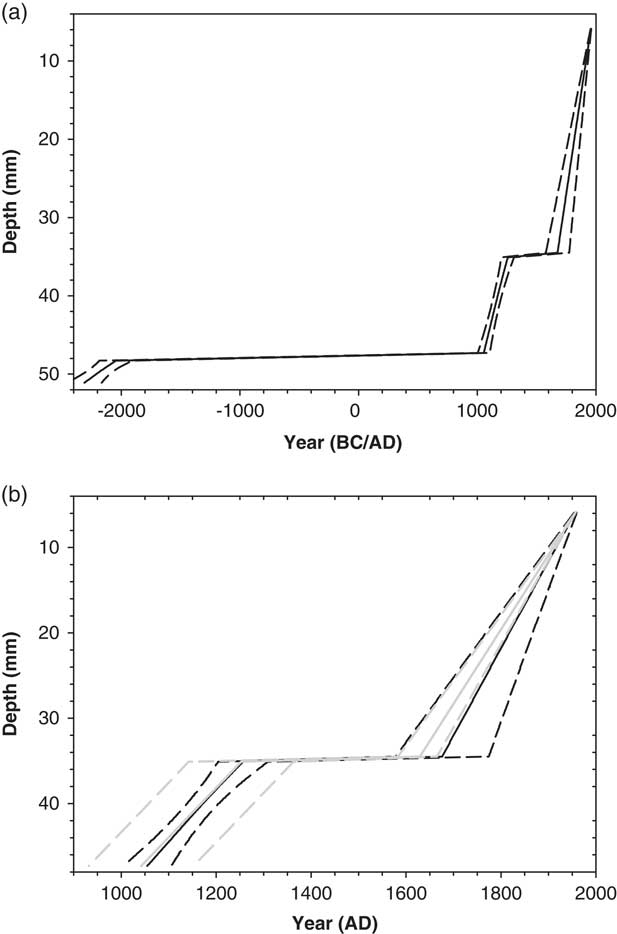
Chronological reconstruction for PC1 was achieved using the estimated timing of the onset of bomb 14C in PC1 at 5.9 mm depth of 1957±2 and DCF-corrected 14C ages, and the OxCal P_sequence with variable accumulation rate k (Bronk Ramsey and Lee Reference Bronk Ramsey and Lee2013) taking into account growth stop for sections 1 and 2. Age-depth modeled results are shown in Figures 5a–b with a model agreement index (Amodel) of 154%, much higher than the accepted level of 60% (Bronk Ramsey Reference Bronk Ramsey2008).
Age-depth models for (a) the top 51 mm of PC1 based on Hua et al. (Reference Hua, McDonald, Redwood, Drysdale, Lee, Fallon and Hellstrom2012a)’s approach and (b) the top ~47 mm of PC1 derived from Hua et al. (Reference Hua, McDonald, Redwood, Drysdale, Lee, Fallon and Hellstrom2012a)’s approach (black lines) and Lechleitner et al. (Reference Lechleitner, Fohlmeister, McIntyre, Baldini, Jamieson, Hercman, Gasiorowski, Pawlak, Stefaniak, Socha, Eglinton and Baldini2016a)’s approach (gray lines). For both age-depth models, 1σ age ranges are shown.

Second Approach—Lechleitner et al. (Reference Lechleitner, Fohlmeister, McIntyre, Baldini, Jamieson, Hercman, Gasiorowski, Pawlak, Stefaniak, Socha, Eglinton and Baldini2016a)’s Method
This approach establishes a relationship between 14C decay (regular decreases in the 14C content with depth) and the long-term stationary speleothem growth rate, which can be expressed by the following equations:
 $${\rm ln}({\rm A}_{{{\rm spel}}} /{\rm A}_{{{\rm spel}.\,{\rm initial}}} ){\equals}{\minus}{\!}{\rm \lambda t}$$
or
 $${\rm ln}({\rm A}_{{{\rm spel}}} /{\rm A}_{{{\rm spel}.\,{\rm initial}}} ){\equals}{\minus}{\!}{\rm \lambda }{\times}{{\rm d} \mathord{\left/ {\vphantom {{\rm d} {\rm R}}} \right. \kern-\nulldelimiterspace} {\rm R}}$$
where d is depth and R is the long-term growth rate.
The 14C chronology of a speleothem is built based on an anchor point of known age and an R estimated using an iterative, MATLAB-based process taking into account variations in atmospheric 14C (Lechleitner et al. Reference Lechleitner, Fohlmeister, McIntyre, Baldini, Jamieson, Hercman, Gasiorowski, Pawlak, Stefaniak, Socha, Eglinton and Baldini2016a). Thus, this method is not dependent on any a priori knowledge or estimate of the DCF. In addition, variations in the DCF, which could also be large, are allowed, providing that stationarity of DCF is assumed. The DCF values will be calculated after the age-depth model is established.
We ran the MATLAB program described in Lechleitner et al. (Reference Lechleitner, Fohlmeister, McIntyre, Baldini, Jamieson, Hercman, Gasiorowski, Pawlak, Stefaniak, Socha, Eglinton and Baldini2016a) with an anchor point (OZR170 at 5.9 mm depth) of 1957 AD and taking into account a growth hiatus for section 1. An age-depth model for the top 47.2 mm of PC1, based on this approach, is also shown in Figure 5b.
DISCUSSION
The chronology based on the first approach indicates that the top 51 mm of PC1 grew in the past ~4300 yr with a period of growth hiatus during ~2000 BC–1050 AD at ~47–49 mm depth, and a much shorter hiatus of ~1250–1670 AD at 34.4–35.2 mm depth (Figures 5a–b). We are particularly interested in the top ~47 mm of PC1 because it incorporates the Angkor Period (~9th–15th centuries AD) and the subsequent “Middle Period” (15th–19th centuries AD). In addition, our model assumption of a constant DCF can be met for a short time span (the last ~1000 yr) and consequently a reliable chronology for this speleothem portion can be achieved.
Excellent agreement between the two age-depth models within 1σ uncertainties is observed for the top ~47 mm of PC1 (Figure 5b). For the younger portion (5.9–34.4 mm depth), uncertainties associated with the chronology based on the second approach are much smaller than those derived from the first approach, but the reverse is observed for older portion (35.2–47.2 mm). The reason for more precise chronology produced by the second approach for the younger portion of PC1 is the well-defined decay fit of the data. This is only possible, if DCF variations are small compared to the amount of 14C lost due to decay. In contrast, the larger age uncertainty of the second method (compared to that of the first approach) can be explained by the calibration step of the DCF-corrected 14C values necessary for the older portion, in which a well-defined anchor point is missing. The bunch of resulted calibrated ages gives a large range of possibilities for the line of constant growth derived from the decay fit. Thus, the need to replace the missing anchor point this way produces larger uncertainties.
The constant DCF value used in the first approach of 7.3±1.4% (1σ) is not different from the average DCF values by the second approach, which were calculated after the establishment of the age-depth relationship, of 7.3±0.7% (1σ) and 7.3±1.1% (1σ) for the younger and older portions, respectively. Average growth rates estimated from the two approaches are also similar. For the older portion (35.2–47.2 mm depth), average growth rates are 0.060±0.022 and 0.058±0.024 mm/yr derived from the first and second methods, respectively. For the younger portion (5.9–34.4 mm depth), these values are 0.102±0.026 and 0.087±0.010 mm/yr, respectively, which are similar to the average growth rate for the post-bomb portion (the top 5.9 mm) of 0.118 mm/yr (5.9 mm/50 yr). These results demonstrate that if speleothem growth rate and DCF do not largely change with time, good concordance between the two dating approaches can be achieved.
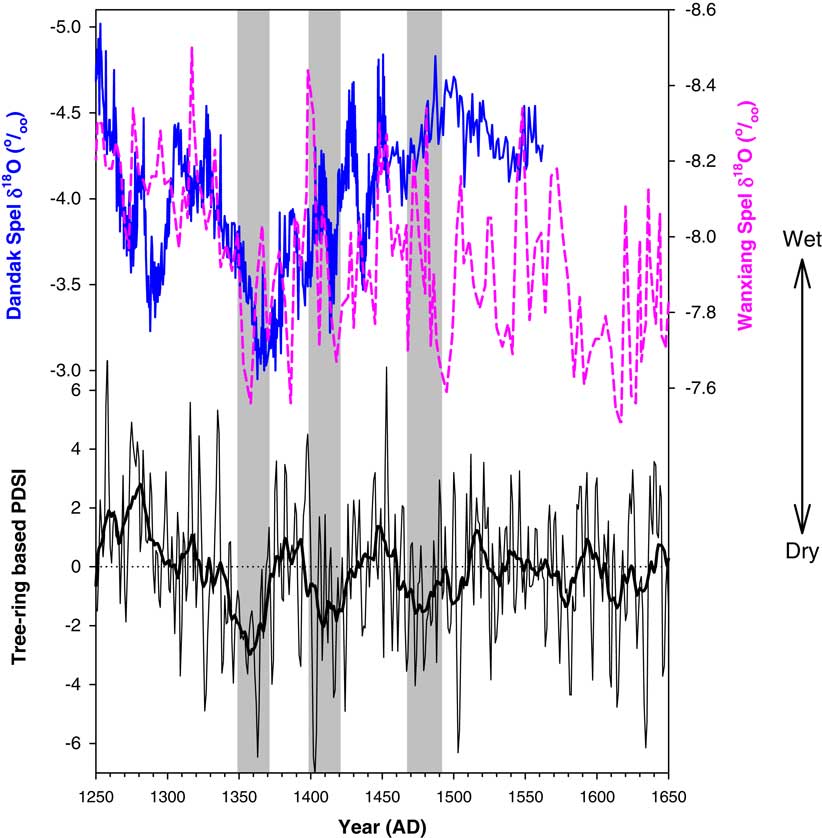
The age-depth models shown in Figure 5b and the growth rates discussed above indicate that the PC1 portion of 35.2–47.2 mm depth grew during ~1050–1250 AD and the top 34.4 mm portion grew faster between ~1650 (1670 and 1630 based on the first and second approaches, respectively) and 2007 AD. These two periods of growth were interrupted by a growth hiatus within section 1 (34.4–35.2 mm depth) during ~1250–1650 AD with 1σ uncertainties of ~100 yr. The duration of this growth hiatus covers the period of the decades-long droughts in the region around 1360, 1410, and 1480 AD (Figure 6; Sinha et al. Reference Sinha, Stott, Berkelhammer, Cheng, Edwards, Buckley, Aldenderfer and Mudelsee2011), which is based on speleothem δ18O records from Dandak Cave in central-eastern India (Sinha et al. Reference Sinha, Cannariato, Stott, Cheng, Edwards, Yadava, Ramesh and Singh2007; Berkelhammer et al. Reference Berkelhammer, Sinha, Mudelsee, Cheng, Edwards and Cannariato2010) and Wanxiang Cave in central China (Zhang et al. Reference Zhang, Cheng, Edwards, Chen, Wang, Yang, Liu, Tan, Wang, Liu, An, Dai, Zhou, Zhang, Jia, Jin and Johnson2008), and the Palmer Drought Severity Index (PDSI) reconstruction from Bidoup Nui-Ba National Park (BDNP) tree rings from southern Vietnam (Buckley et al. Reference Buckley, Anchukaitis, Penny, Fletcher, Cook, Sano, Le, Wichienkeeo, Ton That and Truong2010). The 14th and early 15th century droughts, punctuated by a brief “pluvial” episode at the end of the 14th/start of the 15th century, has been implicated in the demise of Angkor during the 15th century AD (Buckley et al. Reference Buckley, Anchukaitis, Penny, Fletcher, Cook, Sano, Le, Wichienkeeo, Ton That and Truong2010). Although these decades-long droughts do not appear in all of the three regional climate records (e.g., the drought period centered on ~1480 AD is only observed in the Wanxiang speleothem and BDNP tree-ring records), the clear phase of growth hiatus recorded in section 1 of PC1 is best explained as reflecting reduced precipitation in southern Cambodia at this time, supporting the occurrence of multi-decadal drought across the region during the 14th–16th centuries AD. Furthermore, the PC1 stalagmite record provides the strongest evidence so far that this well-documented period of historical drought may have impacted the lowland regions of Cambodia, providing important new insights into the history of climate during the fluorescence and demise of the ancient Khmer at Angkor.
Regional paleoclimate records of medieval drought during 1250–1650 AD. Top panel: Dandak Cave δ18O record (solid line) from central-eastern India (Sinha et al. Reference Sinha, Cannariato, Stott, Cheng, Edwards, Yadava, Ramesh and Singh2007; Berkelhammer et al. Reference Berkelhammer, Sinha, Mudelsee, Cheng, Edwards and Cannariato2010) and speleothem δ18O record from Wanxiang Cave (dashed line) in central China (Zhang et al. Reference Zhang, Cheng, Edwards, Chen, Wang, Yang, Liu, Tan, Wang, Liu, An, Dai, Zhou, Zhang, Jia, Jin and Johnson2008). Bottom panel: PDSI reconstruction based on BDNP tree rings from southern Vietnam (Buckley et al. Reference Buckley, Anchukaitis, Penny, Fletcher, Cook, Sano, Le, Wichienkeeo, Ton That and Truong2010). Thin and thick lines depict raw and 15 yr moving average values. Gray shadings depict regional decades-long droughts defined by Sinha et al. (Reference Sinha, Stott, Berkelhammer, Cheng, Edwards, Buckley, Aldenderfer and Mudelsee2011).

The above discussions are for the most likely option of the first appearance of bomb 14C in PC1 at 5.9 mm depth (the 2nd option). The 3rd option with the onset of bomb 14C at 8.9 mm depth is considered as less likely due to large difference in PC1 growth rate between the top 8.9 mm and 8.9–34.4 mm depth as mentioned previously. However, if the 3rd option is correct, the chronology for the top ~47 mm of PC1 shown in Figure 5b is shifted by ~40 yr on average to the younger timescale (45 and 38 yr for the first and second methods, respectively). This age shift is less than 1σ uncertainties associated with the modeled ages (in most cases) and results in the timing of the growth stop within section 1 of ~1290–1690 AD with 1σ uncertainties of ~100 yr. This timing still covers the regional decades-long droughts during the 14th–16th centuries AD and consequently does not change the above discussion on regional climate.
CONCLUSION
The top portion of a tropical stalagmite, PC1 from southern Cambodia, has been dated by 14C using the two methods reported by Hua et al. (Reference Hua, McDonald, Redwood, Drysdale, Lee, Fallon and Hellstrom2012a) and Lechleitner et al. (Reference Lechleitner, Fohlmeister, McIntyre, Baldini, Jamieson, Hercman, Gasiorowski, Pawlak, Stefaniak, Socha, Eglinton and Baldini2016a). The results show excellent agreement between the two age-depth models, indicating that the top ~47 mm of PC1 grew during the last millennium. Our 14C-based chronology for the difficult-to-date speleothem, PC1, shows a clear period of growth hiatus that is best explained by prolonged drought conditions over the Indochina Peninsula during the 14th–16th centuries AD, confirming previous findings of drought identified in regional proxy records.
ACKNOWLEDGMENTS
AMS 14C measurements were supported by AINSE grant (13/021) and ANSTO’s Environment Theme. We acknowledge the financial support from the Australian Government for the Centre for Accelerator Science at ANSTO through the National Collaborative Research Infrastructure Strategy (NCRIS). We also acknowledge funding and support from the UK Arts and Humanities Research Council (Award 119196) and the Scottish Universities Environmental Research Centre (SUERC). J.F. acknowledges funding by the German Science Foundation (grants: FO809/2-1 and FO809/4-1). We thank S. Hankin for the preparation of Figure 1 and B. Buckley for the generous provision of tabulated tree-ring-based PDSI data shown in Figure 6. We also thank W. Beck, A. Noronha and an anonymous reviewer for their useful comments, which improved the manuscript.
APPENDIX
Modeling the Carbon Transfer Dynamics
One option to check the reliability for the choice of the onset of bomb 14C in the stalagmite is to check if a certain age spectrum of SOM is able to explain the observed shape of the stalagmite data. For this purpose, the model of Fohlmeister et al. (Reference Fohlmeister, Kromer and Mangini2011) was used. This box-model assumes that SOM consists of three pools of different age accounting for six unknown parameters. Each pool contributes a certain portion to the total respired soil gas CO2, which is dissolved by infiltrating water. In addition, a seventh parameter is included, representing the carbonate contribution of the host rock, which is responsible for a dilution in 14C. By a random variation of these parameters it is tried to fit the measured stalagmite 14C data best.
For the age-depth relationship of PC1, we assumed that the tip of the stalagmite refers to the time of removal of the speleothem (2007 AD) and that the first 14C sample with bomb imprint (either 5.9 mm [2nd option] or 8.9 mm [3rd option] depth) refers to 1957 AD. The calendar ages for the samples in between the two tie points and for a short period prior to the onset of bomb 14C were derived by linear interpolation. The best parameter set for both options of a possible first appearance of bomb 14C, out of 100,000 simulations each, is presented together with the fit (Figure A1).
Results of the simple carbon cycle mixing model described in Fohlmeister et al. (Reference Fohlmeister, Kromer and Mangini2011) for (a) the 2nd option for the onset of bomb 14C in PC1 at 5.9 mm depth and (b) the 3rd option for the onset of bomb 14C in PC1 at 8.9 mm depth. Black dots are measured 14C data for PC1. Solid and dashed lines are atmospheric 14C and modeled speleothem 14C data, respectively.