I. INTRODUCTION
Recently, in the process of creating highly efficient thermoelectric materials, the research in the low-dimensional structures has been intensified.Reference Davies1, Reference Dresselhaus, Ghen, Rang, Yang, Lee, Wang, Ren, Fleurial and Gogna2 The reduction of the material dimension creates the conditions for observing the phenomenon of quantum-size effect, which increases the density of states near the Fermi energy. This allows to sufficiently save high electrical conductivity σ at the relatively low Fermi energy E F, where there are high values of the Seebeck coefficient S. The appreciable influence of the quantum effects on thermoelectric properties is possible only when the size of structure in confinement direction is comparable with the carrier’s de Broglie wave length. This condition is accomplished for the structures in the form of quantum wells (QWs),Reference Hicks, Harman, Sun and Dresselhaus3–Reference Rogacheva, Nashchekina, Meriuts, Lyubchenko, Dresselhaus and Dresselhaus10 quantum wires,Reference Lin and Dresselhaus11 and quantum dots,Reference Springholz, Holy, Pinczolits, Bauer and Bauer12–Reference Harman, Taylor, Walsh and LaForge15 in which dimensional restriction is created in one, two, or three directions, respectively. Thus, the electron density of states displays a marked deviation from the usual parabolic law in bulk materials.
The behavior of thermoelectric parameters [the electrical (σ) and thermal (k) conductivity, the Seebeck coefficient S] in bulk materials is usually described in terms of electronic and phonon properties that change greatly with the reduction of the sample size below ∼100 nm, where the quantum effects become more significant. The spatial restriction of the acoustic phonons and the appropriate modification of the group velocity leads to the increase in phonon relaxation rate and results in the decrease of lattice thermal conductivity k L.Reference Baladin and Wang16 Besides, the nature of interactions between the charge carriers changes greatly. The theoretical calculations associated with the estimation of these effects on the transport coefficients are usually performed within the framework of size quantum limit, which is based on the simplification that electrons occupy only the lowest subbands. In such an approach, consideration of the multiple subband structure of QW can lead to nonmonotonic changes of various kinetic parameters such as mobility μ, the Seebeck S, and the Hall coefficients R H.Reference Singh and Bhandari17
The aim of this study is to verify the expediency of using the model of infinitely deep rectangular QW for some compounds IV–VI (PbS, PbSe, PbTe, and SnTe), grown on substrates KCl and coated with a protective layer EuS.Reference Rogacheva, Nashchekina, Meriuts, Lyubchenko, Dresselhaus and Dresselhaus10 The task is to compare the experimental and the theoretical dependencies of one of the thermoelectric parameters (the Seebeck coefficient) on the layer thickness for compounds IV–VI.
II. THEORETICAL MODEL
For the QW with high walls, the electrons are confined in the direction of OZ, but in the X- and Y-directions their movement is autonomous. The electronic wave function and energy eigenvalues in terms of parabolic energy bands are determined by equationsReference Singh and Bhandari17:

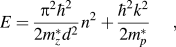
where  , mz* is the effective mass of electron along confinement direction;
 , mx*, my* are the effective masses of electron along the x and y axes, Ω the total volume of the layer, d the well width, and n is a quantum number that obtains values of natural numbers.
By the quantization of the conduction band, the density of states changes abruptly with the change of energy. Depending on the probability amplitude, the electrons can be found in any subbands (E 1, E 2, … En), with a certain probability hop from one band to the nearest one and occupy levels up to the Fermi energy.
In the case of QW, the thermoelectric transport coefficients can be obtained from Boltzmann equations, which are written under the assumption that the steady state of electronic distribution function remains constant and changes only by external forces and fields. Then, the system of electrons returns to equilibrium through various relaxation processes with characteristic relaxation times. For quasi-two-dimensional system, it can be written asReference Bhandari and Rowe18

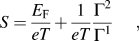

where σ is the electrical conductivity, S the Seebeck coefficient, k e the electronic component of thermal conductivity, and E F is the Fermi energy.
The transport coefficient Г is defined by semiclassical approach in which particles are confined in one-dimensional box. Thermal gradient and the electric field are directed along OX-axis. Then,
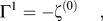

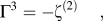
where
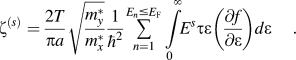
Here f is the Fermi distribution function, ε = E − En, and τ is the relaxation time, which in the case of scattering on acoustic phonons has the form ofReference Drabble and Coldsmid19
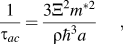
where Ξ is the deformation potential, ρ the material density, and m* is the material effective mass. As it can be seen from Eq. (10), the relaxation time is independent from the energy, so it can be taken outside the integral.
With this approximation, the Seebeck coefficient is defined as
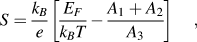
where
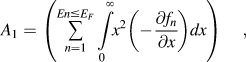
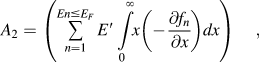
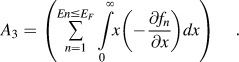
The Fermi distribution function has a known form:
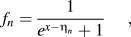
where  is the reduced carrier energy, and
 . Here,
 and
 .
III. RESULTS AND DISCUSSION
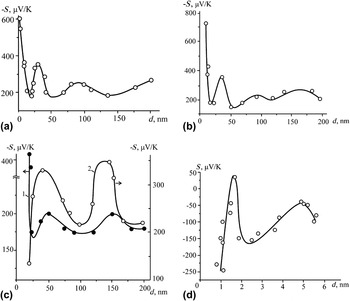
Based on the experimental data (Fig. 1)Reference Rogacheva, Nashchekina, Vekhov, Dresselhaus and Cronin7–Reference Rogacheva, Nashchekina, Meriuts, Lyubchenko, Dresselhaus and Dresselhaus10 that has proved nonmonotonous, oscillatory character of the Seebeck coefficient changes with the change of the condensate thickness, it can be hypothesized that such behavior is due to quantization of energy carriers by the restriction of their movement in the potential well. The increasing of the well width on the value of half the Fermi wave length leads to a new subband below the Fermi energy. When a new subband is filled, in the density of states there is a jump, which leads to oscillating behavior.
Experimental dependence of the Seebeck coefficient S on the thickness layer d for quantum well (QW) (a) PbS, (b) PbSe, (c) PbTe (curve 1, stoichiometric; curve 2, with 2 at.% excess Pb), and (d) SnTe (in heterostructure n-PbTe/p-SnTe/n-PbTe) alternated between dielectrics (100) KCl and EuS at T = 300 K.Reference Rogacheva, Nashchekina, Vekhov, Dresselhaus and Cronin7–Reference Rogacheva, Nashchekina, Meriuts, Lyubchenko, Dresselhaus and Dresselhaus10

The number of quantized levels below the given energy is determined from the first part of Eq. (2):
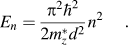
Substituting the Fermi energy in Eq. (16), it is possible to find the width d, where the given number of levels n is below the Fermi level. The difference between the values of this width for the two nearest levels defines a period of oscillations Δd, which is equal to width d min, where the bottom of the lowest subband coincides with energy E F. Thus, it follows from Eq. (16):

Equation (17) demonstrates that the change of the Fermi level value causes the change of oscillation period Δd. Using the experimental dependences (Fig. 1), it can be summarized that the defining of the period of oscillations Δd exp leads to a fixed value of the Fermi energy, which, together with the value of the effective mass, describes a specific compound in the form of QW.
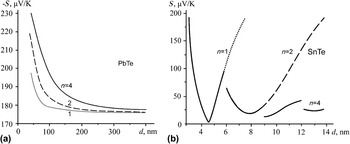
The result of constructing d-dependence of the Seebeck coefficient for PbTe QW within the framework of size quantum limit, which assumes that all the electrons occupy the lowest zone (n = 1), is the descending function of the exponential type [Fig. 2(a)],Reference Singh and Bhandari17 and for QW SnTe this approximation gives parabola [Fig. 2(b)]. A larger number of the bands that electrons take (n = 2, n = 4) in the QWs of lead chalcogenides lead to the growth of coefficient S value [Fig. 2(a)] and—in the QW SnTe—to the appearance of breaks in the dependences S(d) [Fig. 2(b)]. So, nonmonotonous change of the thermoelectric parameters can be obtained only by taking into account all the bands below the Fermi energy.
Dependence of the Seebeck coefficient on the width d of QW (a) PbTe and (b) SnTe with infinitely high walls at n = 1, 2, and 4; E F PbTe = 129.3 × 10⁻⁴ eV and E F SnTe = 347 ×·10−3eV.

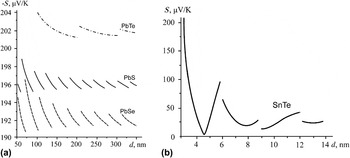
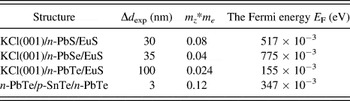
Analysis of the behavior of the Seebeck coefficient in nanostructures PbS, PbSe, PbTe, and SnTe at 300 K proves that the QW width in the theoretical model has to be equal to the thickness of condensate in the experimental dependences S(d) (Fig. 1). The calculations were carried out for different well widths at the given values of the Fermi energy, which is the function of concentration and temperature. Figure 3 shows d-dependences of the Seebeck coefficient for the QW PbTe, PbSe, PbS [Fig. 3(a)] and SnTe [Fig. 3(b)] with experimentally determined oscillation period Δdexp, and Table I shows values of the Fermi energy EF that was obtained. Also, the connection of the Seebeck coefficient S with the well width experiences the discontinuities. The values of the effective masses for the compounds PbS, PbSe, and PbTe were taken from Ref. Reference Rawich, Efimova and Smirnova20 and for the compound SnTe from Ref. Reference Rogacheva, Nashchekina, Meriuts, Lyubchenko, Dresselhaus and Dresselhaus10. It should be considered that the calculation procedure of the dependences S(d) for compounds IV–VI (Fig. 3) takes into account different number of filled bands for various well widths at the fixed Fermi energy.
Dependence of the Seebeck coefficient on the width d of QW (a) PbS, PbSe, and PbTe and (b) SnTe in the model infinitely deep potential well.

Values of the oscillation period (Δd exp), effective mass (m z*), and calculated on their basis the Fermi energy (E F) for nanostructures based on compounds IV–VI.

In this approach, the experimental value of oscillation period is equal to minimum QW width d min [Eq. (17)], where the quantum-size effects are the main factor that conditions nonmonotonous change of thickness dependencies of thermoelectric (TE) parameters in the relevant structures. Therefore, quite a large oscillation amplitude and period in QW PbTe (Δd = d min = 100 nm) [Fig. 1(a)] as well as a large value of oscillating amplitude on the interval from 1 to 3 nm in QW SnTe [Fig. 1(g)] may indicate that at smaller well widths the priority in the determining nonmonotonic change for d-dependence of TE-parameters belongs to different processes. In particular, Rogacheva et al.Reference Rogacheva, Krivulkin, Nashchekina, Sipatov, Volobuev and Dresselhaus21 explained nonmonotonous change of TE-parameters for PbTe nanostructures by the competition between the quantum-size effects and percolation processes that determine the transition from an island-like structure to a continuous one. This is also true for compounds PbS and PbSe.
Evaluating the value of the Fermi energy based on experimental values of the carrier concentration and substituting E F in Eq. (17), it is possible to compare received oscillation periods with their experimental meanings. Thus, in contrast to PbS and PbTe QW, for QW PbSe and SnTe it has placed a good agreement with experiment: PbSe: Δd theor = 27 nm and Δd exp ≈ 35 nm; SnTe: Δd theor = 3 nm and Δd exp ≈ 2.9 nm.Reference Rogacheva, Nashchekina, Vekhov, Dresselhaus and Cronin7–Reference Rogacheva, Nashchekina, Meriuts, Lyubchenko, Dresselhaus and Dresselhaus10
Comparing Fig. 3(a) with Figs. 1(a)–1(c), one can notice the discrepancy between the oscillation amplitude of theoretical [Fig. 2(a)] and the experimental d-dependences [Figs. 1(a)–1(c)] of the Seebeck coefficient for lead chalcogenides. In particular, for PbSe QWs, maximum oscillation amplitude in theoretical model is 5.5 μV/K, while in the experimental model, it is ∼190 μV/K for thicknesses larger than d min. However, the comparison of values for theoretical [Fig. 3(b)] and experimental [Fig. 1(d)] oscillation amplitudes from d-dependences of the Seebeck coefficient for SnTe QW gives a good agreement. Thus, in Fig. 3(b), for SnTe QW, maximum oscillation amplitude in the theoretical model is ∼189 μV/K, while in the experimental model, it is ∼122 μV/K in the range of 2.4–5 nm and ∼206 μV/K in the range from 1.5 to 2.4 nm [Fig. 1(d)].
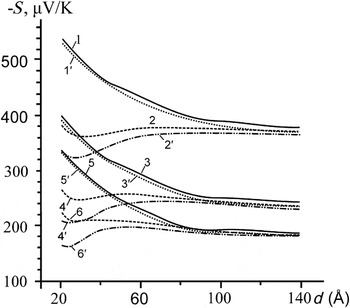
The theoretical workReference Casian, Sur, Scherrer and Dashevsky4 for QW structures PbTe/Pb1-xEuxTe at 300 K indicates that reduction of the potential barrier height leads to an increase in the Seebeck coefficient. Thus, in Fig. 4, curves 1, 2, 3, 4, 5, and 6 with the potential barrier U = 171 meV (x = 0.073) are positioned above curves 1′, 2′, 3′, 4′, 5′, and 6′ with the barrier height of U = 250 meV. The same can be said about the thermoelectric power factor S2σ.Reference Casian, Sur, Scherrer and Dashevsky4 Accordingly, the reduction of potential barrier height will increase the value of the Seebeck coefficient. The absence of oscillations in Fig. 4 is explained by a small range of thicknesses, for which the value of coefficient S was calculated (d ≈ 2–14 nm), and thus by a small number of subbands that are below the Fermi energy. Ref. Reference Singh and Bhandari17 illustrates that for QW PbTe, at n = 1, 2, and 4, the oscillating d-dependence for the coefficient S is not fixed and, as it has been already mentioned, these dependencies are smoothly decreasing the functions of exponential type, similar to those of Fig. 4 [Fig. 2(a)].
Dependence of the Seebeck coefficient S(d) of QW PbTe/Pb1-xEuxTe on width d for QW orientations (100) (curves 1, 1′, 3, 3′, 5, 5′) and (111) (curves 2, 2′, 4, 4′, 6, 6′): for 1, 2, 3, 4, 5, and 6, potential barrier U = 171 meV (x = 0.073); for 1′, 2′, 3′, 4′, 5′, and 6′, U = 250 meV; and T = 300 K. Curves 1, 1′, 2, 2′ are calculated for n = 1018cm−3; 3, 3′, 4, 4′ for n = 5 × 1018 cm−3; and 5, 5′, 6, 6′ for n = 1019cm−3.Reference Casian, Sur, Scherrer and Dashevsky4

The dependence of S on the width of QW SnTe should be regarded in details [Fig. 3(b)]. According to Fig. 2(b), the character of function Sn = 1(d) when n = 1 before the first gap (d = 6 nm) coincides with function Sn = 2(d) and Sn = 2(d) = Sn = 4(d) before the second gap, which occurs at d = 9 nm. Thus, the increase in the electron number of populated bands per one unit leads to a discontinuity in function S(d) with a period of 3 nm. It can be assumed that within the chosen range of well width change (d = 3–14 nm), the calculation of S(d) is sufficient for only four filling bands (n = 4).
Figure 1(d) shows that experimentally obtained d-dependence of the Seebeck coefficient is opposed to the theoretical one [Fig. 3(b)] and has negative values. The explanation is the fact that in heterostructures n-PbTe/p-SnTe/n-PbTe barrier layers of PbTe have n-type conductivity. The sign of the Seebeck coefficient is determined by the concentrations ratio of holes in SnTe layer and the electrons in barrier layers. As the barrier layers thickness did not change (d 1PbTe ≈ 40 nm ≥ d 2PbTe ≈ 10 nm),Reference Rogacheva, Nashchekina, Meriuts, Lyubchenko, Dresselhaus and Dresselhaus10 the carrier concentration n-type in them remained identical. Thus, presence of n-type barrier layers in this structure does not affect the oscillation amplitude, the positions of break points, and extrema and substitutes only the absolute value of the experimentally obtained d-dependence of the Seebeck coefficient compared to the theoretical one.
The theoretical dependence S SnTe(d) has been built from the aforementioned minimum width d min = 3 nm, and the comparison with the experimental one is to be done only in the range of 3–6 nm. In this range on Fig. 3, one can find two extreme points: minimum d theor, min1 = 4.8 nm and maximum d theor, max1 = 6 nm. On Fig. 1(d), it is also possible to distinguish two extreme points, which lie near corresponding points on the theoretical curve [Fig. 1(d)]: d exp, min1 = 2.4 nm, d exp, max1 = 4.9 nm. Then the QW width corresponding to a minimum of theoretical dependence of S(d) exceeds its experimental value on Δd min1 = 2.4 nm and the theoretical QW width, what corresponds to maximum of S(d) ? on the value Δd max1 = 1.1 nm. Assuming that the percolation processes lead to the extreme points displacement of experimental dependence S(d) in comparison with the theoretical one, it can be supposed that their influence decreases with the increase in SnTe thickness. Indeed, in a specified range, the maximum point corresponds to a greater thickness than the minimum point, and the displacement of experimental minimum point to the theoretical one is larger than corresponding maximum point displacement (Δd min1 > Δd max1).
We would like to highlight that the reason for these shifts between experimental and theoretical extreme points in QW SnTe and for mismatch between the values of experimental and theoretical oscillation amplitude in lead chalcogenides may be imperfection of the theoretical model, in particular, imposed on the QW model limit, which suggests infinity of potential barriers height, ignoring nonparabolicity energy bands, and other scattering mechanisms and surface effects.
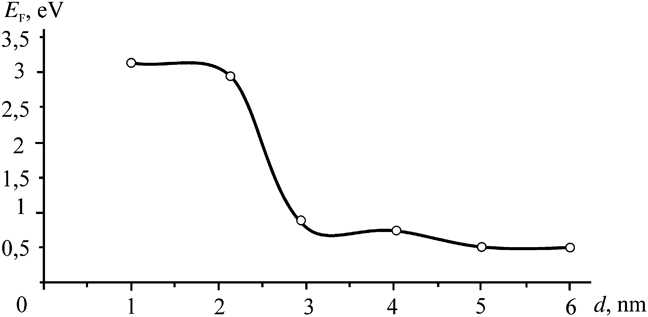
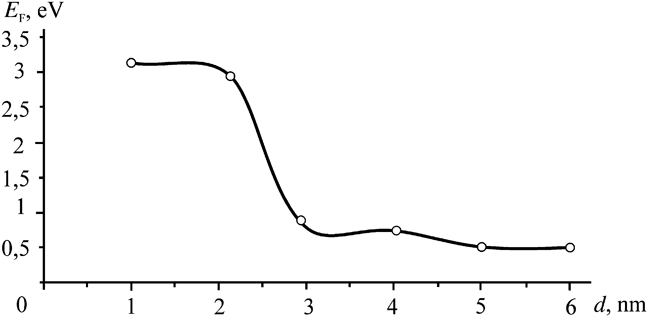
On the other hand, if percolation processes alter the main type carrier concentration in nanostructure, thereby changing the Fermi energy and hence oscillation period, then abrupt change in the carrier concentration would lead to the abrupt changes in the oscillation period of d-dependence of the Seebeck coefficient. The calculations for SnTe QW have shown the experimental dependence S(d) [Fig. 1(d)] in range from 1 to 2 nm is well described by the theoretical dependence of S(d) with the period of oscillation 1 nm. The dependence S(d) with oscillation period 2 nm describes the experimental in range 2–4 nm, and S(d) at Δd = 2.5 in the interval 4–6 nm. Since Eq. (17) associates the oscillation period with the Fermi energy, it is possible to construct the dependence E F(d) (Fig. 5). Figure 5 shows that with the change of well width from 2 to 3 nm, there is a sharp change of the Fermi energy. In the range from 3 to 6 nm, the Fermi energy is turning slightly and it can be considered as constant.
Dependence of the Fermi energy on SnTe well width, obtained by comparing the theoretical dependences S(d) for different oscillation periods with the experimental dependences.
The account of finite well depth and estimation of the other two TE-coefficients (σ and k) to calculate d-dependence of thermoelectric figure of merit for relevant structures will be considered in our next work.
IV. CONCLUSIONS
To summarize, we would like to accent that the dependences of the Seebeck coefficient on the width of QW with infinitely high walls for structures based on IV–VI compounds have demonstrated discontinuities with some period. On the basis of experimentally determined oscillation period Δd exp of the thickness dependences of the Seebeck coefficient, the Fermi energy values are determined in QW structures of compounds IV–VI.
Also, it was found that the oscillation period value Δd exp of QW is equal to the width of QW d min, where the bottom of the lowest subband coincides with the Fermi energy E F. The content of the width d min is the minimum QW width from which quantum-size effects are the main factor that determines nonmonotonous change of thickness dependencies for thermoelectric parameters in corresponding nanostructures.
The reduction of difference between the experimental and theoretical extremum points with increasing SnTe QW width is explained by the lowering of the percolation phenomena impact in such growth. For SnTe QW, it was found a good agreement between the theoretical and experimental values of the oscillation amplitude in dependence S(d) and shown that dependences S(d) with different oscillation periods are in a good agreement with the experiment at different intervals of condensate thickness variation. Thus, the dependence of the Fermi energy on the well width is received. A sharp alteration of the Fermi energy in the range from 2 to 3 nm was revealed.
ACKNOWLEDGMENT
Work performed under the scientific projects of the National Academy of Sciences (NAS) of Ukraine (State Registration No. 0110U006281) and State Fund for Fundamental Research (SFFR) State Agency for Science, Innovation and Information of Ukraine (state registration number 0110U007674).