

Introduction
Many animal species form social hierarchies and aggressively defend their rank or limited resources by showing hostile behaviours towards cohabitants. These behaviours can lead to a decreased quality of life for captive organisms and may skew results in research settings (du Sert et al. Reference du Sert, Hurst, Ahluwalia, Alam, Avey, Baker, Browne, Clark, Cuthill, Dirnagl, Emerson, Garner, Holgate, Howells, Karp, Lazic, Lidster, MacCallum, Macleod, Pearl, Petersen, Rawle, Reynolds, Rooney, Sena, Silberberg, Steckler and Würbel2020; Theil et al. Reference Theil, Ahloy-Dallaire, Weber, Gaskill, Pritchett-Corning, Felt and Garner2020). In a natural environment, there is typically a greater opportunity for individuals at the receiving end of aggression to escape and honour territory boundaries set by individuals with higher social rank. In a laboratory cage or a zoo enclosure, opportunities to avoid conflict are greatly reduced, potentially resulting in lower welfare in subordinate individuals that are the target of aggression. For example, mice (Mus musculus) that are kept in a laboratory setting cannot escape intraspecific aggression from dominant individuals, and consequently, intra-cage aggression is potentially the most common source of morbidity in mouse facilities (Lidster et al. Reference Lidster, Owen, Browne and Prescott2019; Theil et al. Reference Theil, Ahloy-Dallaire, Weber, Gaskill, Pritchett-Corning, Felt and Garner2020).
Environmental enrichment is a common tool to improve welfare by allowing animals to express their natural behavioural repertoire. It may also mitigate the negative consequences of aggression by providing opportunities for hiding to avoid conflict (Benefiel et al. Reference Benefiel, Dong and Greenough2005; Kaliste et al. Reference Kaliste, Mering and Huuskonen2006; Young Reference Young2013; Stevens et al. Reference Stevens, Reed and Hawkins2021). For example, partial cage dividers, used to increase environmental complexity, reduced aggressive events in male mice, bite wounds, anxiety, and improved overall welfare by creating more opportunities to avoid conflict (Tallent et al. Reference Tallent, Law and Lifshitz2024). Physical complexity may create barriers between competitors, which can lower intraspecific aggression levels. For instance, in brown trout (Salmo trutta), complex habitats using woody debris decreased opportunities for aggressive interactions by visually isolating fish, promoting animal welfare as indicated by reduced mass loss (Sundbaum & Näslund Reference Sundbaum and Näslund1998). Structural complexity may help delimit individual territories within a captive setting, allowing subordinate individuals to respect territorial boundaries and avoid conflict (Galhardo et al. Reference Galhardo, Correia and Oliveira2008; Smith Reference Smith2011). However, physical structures used to enrich the environment can raise resource value and encourage active defence by the owner against competitors, as shown in mice, zebrafish (Danio rerio), and cichlids (Kaliste et al. Reference Kaliste, Mering and Huuskonen2006; Dijkstra et al. Reference Dijkstra, van der Zee and Groothuis2008; Mandrekar & Oldfield Reference Mandrekar and Oldfield2008; Wilkes et al. Reference Wilkes, Owen, Readman, Sloman and Wilson2012; Giles et al. Reference Giles, Whitaker, Moy and Fletcher2018). Although territorial aggression can be used as a way to induce physiological stress in subordinate individuals (Patki et al. Reference Patki, Solanki, Atrooz, Allam and Salim2013; Ibi et al. Reference Ibi, Liu, Arakawa, Kitaoka, Kawaji, Matsuda, Iwata, Matsumoto, Katsuyama, Zhu, Teramukai, Furuyashiki and Yabe-Nishimura2017; Lehmann et al. Reference Lehmann, Weigel, Poffenberger and Herkenham2019; Snyder-Mackler et al. Reference Snyder-Mackler, Burger, Gaydosh, Belsky, Noppert, Campos, Bartolomucci, Yang, Aiello, O’Rand, Harris, Shively, Alberts and Tung2020), strategies to reduce the amount of aggression are vital for both animal welfare (through reducing pain and suffering) and high-quality scientific research (Soper & Dijkstra Reference Soper and Dijkstra2026).
The conflicting effects of enrichment on aggression and animal welfare may be due, in part, to increased environmental heterogeneity supporting a higher density of territorial individuals (Eason & Stamps Reference Eason and Stamps1992; Blanchet et al. Reference Blanchet, Dodson and Brosse2006) or more equal distribution of limited resources (Basquill & Grant Reference Basquill and Grant1998). For example, in rainbow trout (Oncorhynchus mykiss), territorial enrichment using cobbles and dividers resulted in smaller individual territories as habitat visibility decreased (Imre et al. Reference Imre, Grant and Keeley2002). These changes in the density of territorial individuals or the degree of resource monopolisation may greatly impact welfare by altering the amount of escalated aggression directed at subordinate individuals (Ruberto et al. Reference Ruberto, Swaney and Reddon2024). Consequently, enrichment-induced changes in the dominance hierarchy make it difficult to isolate the mechanisms that modulate the amount of territorial aggression and opportunities for conflict avoidance. Hence, clarifying the effect of environment enrichment on animal welfare should be carried out in controlled settings where the density of dominant individuals is kept constant across enrichment treatments. Specifically, it is currently unclear how variations in the complexity of a compact enrichment structure defended by a single dominant individual influence the welfare outcomes of subordinate individuals.
The African cichlid fish Astatotilapia burtoni exhibits a social hierarchy in which dominant males are brightly coloured, aggressively defend territories used to attract females for spawning, and have an upregulated reproductive system, as indicated by large gonads (Maruska & Fernald Reference Maruska and Fernald2018; Border et al. Reference Border, Piefke, Funnell, Fialkowski, Sawecki and Dijkstra2021). Subordinate males are not brightly coloured, do not defend a territory, and are reproductively inactive. In many A. burtoni studies, dominant and subordinate males are studied relative to their behaviour (Piefke et al. Reference Piefke, Bonnell, DeOliveira, Border and Dijkstra2021), neural regulation of reproduction and competition (Maruska & Fernald Reference Maruska and Fernald2011; O’Connell & Hofmann Reference O’Connell and Hofmann2012; Alward et al. Reference Alward, Hilliard, York and Fernald2019), or regulation of oxidative stress (Border et al. Reference Border, Deoliveira, Janeski, Piefke, Brown and Dijkstra2019; Dijkstra et al. Reference Dijkstra, Fialkowski, Bush, Wong, Moore and Harvey2024). Previous studies suggest that excessive aggression from dominant males can lead to injury and death in subordinate fish (Alcazar et al. Reference Alcazar, Becker, Hilliard, Kent and Fernald2016; Alward et al. Reference Alward, Laud, Skalnik, York, Juntti and Fernald2020), but studies on enrichment and animal welfare are lacking in this species.
We tested how environmental enrichment influences markers of social status and welfare in A. burtoni mixed-sex groups (2 males, 6 females) using a common housing paradigm in which a single, larger dominant male defends a territory (Fialkowski et al. Reference Fialkowski, Border, Bolitho and Dijkstra2022). To manipulate enrichment, groups were housed with structures consisting of either 1, 2, or 3 halves of terracotta pots (referred to as ‘caves’). In all treatments, each structure could be defended by one dominant male (the two and three cave structures were clumped together). Hence, we were able to assess how animal welfare is impacted by environmental complexity with experimental groups, with each containing one dominant male and several subordinate fish. Since a more complex territory raises resource value, we predicted that increased cave complexity would increase aggressive behaviour, testosterone levels, and relative gonad size in dominant males only. Such a hypothesised increase in territoriality in more complex treatments could lead to reduced welfare of subordinate fish because of increased aggression from the dominant male. However, because increasing the number of caves would reduce visibility, create more hiding opportunities, and potentially distract territorial males more (by encouraging more cave inspections), we predicted that increasing cave number would nevertheless improve welfare in subordinate fish as indicated by increased body condition, growth, and fewer fin splits.
Material and methods
Study animals
Males and females of A. burtoni (aged approximately 8–12 months) were taken from a laboratory-bred population originating from Lake Tanganyika, Africa (Fernald & Hirata Reference Fernald and Hirata1979). Fish were raised in 400-L mixed-sex tanks with gravel substrate maintained at 28°C under a 12-h light/dark cycle, with gradual light changes to simulate natural dawn and dusk. Fish were fed cichlid flakes (Omega One cichlid flakes; OmegaSea, LLC, Painesville, OH, USA) and pellets (Omega One cichlid pellets; 2 mm; OmegaSea, LLC, Painesville, OH, USA) between 0800 and 1000h daily. Fish were individually tagged just below the dorsal fin with coloured beads attached to a plastic tag using a stainless-steel tagging gun (Avery-Dennison, Pasadena, CA, USA). The study was conducted between 12 July and 14 August 2024 at Central Michigan University in Mount Pleasant, Michigan, USA. All procedures were approved by the Central Michigan University Institutional Animal Care and Use Committee (2021-460).
Experimental design
At the start of the experiment, both males and females were collected from the same 400-L grow-out tank and measured for standard length and weight. For the experimental set-up, 19 tanks (110-L) were divided using a clear, perforated screen into two 55-L sections to create two compartments (Fialkowski et al. Reference Fialkowski, Aufdemberge, Wright and Dijkstra2021). To assign social status based on size difference, one larger male and one smaller male were placed in each compartment along with 6 females. In this set-up, fish were able to interact physically with members of their own group and visually with the others in the adjacent compartment. This allowed for the full expression of social behaviours, including aggressive interactions between dominant males between compartments. Halved terracotta pots (14 × 7 × 13 cm; length × width × height) were placed in the corner of each compartment (~30 cm from the divider; Figure 1[b]) to serve as defendable territories. The structural complexity was manipulated by placing 1, 2, or 3 halves of terracotta pots (‘caves’), with an approximate 2-cm gap between the caves and the tank wall to allow the fish to enter the caves (see Supplementary Figure 1 in Supplementary material for detailed cave arrangement). We set up a total of 12 groups in the 1-cave treatment, 13 groups in the 2-cave treatment, and 13 groups in the 3-cave treatment (each containing 2 males and 6 females). We randomised treatments across tanks to minimise potential confounding effects. We did not include a control group because this species requires territorial structures to establish dominance, and without them the group dynamics central to this study would not emerge. Of the 38 groups, five were excluded from the analyses: one due to misidentification of a female as a male (3-caves), one because a female became dominant over the males (3-caves), one where two dominant males emerged (3-caves), and two due to male mortality in the first week of the experiment (3-and 2-caves). A total of 304 fish were used in this study, (mean [± SEM] initial weight and standard length of males: 8.16 [± 1.03] g, 58.78 [± 1.28] mm; females: 3.2 [± 0.07] g, 48.4 [± 0.37] mm). Only male data were analysed in this study; female data will be reported elsewhere.
Showing (a) front and top views of cave placement in experimental tanks, illustrating how resource value and visibility were affected by the cave treatments and (b) experimental design. Two males and six females of Astatotilapia burtoni were housed in compartments with a neighbouring compartment (also with two males and six females) visible behind a perforated screen (dashed line). This allowed for the full expression of social behaviours between groups across compartments. The larger male was dominant while the smaller male was subordinate. Halved terracotta pots (‘caves’) were placed in the corner of the tank in the 1-cave (n = 12), 2-caves (n = 13) and 3-caves (n = 13) treatments. Tanks were filmed for 5 min and 30 s once per week. After the final filming session, males were measured and sacrificed for tissue collection. Blood and gonads were collected from each male to assess physiological markers of social status.

Figure 1. Long description
The diagram is divided into two main sections labeled a and b.
Panel a, titled Front view and Top view, shows how increasing the number of caves affects resource value and visual barriers.
* At the top, an arrow labeled More caves points from a single orange terracotta pot to a stack of three pots. Upward arrows indicate that Resource value and Visual Barrier increase with more caves.
* The Front view shows two 3D tank perspectives. In the left tank, one cave sits between two fish, with a dashed line indicating a line of sight. In the right tank, three stacked caves completely block the line of sight between the fish.
* The Top view shows the same setup from above. One semi-circular cave allows a dashed line of sight between two fish silhouettes. Three overlapping semi-circular caves create a solid barrier between the fish.
Panel b illustrates the experimental design and timeline.
* Three tank compartments are shown at the top. The first is labeled 1-cave n equals 12, containing one cave icon. The second is 2-caves n equals 13, with two cave icons. The third is 3-caves n equals 13, with three cave icons. Each compartment contains 2 male symbols and 6 female symbols. A dashed line on the right of each box represents the perforated screen for neighboring visibility.
* Below the tanks is a horizontal timeline labeled Week 0 to 5. Week 0 is marked Setup. Weeks 1, 2, 3, 4, and 5 each have a black camera icon above them, indicating filming.
* At Week 5, a red blood drop icon is positioned above the camera.
* To the right of the timeline, a box lists the final measurements: Length, Weight, Testosterone, and Gonad.
Behavioural and morphological analysis
After introducing the fish into each compartment, the dominance hierarchy was typically established in one to two days, with the larger male gaining social dominance and the smaller male being forced into the subordinate position in all groups that were included in the analysis (n = 35). After a 1-week acclimation period, we recorded social status and injury by quantifying fin splits for all fish 3 times per week. Dominant males displayed bright colouration, defended territories, and exhibited a distinct dark eye bar, whereas subordinate males had cryptic colouration and shoaled with females. As an indirect measure of aggression, we quantified fin damage as the number of splits in the dorsal, pectoral, anal, and caudal fins (modified from Hoyle et al. Reference Hoyle, Oidtmann, Ellis, Turnbull, North, Nikolaidis and Knowles2007; Noble et al. Reference Noble, Kadri, Mitchell and Huntingford2008; Oldfield Reference Oldfield2011).
For the following 5 weeks, once weekly prior to 1000h, fish were filmed (Canon EOS 70D; Canon USA, Inc, Melville, NY, USA) for 5 min and 30 s for behavioural quantification, with the final recording occurring on the morning of tissue collection (Fialkowski et al. Reference Fialkowski, Border, Bolitho and Dijkstra2022). Using the videos, an observer scored the frequency of behaviours as previously described (Border et al. Reference Border, Deoliveira, Janeski, Piefke, Brown and Dijkstra2019; Fialkowski et al. Reference Fialkowski, Aufdemberge, Wright and Dijkstra2021). For social dominance behaviours, we quantified the number of chases (defined as a rapid movement of one fish towards another, with the target typically fleeing), display behaviours (such as border threat and lateral display), cave visits, and courtship displays. We also scored the frequency of both fleeing and foraging behaviours.
Tissue collection
At the end of week five, following the final behavioural observation, both males and females were measured for standard length (SL; mm) and weight (g). Blood (25–100 μL) was collected from all males. Male gonads were extracted and weighed to calculate the gonadosomatic index (GSI) (Fialkowski et al. Reference Fialkowski, Border, Bolitho and Dijkstra2022).
Blood was drawn from the caudal vein using heparinised 26-gauge butterfly needles (Terumo Medical Corporation, Somerset, NJ, USA) and placed in heparinised microcentrifuge tubes, which were kept on ice until centrifugation at 4000 g for 10 min to separate the plasma. The plasma was then aliquoted for assays and stored at –80°C.
Circulating testosterone
We measured testosterone levels from 7 μL plasma samples using a competitive-binding ELISA kit and protocol (Enzo Life Sciences, Inc, Farmingdale, NY, USA), as previously described (Border et al. Reference Border, Deoliveira, Janeski, Piefke, Brown and Dijkstra2019). We measured optical density at 405 nm using a Tecan M200 Infinite plate reader (Tecan Group Ltd, Männedorf, Switzerland). We reported the values as nanograms of testosterone per milliliter of plasma (ng mL–1). The intra- and inter-assay coefficients of variation (CV) were 1.3 and 10.7%, respectively.
Statistical analysis
All analyses were performed in R v4.30. Relative gonad mass (gonadosomatic index [GSI = (gonad mass/body mass) × 100]) was used as an indicator of upregulation of the reproductive system and territoriality (Bolger & Connolly Reference Bolger and Connolly1989). Body condition was calculated using the formula [([body mass/(standard length)^3] × 100)] (Bagenal Reference Bagenal1978) and specific growth rate was calculated using [([log(final weight)–log(initial weight]) × 100)/34] (Jobling Reference Jobling1983). To assess differences in GSI, testosterone, specific growth rate, and body condition based on social status, we fitted linear mixed models (LMMs) that included social status (dominant or subordinate) as a fixed factor and group ID as a random factor, using the lmer function from the ‘lme4’ package (Bates et al. Reference Bates, Mächler, Bolker and Walker2015; Culbert et al. Reference Culbert, Border, Fialkowski, Bolitho and Dijkstra2023). We then examined whether these markers were associated with cave treatments by fitting LMMs that included cave number, social status (dominant or subordinate), and their interaction as fixed factors, with group ID as a random factor. To investigate how social behaviours (such as chases, aggressive displays, courtship, cave visits, and fleeing behaviours) and fin splits were affected by cave treatments, we employed generalised linear mixed models (GLMM) with status as the independent variable. GLMMs were fitted using negative binomial distribution using the glmmTMB package (Brooks et al. Reference Brooks, Kristensen, Van Benthem, Magnusson, Berg, Nielsen and Skaug2017). We analysed dominant and subordinate males separately for all analyses assessing the relationship between social behaviours and hormone levels, as the distributions of these variables were highly divergent between the groups. We used two-tailed tests. We report means (± SEM) for all model estimates. All model assumptions were assessed by examining residuals versus fitted values and Q–Q plots.
Results
Effects of enrichment on animal welfare
Animal injury and mortality
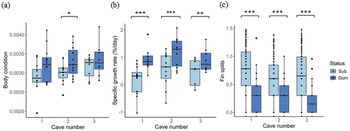
We observed the mortality of two subordinate males at the onset of the experiment before filming began; however, no further male mortality was found throughout the study period. One of the males that died was from the 2-caves treatment, and the other was from the 3-caves treatment. In terms of injury, subordinate males had more fin splits compared to dominant males (GLMM, status: –1.726 [± 0.112], z = –15.333; P < 0.001) in all cave treatments. Within subordinate males, the number of fin splits increased with time (GLMM, week: 0.115 [± 0.043], z = 2.664; P = 0.008), but effect was not influenced by treatments (GLMM, caves × week: –0.068 [± 0.053], z = –1.297; P = 0.194; Figure 2[c]). When fitted as main effect, treatment did not affect the number of fin splits (GLMM, caves: –0.089 [± 0.1], z = –0.884; P = 0.377) after controlling for the effect of status (GLMM, status: –1.726 [± 0.112], z = –15.333; P < 0.001).
Showing (a) body condition, (b) specific growth rate, (c) fin splits (log-transformed) as markers of welfare of subordinate (Sub) and dominant (Dom) males of Astatotilapia burtoni for 1-cave, 2-caves and 3-caves treatments. Boxes represent 25th to 75th percentiles. Error bars represent data range. * P < 0.5, ** P < 0.01, *** P < 0.001.

Figure 2. Long description
A multi-panel figure with three box plots labeled a, b, and c. All plots share a horizontal x-axis labeled Cave number with categories 1, 2, and 3. A legend on the right indicates light blue boxes for Sub and dark blue boxes for Dom status.
* Panel a: The y-axis is Body condition ranging from 0.0020 to 0.0040. For 1 cave, Sub and Dom are similar. For 2 caves, Dom is significantly higher than Sub, marked by a single asterisk. For 3 caves, both statuses show higher median values than the 1-cave treatment.
* Panel b: The y-axis is Specific growth rate in percent per day ranging from minus 1 to 2. In all cave treatments (1, 2, and 3), Dom fish have significantly higher growth rates than Sub fish. Treatments 1 and 2 are marked with triple asterisks, and treatment 3 is marked with double asterisks.
* Panel c: The y-axis is Fin splits ranging from 0.0 to 1.5. In all cave treatments, Sub fish have significantly higher fin split values than Dom fish, all marked with triple asterisks. The Sub boxes show a wider data range and higher medians compared to the Dom boxes which are clustered near the bottom of the scale.
Body condition
In subordinate males, cave number had a positive effect on body condition (LM, caves: 0.0001 [± 0.00007], t = 1.675; Table 1), but this effect was not significant (P = 0.106; Table 1). In dominant males, body condition did not vary significantly with cave numbers (LM, caves: 0.00006 [± 0.00009], t = 0.643; P = 0.526). Within each treatment, dominant males had a significantly higher body condition than subordinate males in the 2-caves treatment (LMM, status: –0.0003 [± 0.00009], t = –3.04, df = 11; P = 0.011), but this status difference was not significant in the 1-cave (LMM, status: –0.0003 [± 0.0001], t = –1.863, df = 13; P = 0.085) or the 3-caves treatment (LMM, status: –0.0002 [± 0.0001], t = –1.343, df = 9; P = 0.212; Figure 2[a]). As expected, dominant males exhibited higher body condition than subordinates (P = 0.004; Table 1). However, this effect did not vary with cave number treatments (P = 0.574; Table 1). After controlling for the effect of social status, cave number treatments were found to not have an effect on body condition (P = 0.137; Table 1).
Relationships between markers of welfare (body condition, specific growth rate) and social status (gonadosomatic index, testosterone) with cave treatments in dominant and subordinate Astatotilapia burtoni males. We analysed the data using linear mixed models with social status as a fixed factor and group identity as a random factor. Shown are the interaction effects and main effects. Significant effects (P < 0.05) are indicated in bold. Sample sizes are indicated for dominant (D) and subordinate males (S)

Table 1. Long description
The table presents results for four markers: body condition, specific growth rate, gonadosomatic index, and testosterone. Each marker is evaluated for the effects of cave treatment, social status, and the interaction between these factors. Columns include sample sizes for dominant and subordinate males, effect estimates, degrees of freedom, t values, and P values. Social status significantly influenced all measured markers, with dominant and subordinate males showing distinct physiological patterns. Cave treatment and cave × social status interactions were not significant for the measured markers.
Specific growth rate
Specific growth rate was higher in dominant compared to subordinate males (P < 0.001; Table 1) as expected. However, this effect did not vary across cave number treatments (P = 0.121; Table 1). When comparing each cave treatment, dominant males exhibited significantly higher SGR than subordinate males in the 1-cave treatment (LMM, status: 0.757 [± 0.167], t = –4.531, df = 13; P < 0.001), 2-cave (LMM, status: –0.607 [± 0.109], t = –5.558, df = 11; P < 0.001), and the 3-caves treatments (LMM, status: –0.441 [± 0.125], t = –3.528, df = 9; P = 0.006; Figure 2[b]). After controlling for the effect of social status, SGR of males did not vary with cave treatments (P = 0.412; Table 1). Cave treatment did not affect SGR for dominant (LM, caves: 0.006 [± 0.105], t = 0.056; P = 0.956) or for subordinate males (LM, caves: 0.161 [± 0.129], t = 1.249; P = 0.222).
Effects of habitat complexity on markers of social status
Gonadosomatic index
As expected, gonadosomatic index (GSI) was higher in dominant compared to subordinate males (P < 0.001; Table 1). This effect did not vary significantly across cave number treatments (P = 0.701; Table 1). Within each cave treatment, dominant males exhibited significantly higher GSI in the 1-cave treatment only (LMM, status: –0.442 [± 0.078], t = –5.612, df = 13; P = 0.001), but not in the 2- (LMM, status: –0.164 [± 0.157], t = –1.048, df = 12; P = 0.314) or the 3-caves treatment (LMM, status: –0.788 [± 0.352], t = –2.241, df = 9; P = 0.051; Figure 3[a]). Cave number treatment did not have a significant effect on GSI (P = 0.287; Table 1) after controlling for the effect of social status (P < 0.001; Table 1). Within social status, cave number treatment did not significantly influence GSI for dominant (LM, caves: 0.193 [± 0.125], t = 1.547; P = 0.133) or subordinates males (LM, caves: 0.053 [± 0.075], t = 0.705; P = 0.486).
Showing (a) gonadosomatic index and (b) testosterone levels as markers of social status of subordinate (Sub) and dominant (Dom) males of Astatotilapia burtoni for 1-, 2- and 3-caves treatments. Boxes represent 25th to 75th percentiles. Error bars represent data range. ** P < 0.01, *** P < 0.001.

Figure 3. Long description
Two side-by-side box plots with a shared legend on the right indicating light blue for Sub and dark blue for Dom status.
Panel a. Gonadosomatic index. The y-axis ranges from 0.25 to 1.25. The x-axis shows Cave numbers 1, 2, and 3. In all three cave treatments, Dom males have a higher median gonadosomatic index than Sub males. For Cave 1, the difference is statistically significant, marked by three asterisks. The median for Dom males is approximately 0.85 while Sub is approximately 0.45.
Panel b. Testosterone in n g m l super minus 1. The y-axis ranges from 0 to 60. The x-axis shows Cave numbers 1, 2, and 3. Dom males show higher median testosterone levels than Sub males in all treatments. Significant differences are marked with three asterisks for Cave 1 and two asterisks for Cave 2. In Cave 1, Dom median is near 30 while Sub is near 10. In Cave 2, Dom median is near 35 while Sub is near 15. In Cave 3, the medians are closer, approximately 30 for Dom and 20 for Sub.
Testosterone
Dominant males exhibited significantly higher testosterone levels compared to subordinates (P < 0.001; Table 1). This effect did not vary significantly with cave number treatments (LMM, social status × caves; P = 0.173; Table 1). Dominant males showed significantly higher testosterone levels in the 1- (LMM, status: –17.1 [± 4.2], t = –4.076, df = 12; P = 0.001) and 2-caves treatment (LMM, status: –20.5 [± 5.24], t = –3.916, df = 11; P = 0.002), while no significant difference was found in the 3-caves treatment (LMM, status: –5.13 [± 7.43], t = –0.690, df = 8; P = 0.508; Figure 3[b]). Cave number treatment did not affect testosterone levels (P = 0.19; Table 1) after controlling for the effect of social status (P < 0.001; Table 1). Within subordinate males, there was an increase in testosterone levels with cave numbers, but this effect was not significant (LM, caves: 5.318 [± 2.776], t = 1.915; P = 0.067). Cave number treatment did not affect testosterone levels within dominant males (LM, caves: 0.053 [± 2.824], t = 0.019; P = 0.985).
Behaviour
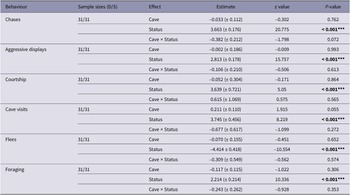
We calculated the average rate of different behaviours in each compartment across the five weekly five-minute observations. Dominant males engaged more frequently in chases, aggressive display behaviours, courtship, cave visits, and foraging than subordinate males (all P-values < 0.001; Table 2). In contrast, subordinate males displayed significantly more fleeing behaviour than dominant males (P < 0.001; Figure 4[b]). None of these social status effects were influenced by cave number treatment (Table 2, Figure 4).
Relationship between behaviours and cave treatments in dominant and subordinate Astatotilapia burtoni males. We analysed the data using generalized linear mixed models (with negative binomial distribution) with social status as a fixed factor and group identity as a random factor. Shown are the interaction effects and main effects. Significant effects (P < 0.05) are indicated in bold. Sample sizes are indicated for dominant (D) and subordinate males (S)

Table 2. Long description
The table presents behavioural measures including chases, aggressive displays, courtship, cave visits, fleeing, and foraging. Rows are organized by behaviour and tested effects, including cave treatment, social status, and their interaction. Columns provide sample sizes for dominant and subordinate males, effect estimates, degrees of freedom, test statistics, and P values. Social status influenced several behavioral measures, with dominant and subordinate males showing different behavioral patterns. Dominant males generally displayed higher levels of aggressive behaviors, courtship, foraging, and cave visits, while subordinate males showed higher fleeing behaviour.
Shows (a) chases, (b) flees, (c) aggressive displays, (d) courtship, (e) foraging, and (f) cave visits of subordinate (Sub) and dominant (Dom) males of Astatotilapia burtoni for 1-, 2- and 3-caves treatments. Data were averaged across the 5-week period. Boxes represent 25th to 75th percentiles. Error bars represent data range. ** P < 0.01, *** P < 0.001.

Figure 4. Long description
A six-panel set of box plots labeled a through f. Each plot has an x-axis for Cave number (1, 2, and 3) and a y-axis representing frequency per 5 minutes. A legend indicates light blue boxes for Sub (subordinate) and dark blue boxes for Dom (dominant) males.
* Panel a, Chases. Dom males show high activity (medians 25 to 28) while Sub males are near zero.
* Panel b, Flees. Sub males show high activity (medians 7 to 9) while Dom males are near zero.
* Panel c, Aggressive displays. Dom males show high activity (medians 5 to 12) while Sub males are near zero.
* Panel d, Courtship. Dom males show low but present activity (medians near 0.5) while Sub males are at zero.
* Panel e, Foraging. Dom males show higher activity (medians 3 to 5) compared to Sub males (medians near 0.5).
* Panel f, Cave Visits. Dom males show activity (medians 1.5 to 2.2) while Sub males are at zero.
In all panels, asterisks above brackets indicate statistical significance between Sub and Dom groups for all cave numbers. Three asterisks denote P < 0.001 and two asterisks in panel d for cave 3 denote P < 0.01. Individual data points are overlaid on the boxes, showing the full range of observations.
Discussion
We studied how environmental enrichment influences animal welfare and social dominance relationships in the cichlid, A. burtoni. We found that subordinate males exhibited more injuries, lower specific growth rates and reduced body condition compared to dominant males, but none of these markers of welfare were significantly influenced by the cave number treatment within subordinate males. Consistent with previous findings, dominant males exhibited higher rates of territorial behaviour, higher relative gonad mass (gonadosomatic index; GSI), and higher levels of testosterone than subordinate males. However, differences in testosterone levels, and GSI were diminished between dominant and subordinate males as environmental complexity increased. These findings suggest that environmental enrichment, when provided as an enrichment structure that could be monopolised by a single dominant male, has little to no effect on the welfare of subordinate individuals but may diminish the physiological differentiation between the two social states.
The lack of a positive effect of cave numbers on welfare in subordinates was somewhat surprising. Visual inspection of the data suggested a positive effect of cave number on body condition in subordinate males, but this pattern failed to reach significance. A more enriched environment may provide more hiding space or limit visibility (Höjesjö et al. Reference Höjesjö, Johnsson and Bohlin2004; Baird et al. Reference Baird, Patullo and Macmillan2006; Kadry & Barreto Reference Kadry and Barreto2010), which could benefit subordinates by avoiding direct encounters with dominant fish (Barley & Coleman Reference Barley and Coleman2010). However, in our study, subordinates were aggressively excluded from the cave(s) by the dominant male across all three cave treatments, as indicated by high rates of fleeing in all three treatments. This sustained high level of aggression, regardless of enrichment treatment, could potentially explain the lack of a clear effect of cave numbers on our markers of welfare.
As expected, dominant males were more aggressive, had higher testosterone levels and greater relative gonad mass values than subordinate males across all cave treatments. However, the differences in testosterone levels between dominant and subordinate males was not significant in the 3-caves treatment, possibly due to the marginal, though non-significant, increase in testosterone among subordinate males with increasing cave number. Subordinate males are known to exhibit elevated testosterone levels during male-male interactions (Oliveira et al. Reference Oliveira, Hirschenhauser, Carneiro and Canario2002) and often engage in increased agonistic behaviour during periods of social instability to attempt social ascension (Desjardins et al. Reference Desjardins, Hofmann and Fernald2012; Maguire et al. Reference Maguire, DeAngelis, Dijkstra, Jordan and Hofmann2021). Elevated testosterone in subordinate males may serve as an anticipatory mechanism in preparation of social ascent and future reproductive opportunities (Huffman et al. Reference Huffman, Mitchell, O’Connell and Hofmann2012; Maruska & Fernald Reference Maruska and Fernald2013). From a behavioural perspective, dominant males visited caves more frequently, showing a 68.91% increase in cave visits in the 3-cave compared to the 1-cave treatment (Figure 4[f]). Increased enrichment may have enhanced visual barriers and reduced attention toward subordinate males, thereby increasing subordinates’ perceived opportunities for social ascent and alleviating stress-related suppression of reproductive hormones. The reduced physiological differences between dominant and subordinate males with increasing cave number could hinder studies where distinct differences in behaviour and physiology between social states are required (Alward et al. Reference Alward, Hilliard, York and Fernald2019; Friesen et al. Reference Friesen, Maclaine and Hofmann2022; Maruska et al. Reference Maruska, Anselmo, King, Mobley, Ray and Wayne2022; Dijkstra et al. Reference Dijkstra, Fialkowski, Bush, Wong, Moore and Harvey2024) or where subordinate males need to exhibit social suppression of the reproductive axis, which is typically associated with low androgen levels (Maruska & Fernald Reference Maruska and Fernald2013).
Environmental enrichment is widely used to enhance the welfare of laboratory animals, with numerous studies demonstrating its benefits across various experimental settings (Simpson & Kelly Reference Simpson and Kelly2011; Zhang et al. Reference Zhang, Gao and Zhang2022). However, laboratories investigating status or rank-based behaviours may encounter variability in experimental outcomes due to the influence of enrichment on social dynamics. While our findings provide valuable insights, some limitations must be considered. In our experimental design, structural complexity was positively linked to structure size. The size of defendable structures may enhance resource holding potential and are preferentially occupied in some cichlid species (Dijkstra et al. Reference Dijkstra, van der Zee and Groothuis2008). In addition, we used halved terracotta pots as defendable structures; however, using different structures (such as PVC; Dijkstra et al. Reference Dijkstra, van der Zee and Groothuis2008; Näslund & Johnsson Reference Näslund and Johnsson2016) or altering the placement or orientation of defendable structures may yield varying results. Future research should examine how specific structural properties (complexity, size, and placement) shape aggression and welfare in cichlids as well as other social fish species.
Our findings suggest that enhancing enrichment by increasing the number of caves in a clumped manner has little to no positive effect on animal welfare in subordinate cichlid males. This is an important contribution as we were able to isolate the effect of altering the complexity of a clumped structure that could only be defended by one dominant cichlid male. Furthermore, our findings suggest that increasing environmental complexity may reduce physiological differences between dominant and subordinate individuals. Whether these status-specific profiles are desirable or not depends on the goal of the study, but it needs to be taken into account when developing enrichment strategies for laboratory animal species.
Animal welfare implications
Environmental enrichment is widely used to improve animal welfare, yet its effects can be context-dependent, particularly in socially hierarchical species where lower-ranked, subordinate individuals are often the target of territorial aggression. Our findings indicate that increased structural complexity of a defendable structure did not measurably improve or compromise animal welfare of subordinate Astatotilapia burtoni in terms of growth rate or fin split frequency. However, increased enrichment complexity may reduce physiological differentiation between dominant and subordinate males. Although such reduced differentiation may reflect decreased social stress for subordinates, it may also weaken the social distinctions that the experimental paradigm is designed to produce.
While enrichment complexity did not have strong direct effects on standard welfare measures, its capacity to alter social dynamics highlights the importance of interpreting welfare outcomes within an appropriate ecological and behavioural context. Therefore, welfare assessments and enrichment strategies in laboratory settings should be carefully designed with consideration of species-specific social systems, as enrichment can subtly influence social stress, social stability, and overall well-being rather than producing uniformly positive effects.
Supplementary material
The supplementary material for this article can be found at http://doi.org/10.1017/awf.2026.10110.
Acknowledgements
We thank the members of the Dijkstra Lab for their assistance with the experiment and data collection. This research was supported by grants from the American Association for Laboratory Animal Science (Grants for Laboratory Animal Science) to PD and JK, the National Institute of General Medical Sciences (NIGMS, R15GM150286 to PD), and the National Science Foundation (grant number 2444902 to PD).
Competing interest
None.





 Open access

