Introduction
In the last ten years, Novosibirsk archaeologists discovered early Neolithic sites with unique flat-bottomed ceramics that belongs to the Early Neolithic Baraba culture existed in the Baraba forest-steppe region of southwestern Siberia (Molodin et al. Reference Molodin, Hansen, Myl’nikova, Reinhold, Nenachov, Nesterova and Durakov2017, Reference Molodin, Mylnikova, Nesterova, Kobeleva and Selin2022).
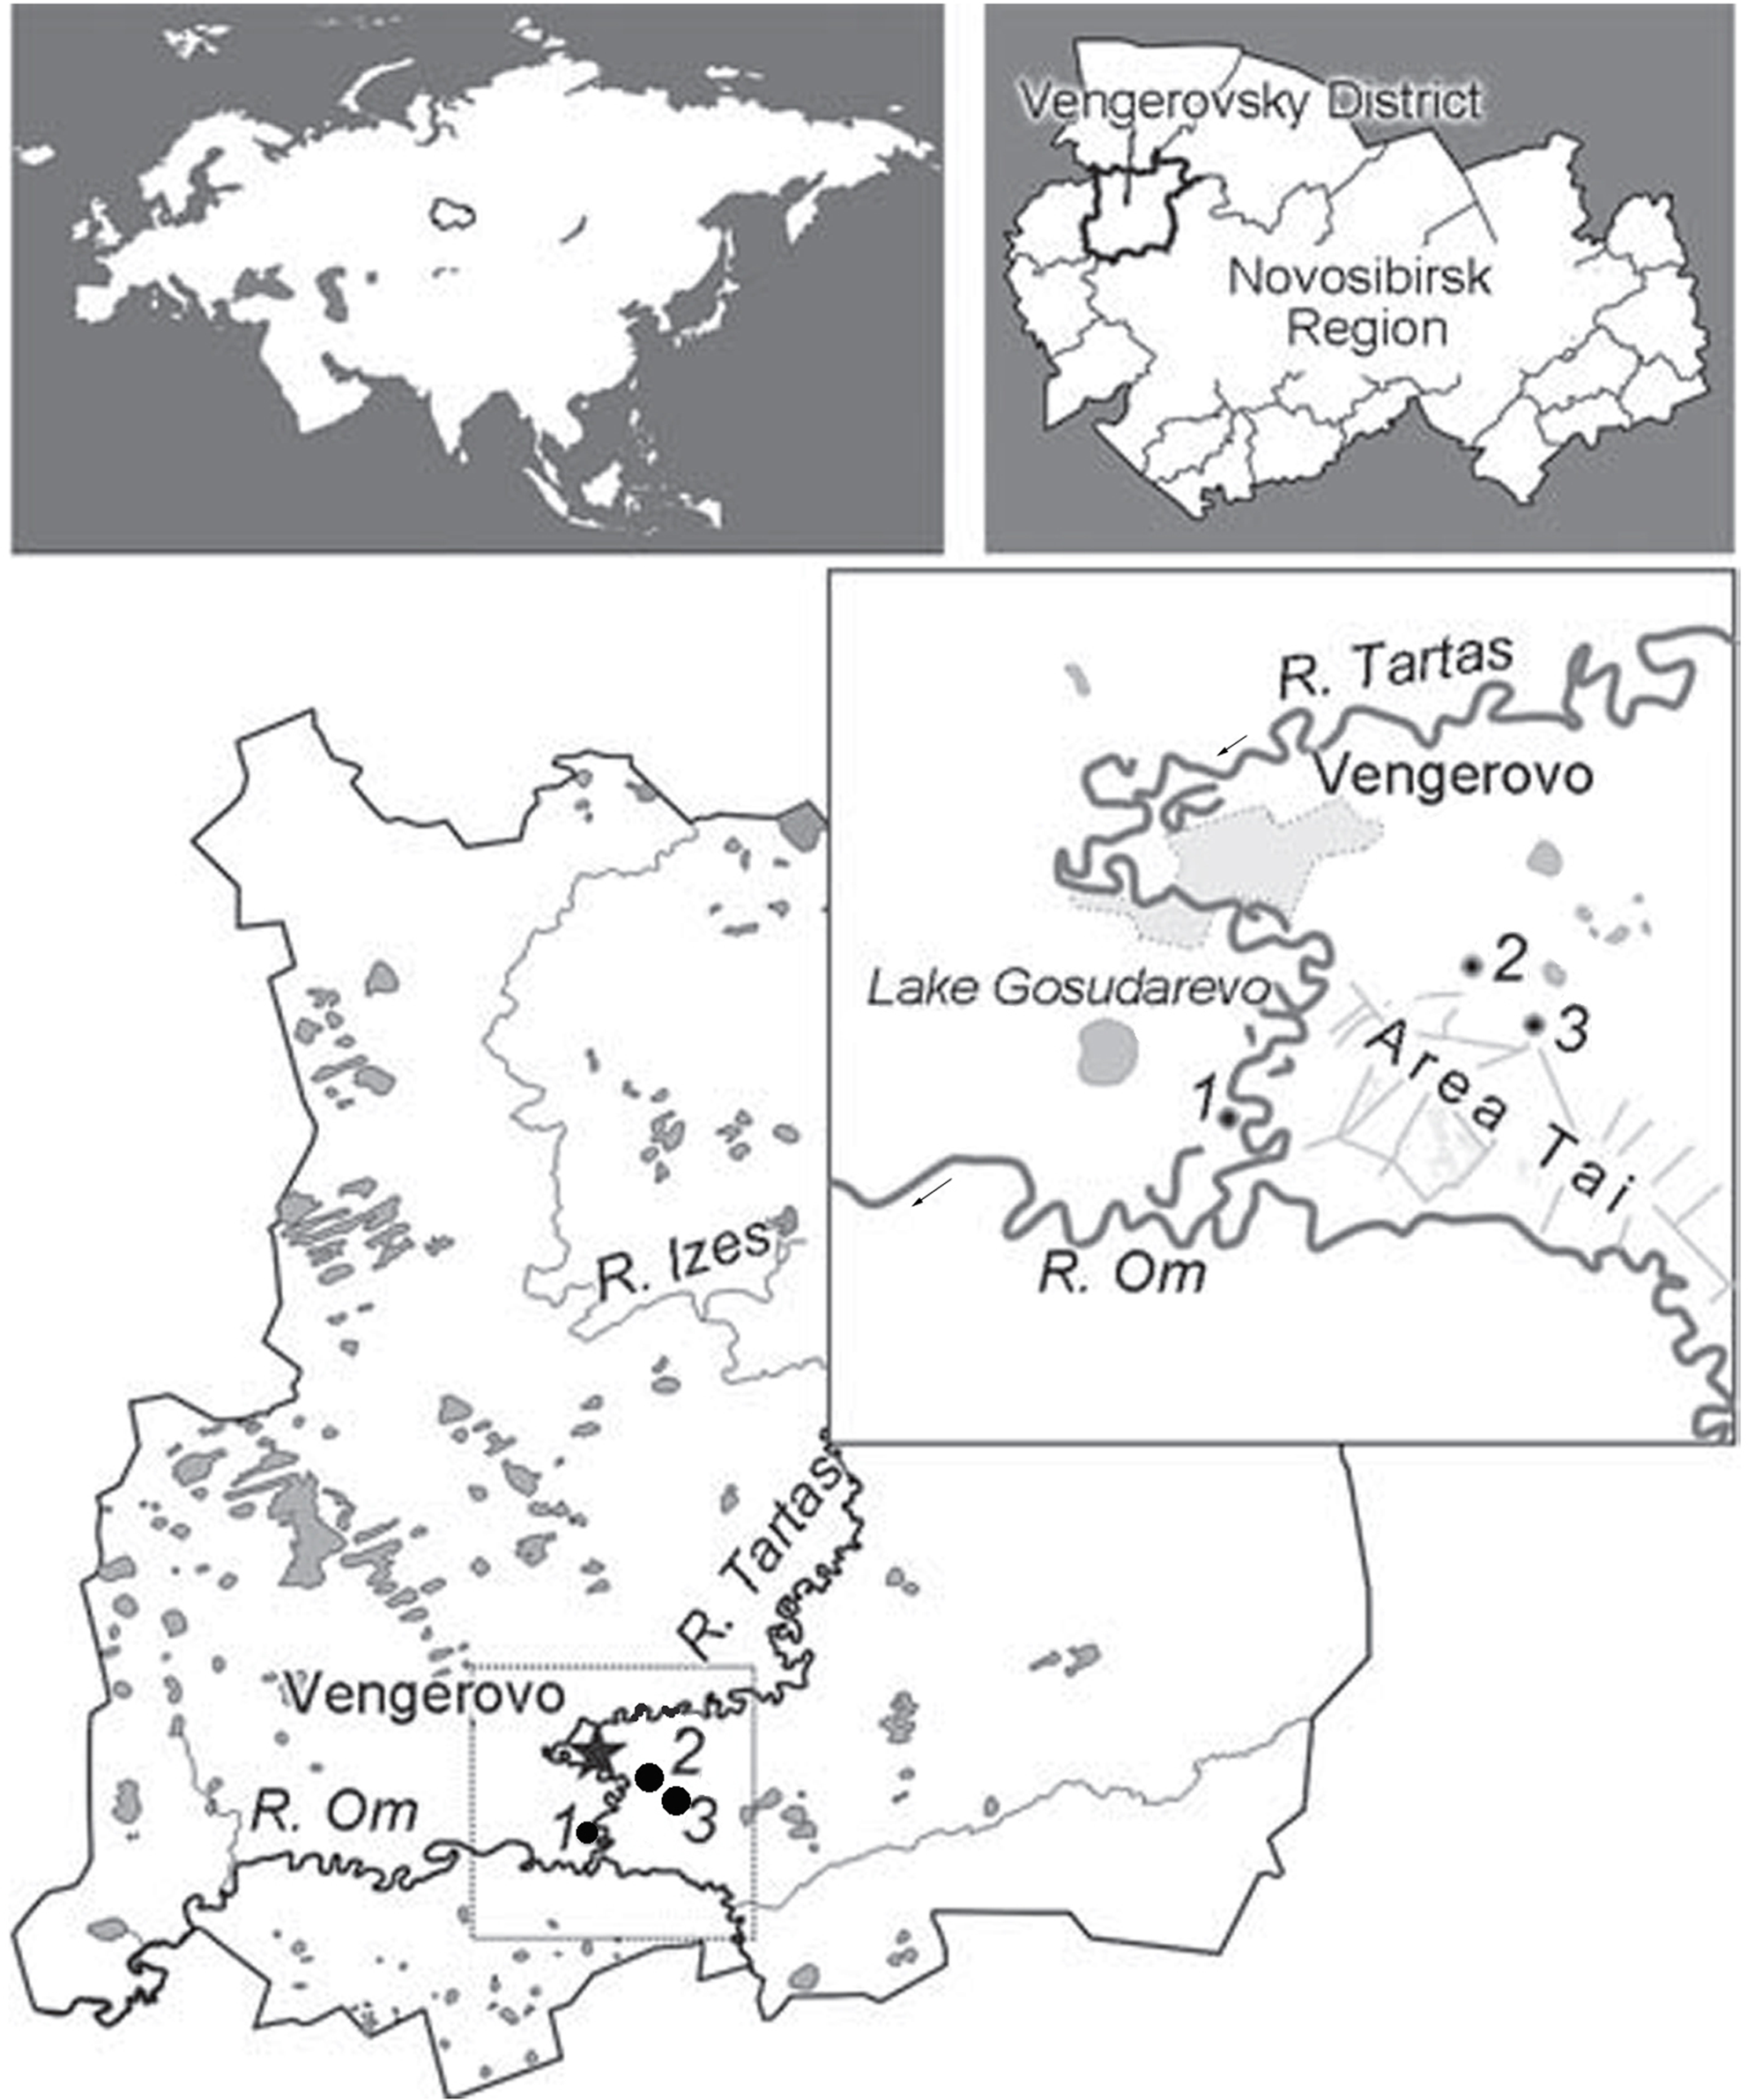
To date, five archaeological sites with the material complex of the Early Neolithic Baraba culture have been discovered and studied: Vengerovo-2, Autodrom-2, Tartas-1, Ust-Tartas mounds, Old Tartas-1 (the last one discovered in 2023) (Figure 1). Material representing the culture comes from temporary dwellings related to the extraction, processing of fish and preparation for storage, hardware postholes for fish storage, and cult offering (Myl’nikova, Reference Myl’nikova2017; Molodin et al., Reference Molodin, Mylnikova, Nesterova, Kobeleva and Selin2022; Reinhold et al. Reference Reinhold, Eger, Kobeleva, Molodin and Mylnikova2021). The peculiarity of the Baraba culture is its unique material complex including specific flat-bottomed pottery and other distinguishing artifacts. Ceramics play the role of a culturally determining factor in the process of neolithization. Therefore, analysis of the time of appearance in the region, possible routes of appearance, and the speed of spread throughout the region can address the question about the features of neolithization of a particular territory. In our case, the ceramics of the Baraba culture today are the earliest found in Western Siberia. Their analysis (dating, technical and technological characteristics) will make it possible to compare ceramic complexes from other regions of Western Siberia and will help to resolve the problem of the local or recent development of pottery. The Baraba forest-steppe is a region not associated with the origin of agriculture and the ceramic complexes here date to a relatively early time. This is also important, since it suggests a different formulation of the meaning of the emergence of pottery among a given population. The presence of flat-bottomed ceramics at the monuments of the Baraba culture obviously marks a unique line of development of pottery technology. The flat-bottomed ceramic dishes of the Baraba culture were created with the technique of making ordered patchwork, using cord laying when forming the rim, with the presence of a bottom roller as a result of molding the lower part of the dish. Various items made of bone, which was used to make tools, weapons and jewelry were also found at the sites of the Baraba culture. The stone industry at the sites is characterized as lamellar with a high importance of insert technology.
Location of early Neolithic sites: 1—Tartas-1 (55º 38′ 6.25″ and 76º44′ 15.26″), 2—Vengerovo-2 (55º40′ 34.09″ and 76º47′ 01.16″), 3—Ust-Tartas-1 mounds (55º 39′ 40.5″ and 76º49′ 16.2″). Coordinates were obtained by GPS in WGS-84 coordinate system.

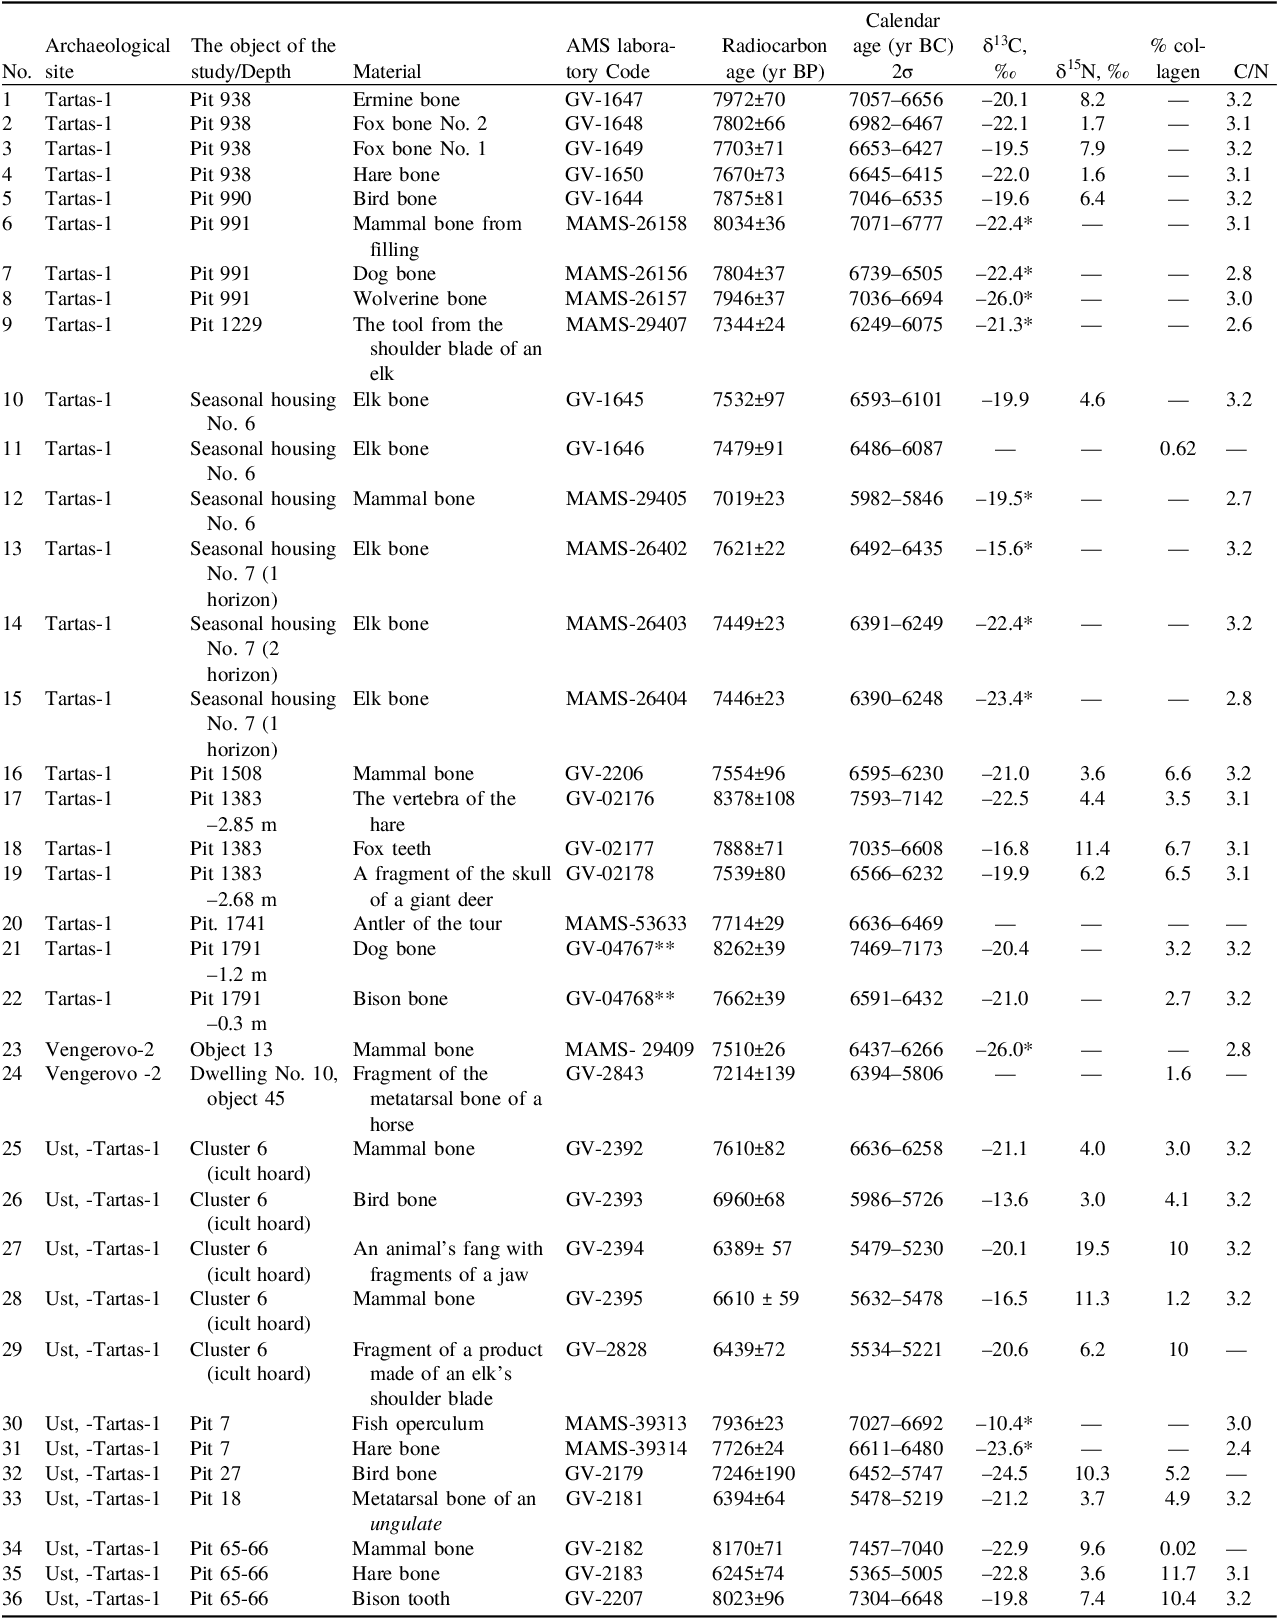
To characterize the chronology of the Early Neolithic Baraba culture, a set of 36 samples from the sites Tartas-1, Vengerovo-2, Ust-Tartas mounds (Figure 1) was collected by Novosibirsk archaeologists and further subjected to radiocarbon dating with AMS with involvement of statistical methods for processing the results. The AMS measurements were carried out at the Curt-Engelhorn-Center Archaeometry, Mannheim, Germany (CEZA, lab code MAMS) and at the AMS Golden Valley (lab code GV) using the AMS of the Budker Institute of Nuclear Physics (BINP) SB RAS (Russia) (22 dates) and the MICADAS-28 (2 dates: GV-4767, GV-4768) (Table 1). All radiocarbon dates were characterized by Bayesian chronological models (Bronk Ramsey Reference Bronk Ramsey2009) with kernel density estimation models (KDE) (Bronk Ramsey, Reference Bronk Ramsey2017) and Bayesian analysis of covariance/analysis of variance (ANCOVA/ANOVA) (Quintana and Williams Reference Quintana and Williams2018) to suggest characteristic chronology features of the Early Neolithic Baraba culture.
Radiocarbon and calendar dates for Baraba culture artifacts

* Determined by AMS in CEZA.
** Samples were collected by Molodin V.I., Nenakhova Yu.N., Kobeleva L.S., Selin D.V., and Mylnikova L.N. and dated at AMS Golden Valley in 2024.
Material and methods
A total of 36 samples were dated: 32 mammal bones, 3 bird bones, and 1 fish operculum. The procedure for 24 bone samples (with lab code GV-), measured in AMS Golden Valley, was the following. The samples were washed with distilled water 7 times, dried, and ground on a Freezer/Mill cryogenic homogenizer to obtain 1.5 g of powder. The samples were subjected to extraction with dichloromethane at room temperature on an ASE350 (Accelerated Solvent Extractor – Dionex Corporation) and dried at 70°C. The powders were poured with 1 M HCl and kept at room temperature (pH about 1–1.5) for 2 days. After this, the precipitate was separated from the solution by centrifugation and washed with distilled water to pH = 7. Collagen was purified with a solution of 0.1 M NaOH for 20 min until a colorless solution appeared, then the precipitate was washed with distilled water to pH = 7. The precipitate was again treated with a 1 M HCl solution for 20 min. then washed with distilled water until a suspension with pH = 3 was obtained. Collagen solutions were dried in a Freezone freeze dryer to obtain collagen powder. At the beginning of the GV-laboratory’s work, the collagen content in the bone was not determined (up to 2000 samples); later a procedure was introduced for weighing the resulting collagen and recording its content. Of the 18 bone samples with known collagen content, only two samples (GV-1646, GV-2182) showed low collagen yield, below 1% (Table 1), due to poor tissue preservation (Van Klinken and Hedges, Reference Van Klinken and Hedges1998). Due to the lack of data on the chemical composition of collagen, these samples were not taken into account in the main statistical analyses. However, analysis for the entire set of results is presented in the Supporting Material. Some of the collagen samples were analyzed for isotopic shifts (δ13C, δ15N) by the Delta-V-Advantage and to C/N determination by the elemental analyzer Flash-2000 (Table 1). The data on C/N ratios were assessed by two-way Bayesian mix-design ANCOVA, accounting for a possible impact of the 8.2k event on prevalence of low C/N ratios with a help of the primary simple between-group factor “8-2K” and for any between-facility differences (CEZA and AMS GV) via the independent covariate “FACILITY”. ANCOVA results were validated by the two-tailed Fischer exact test with Odds ratios (OR) and CI95 intervals for OR calculated.
Graphitization of the collagen was carried out by an absorption-catalytic setup (ACS) that included the stages of combustion, sorption of carbon dioxide on a selective sorbent, desorption, and catalytic reduction of CO2 with hydrogen (Lysikov et al. Reference Lysikov, Kalinkin, Sashkina, Okunev, Parkhomchuk, Rastigeev, Parkhomchuk, Kuleshov, Vorobyeva and Dralyuk2018). After the process was completed, 2 mg of the powder was pressed into targets and sent for analysis to the BINP SB RAS AMS. Prior to the registration of the laboratory AMS Golden Valley with Radiocarbon in 2020, there were preliminary laboratory codes for the samples: NSKA-, LRMA-, BINP-NSU- that may be met in earlier publications, which were then changed to GV with the same numbering, for example, the sample GV-2176 was previously designated as NSKA-02176 and so on. Collagen of two samples GV-4767 and GV-4768 was graphitized with an AGE-3, followed by powder pressing into targets for MICADAS-28.
The following is known about the preparation procedure for 12 bone samples (with lab code MAMS-), measured at CEZA: the collagen was extracted from the bones and the >30kD fraction was separated with ultrafiltration, this fraction was freeze-dried and burned to CO2 in an elemental analyzer, the resulting CO2 was catalytically reduced to graphite and δ13C was determined by AMS (Kromer et al. Reference Kromer, Lindauer, Synal and Wacker2013).
All radiocarbon dates’ calibrations and modeling were performed using OxCAL 4.4.4 with the IntCal20 calibration curve (Reimer et al. Reference Reimer, Austin, Bard, Bayliss, Blackwell, Bronk Ramsey, Butzin, Cheng, Edwards, Friedrich, Grootes, Guilderson, Hajdas, Heaton, Hogg, Hughen, Kromer, Manning, Muscheler, Palmer, Pearson, van der Plicht, Reimer, Richards, Scott, Southon, Turney, Wacker, Adolphi, Büntgen, Capano, Fahrni, Fogtmann-Schulz, Friedrich, Köhler, Kudsk, Miyake, Olsen, Reinig, Sakamoto, Sookdeo and Talamo2020). Possible timespans for findings derived from the Tartas-1 (T), Ust-Tartas mounds (UT), and Vengerovo-2 (V) archaeological sites were assessed by Bayesian chronology models with 95.4% boundaries (Ramsey Reference Bronk Ramsey2009). Underlying distributions of calibrated events were assessed with KDE models (Ramsey Bronk Ramsey, Reference Bronk Ramsey2017). All models ran without limiting the range of possible calendric solutions. Primary modeling was performed using only dates with C/N=2.9–3.6 ratios (DeNiro and Epstein, Reference DeNiro and Epstein1977; Guiry and Szpak, Reference Guiry and Szpak2021). Sensitivity analysis (Crema, Reference Crema2022) was performed using all radiocarbon dates, including/excluding ones with unknown or too-low ratios.
Additionally, data on median calendar ages of individual findings from the sites were analyzed by Bayesian and traditional one-way ANOVA, accounting for possible differences between Tartas-1, Vengerovo-2, and Ust-Tartas with a help of the simple between-group factor “SITES”, which was followed by Bayesian and traditional two-way mix-design ANCOVA to assess and control for any impact of the “FACILITY” covariate (van Doorn et al. Reference van Doorn, van den Bergh, Böhm, Dablander, Derks, Draws, Etz, Evans, Gronau, Haaf, Hinne, Kucharský, Ly, Marsman, Matzke, Gupta, Sarafoglou, Stefan, Voelkel and Wagenmakers2021). The statistical comparison of the between-group differences was performed both by the Fisher LSD post-hoc test and by BF10 Bayesian factors, with partial-eta squared effect size estimations (
 $\eta _p^2$
) calculated for ANOVA/ANCOVA factors. False-discovery (false-positive) rate corrections for multiple comparisons were made when appropriate. The results were considered significant with a probability level <0.05 and B10 levels >3.3 or <0.33.
Results and discussion
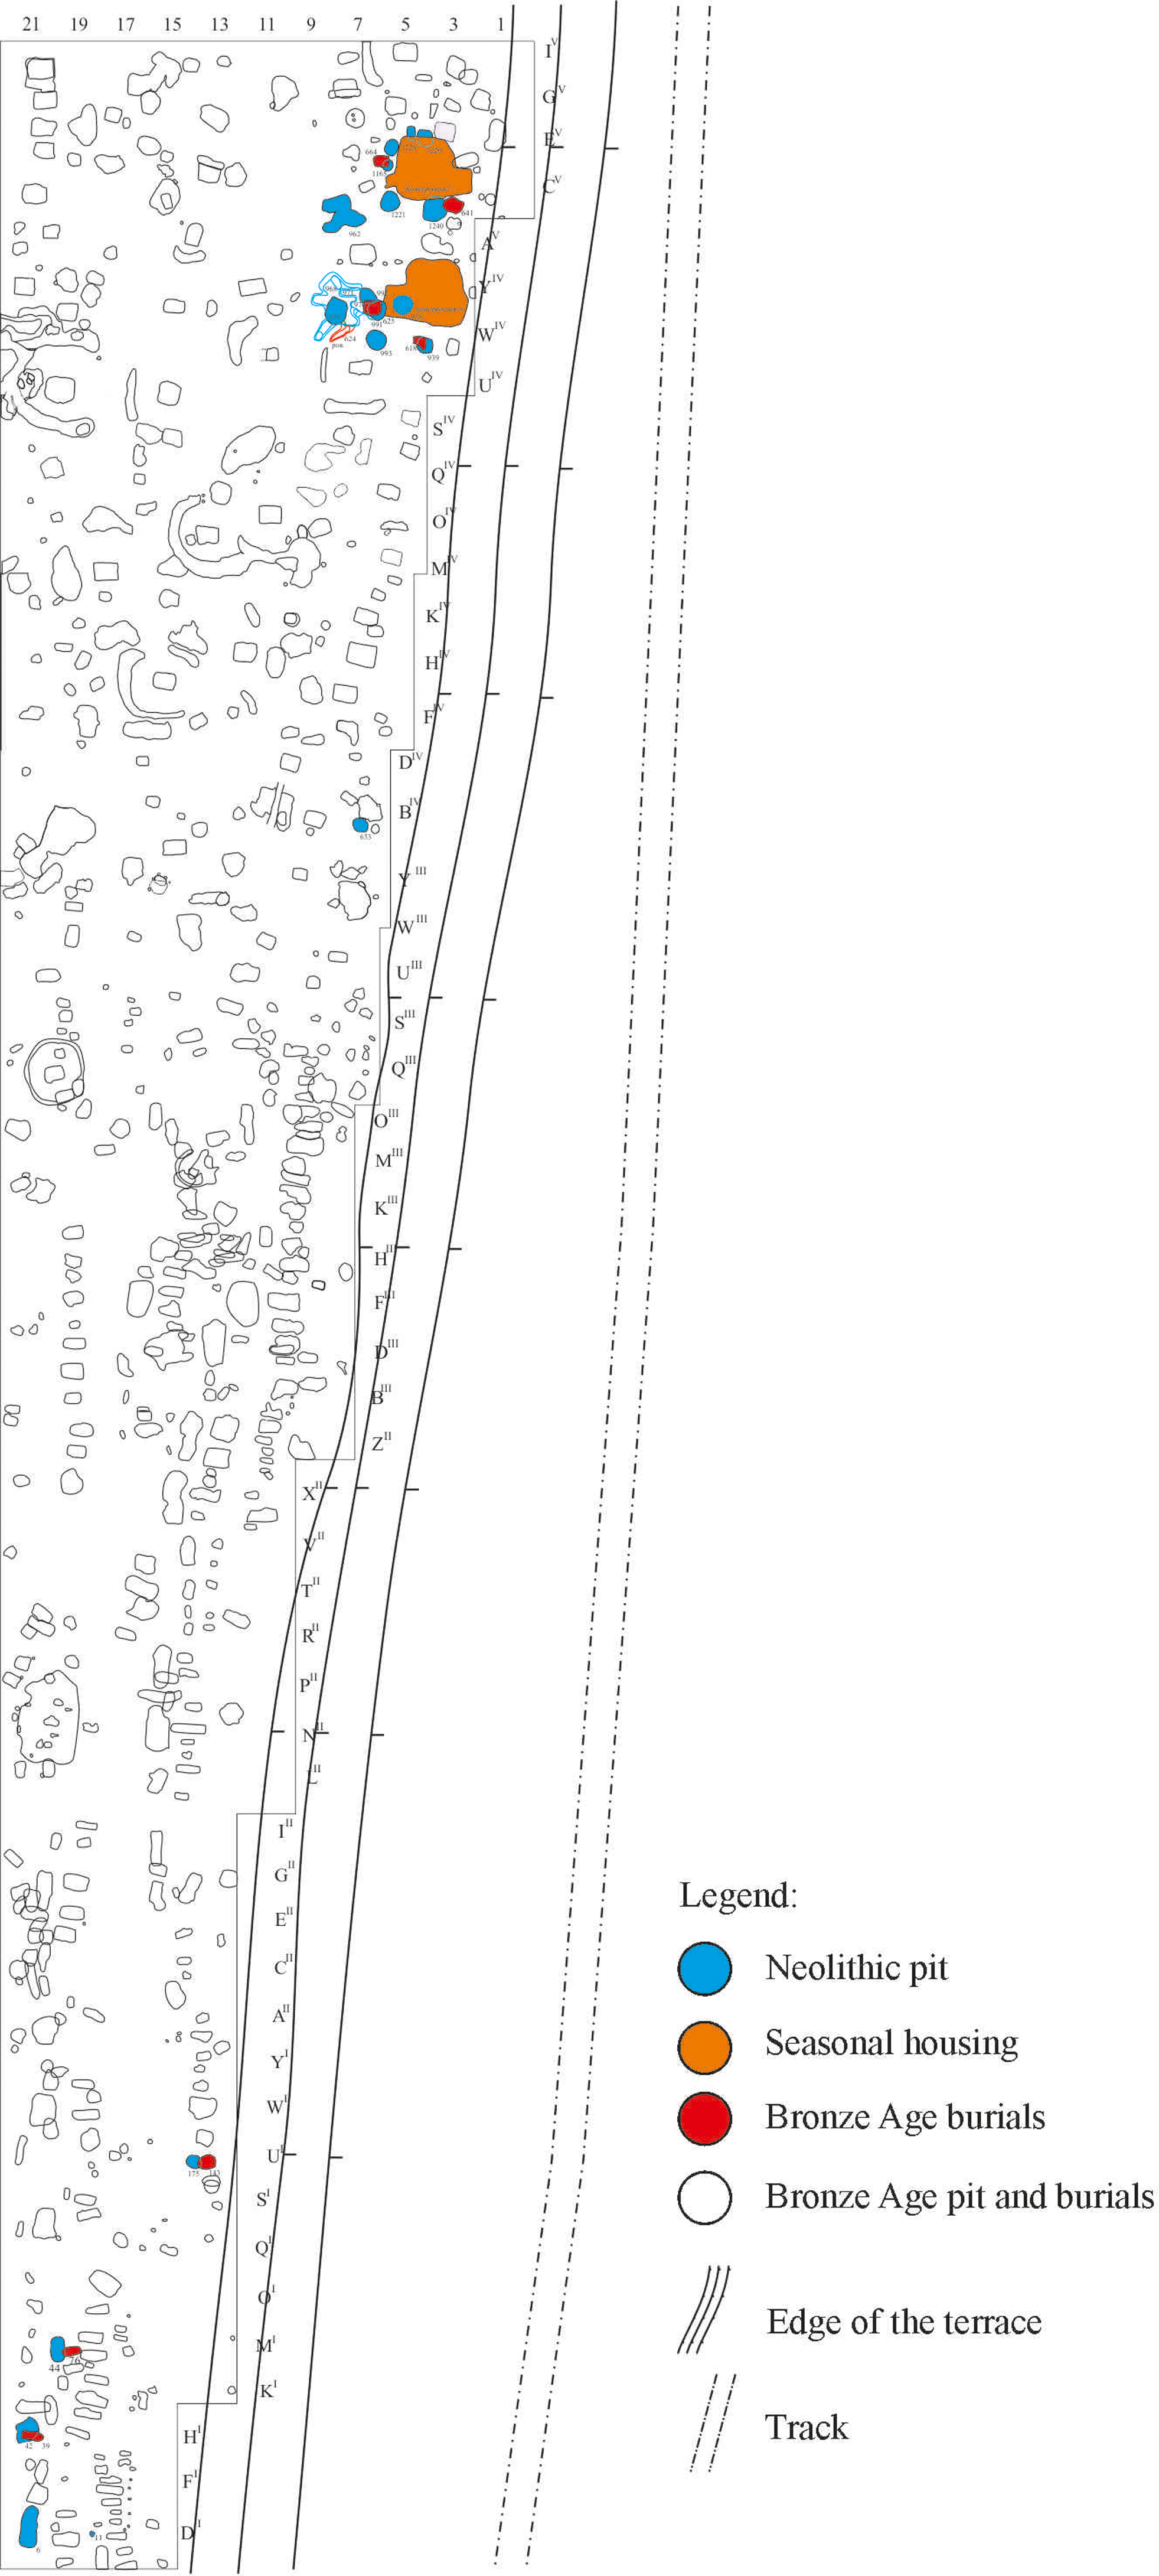
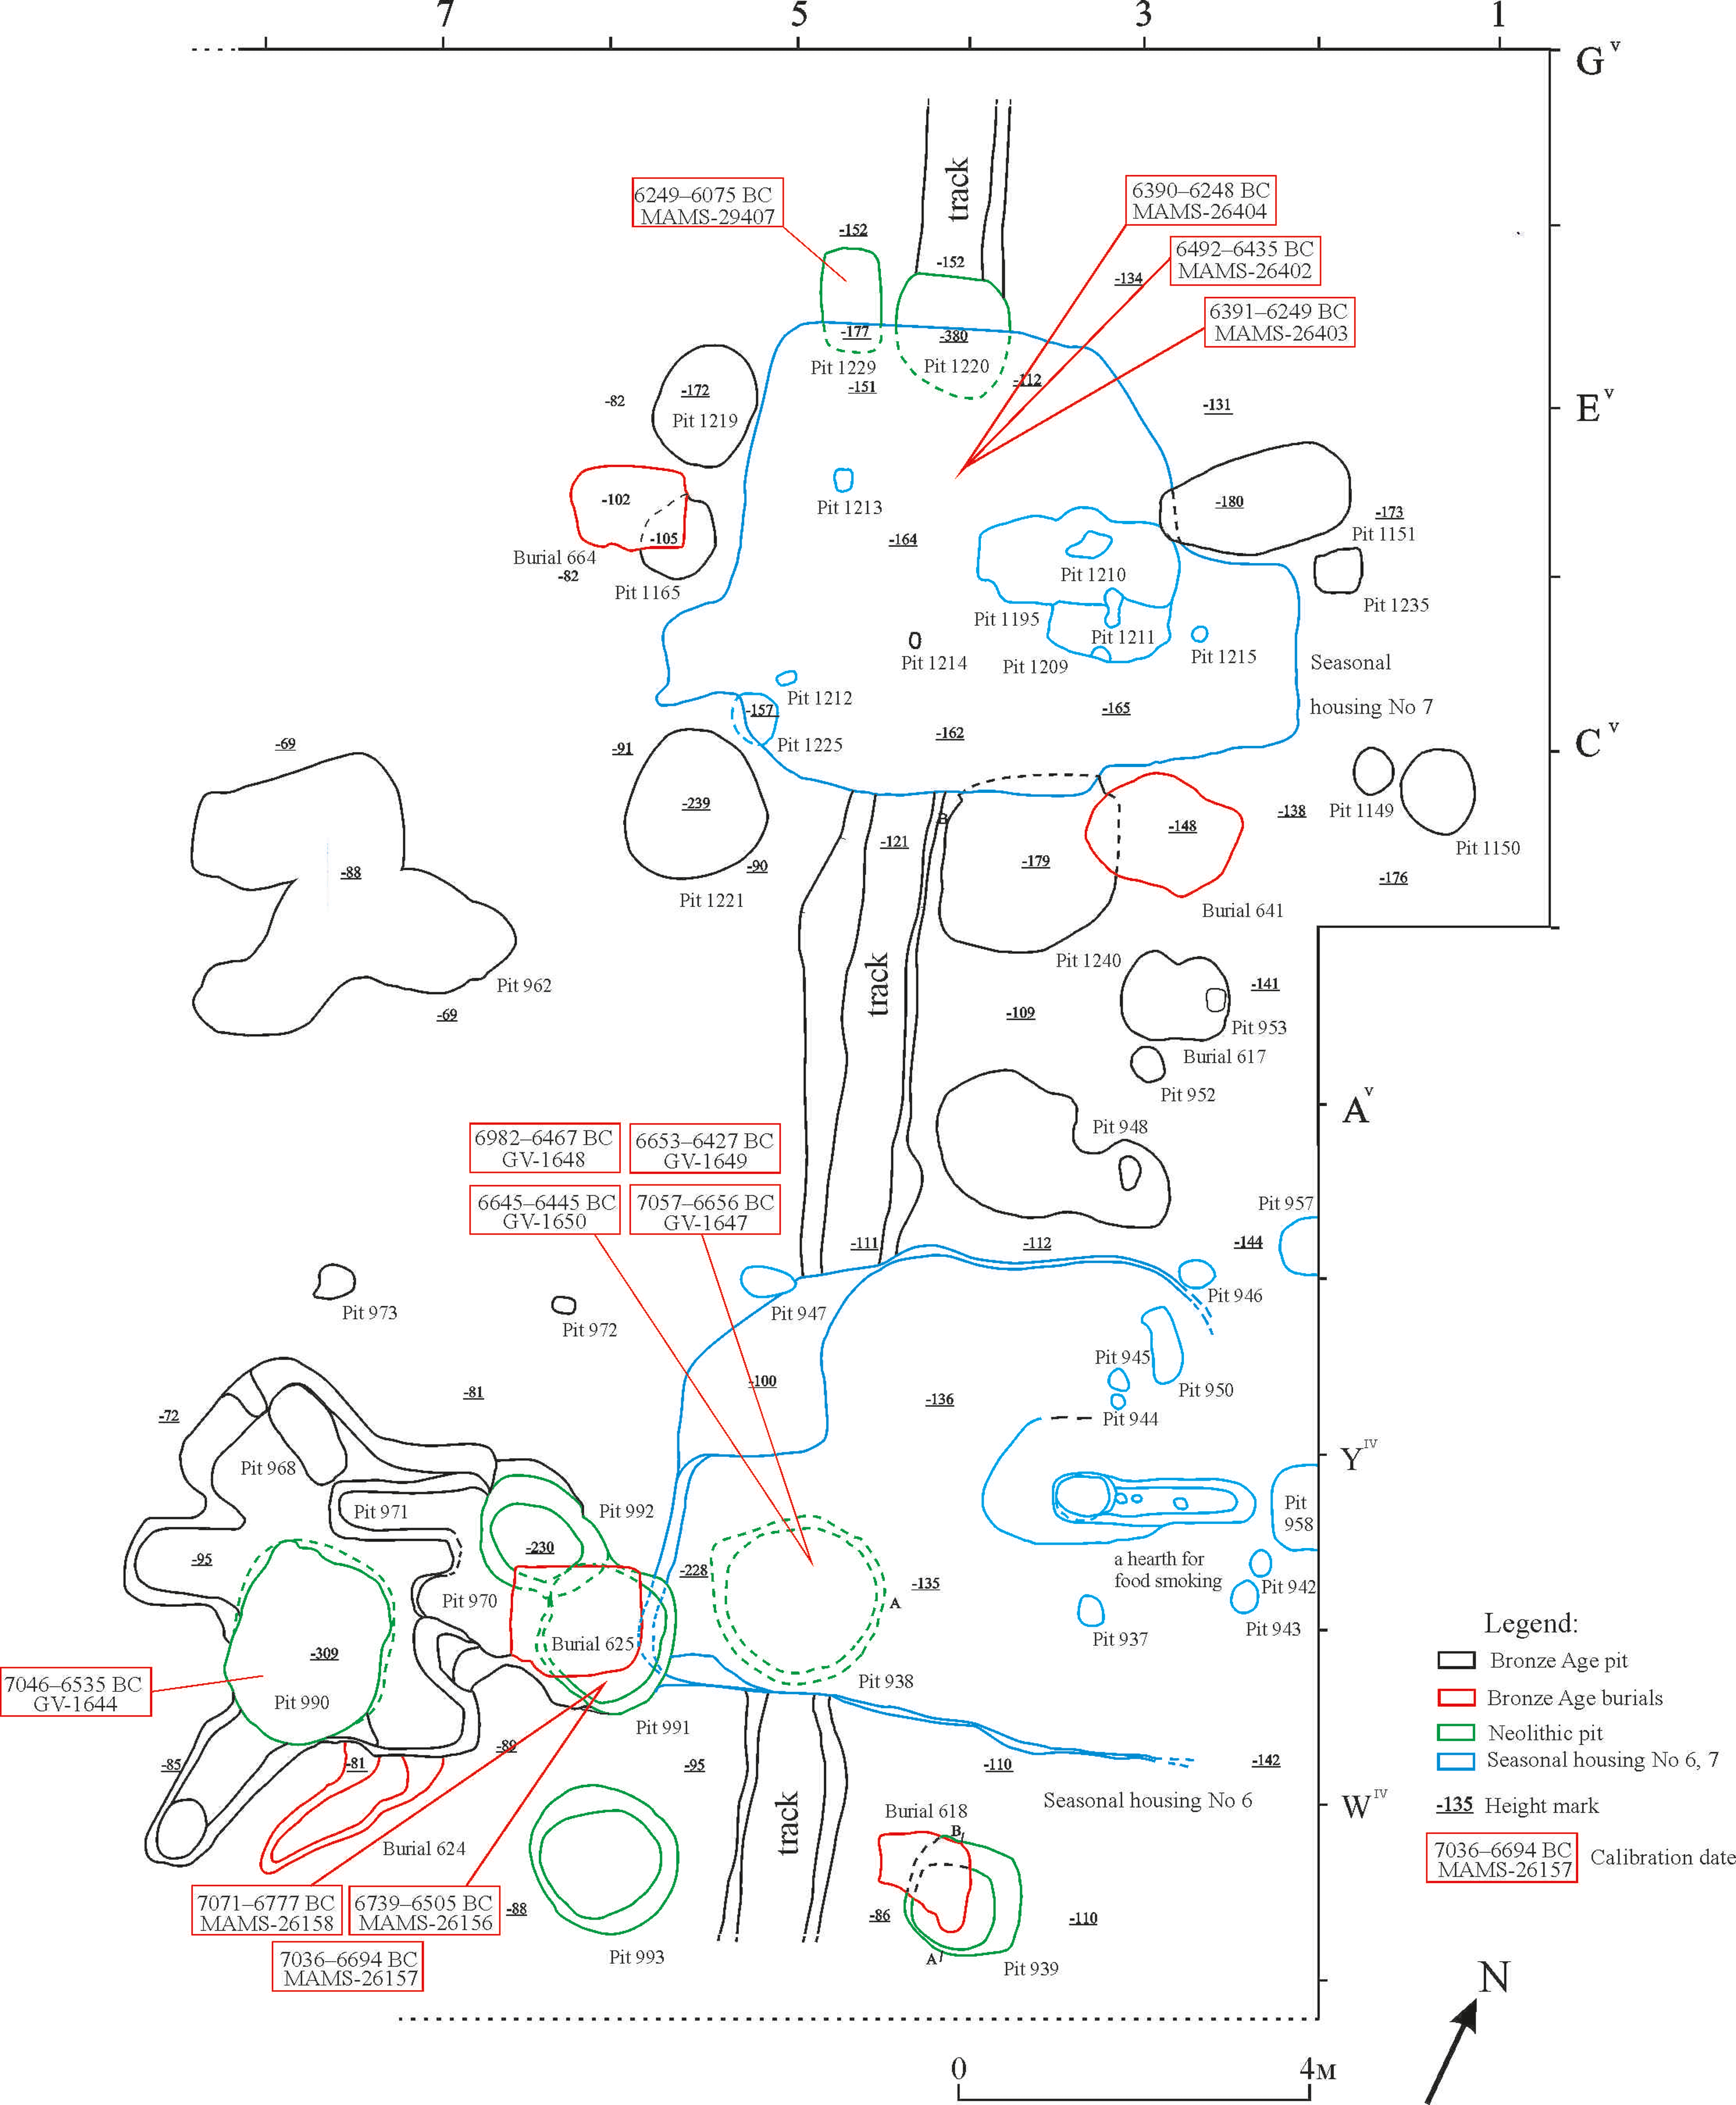
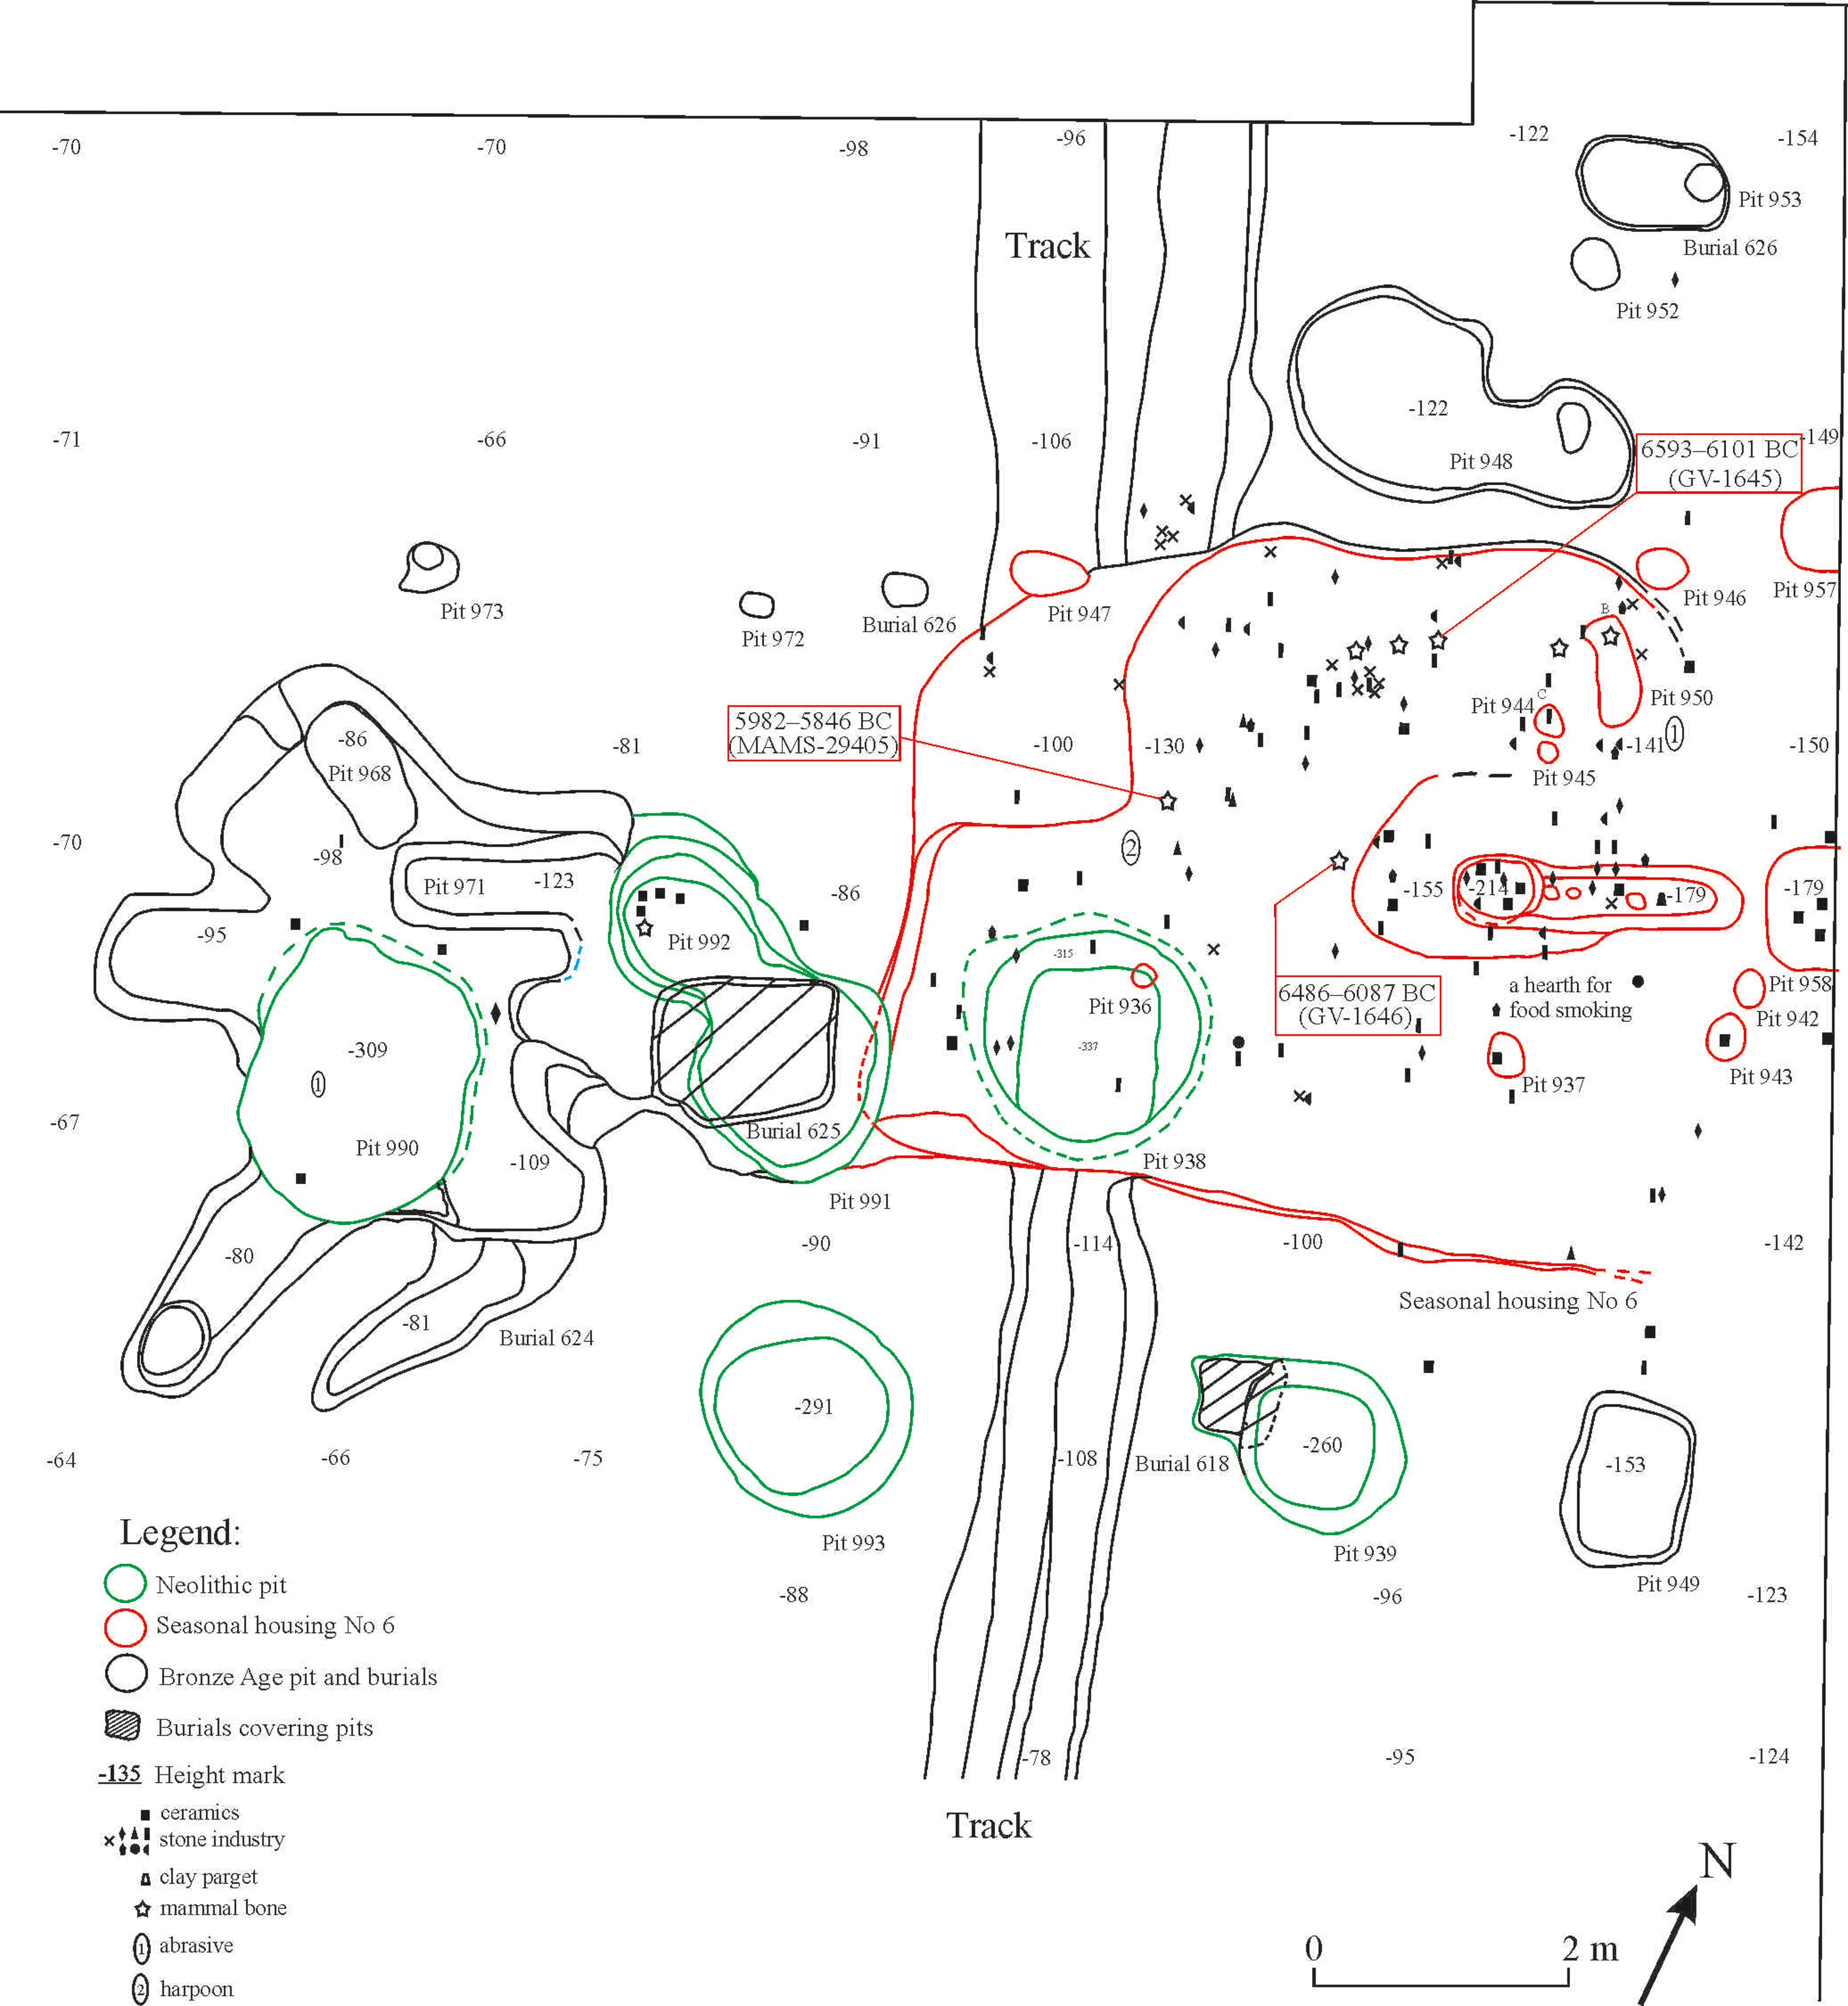
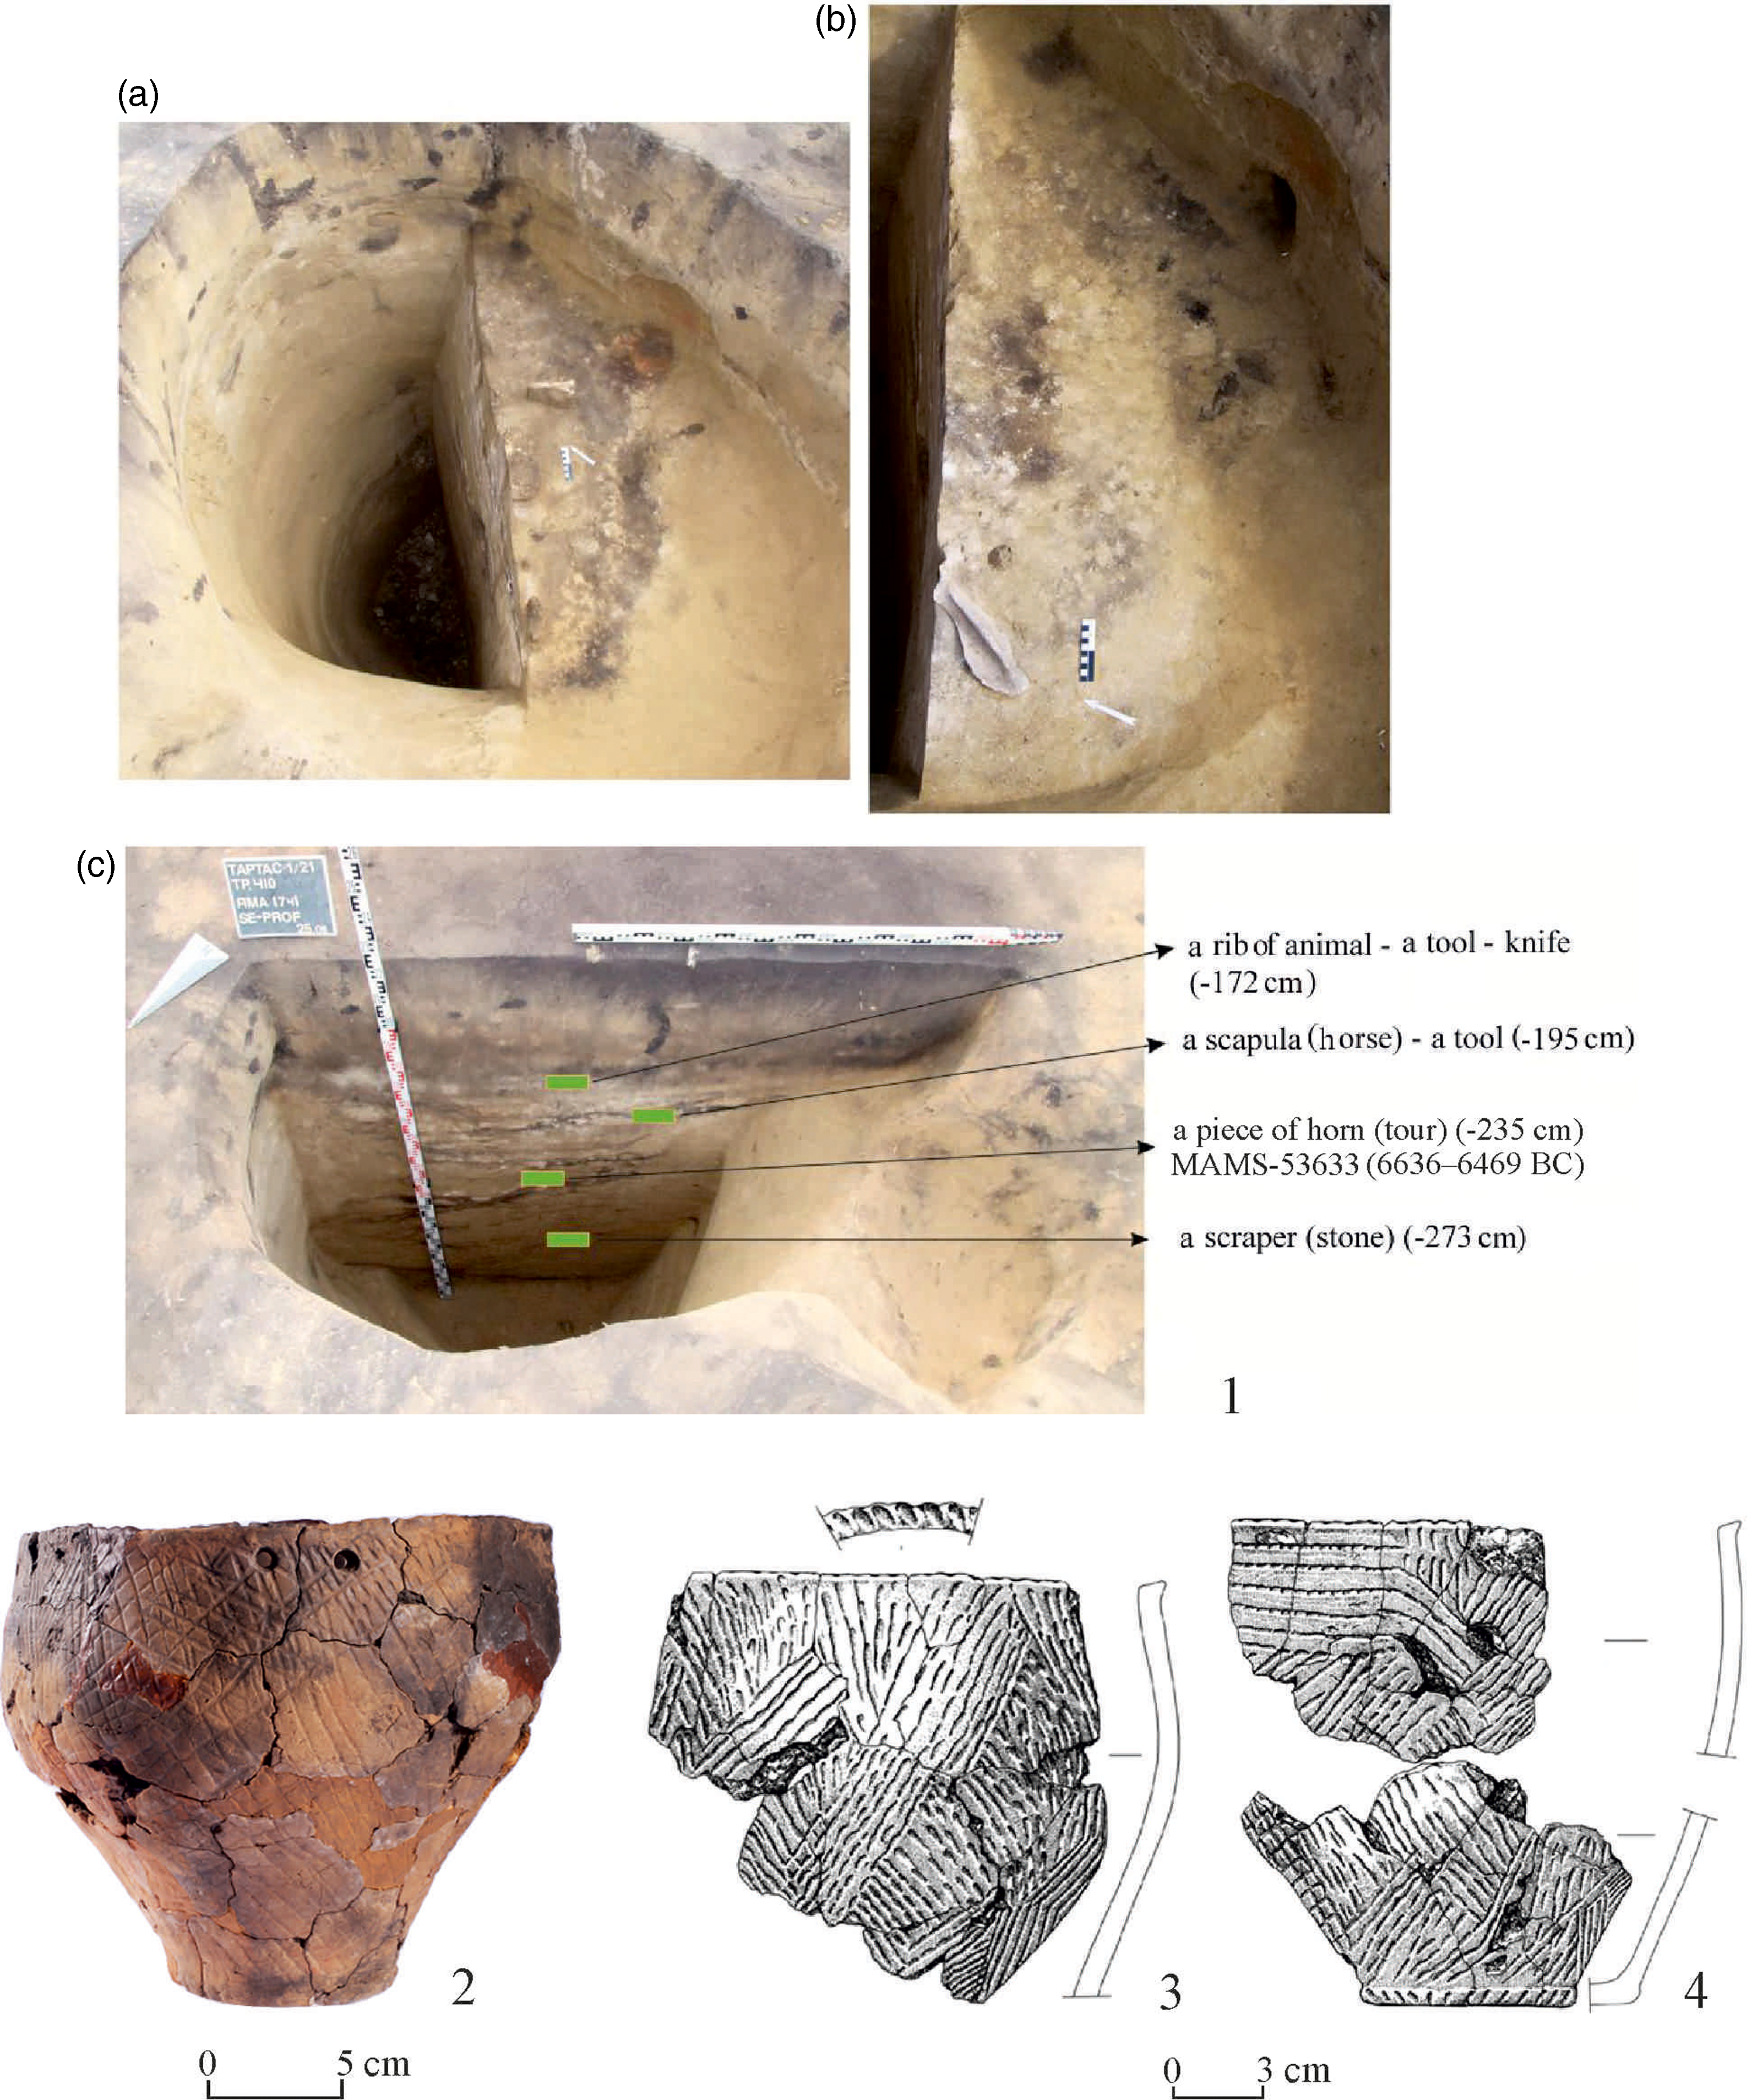
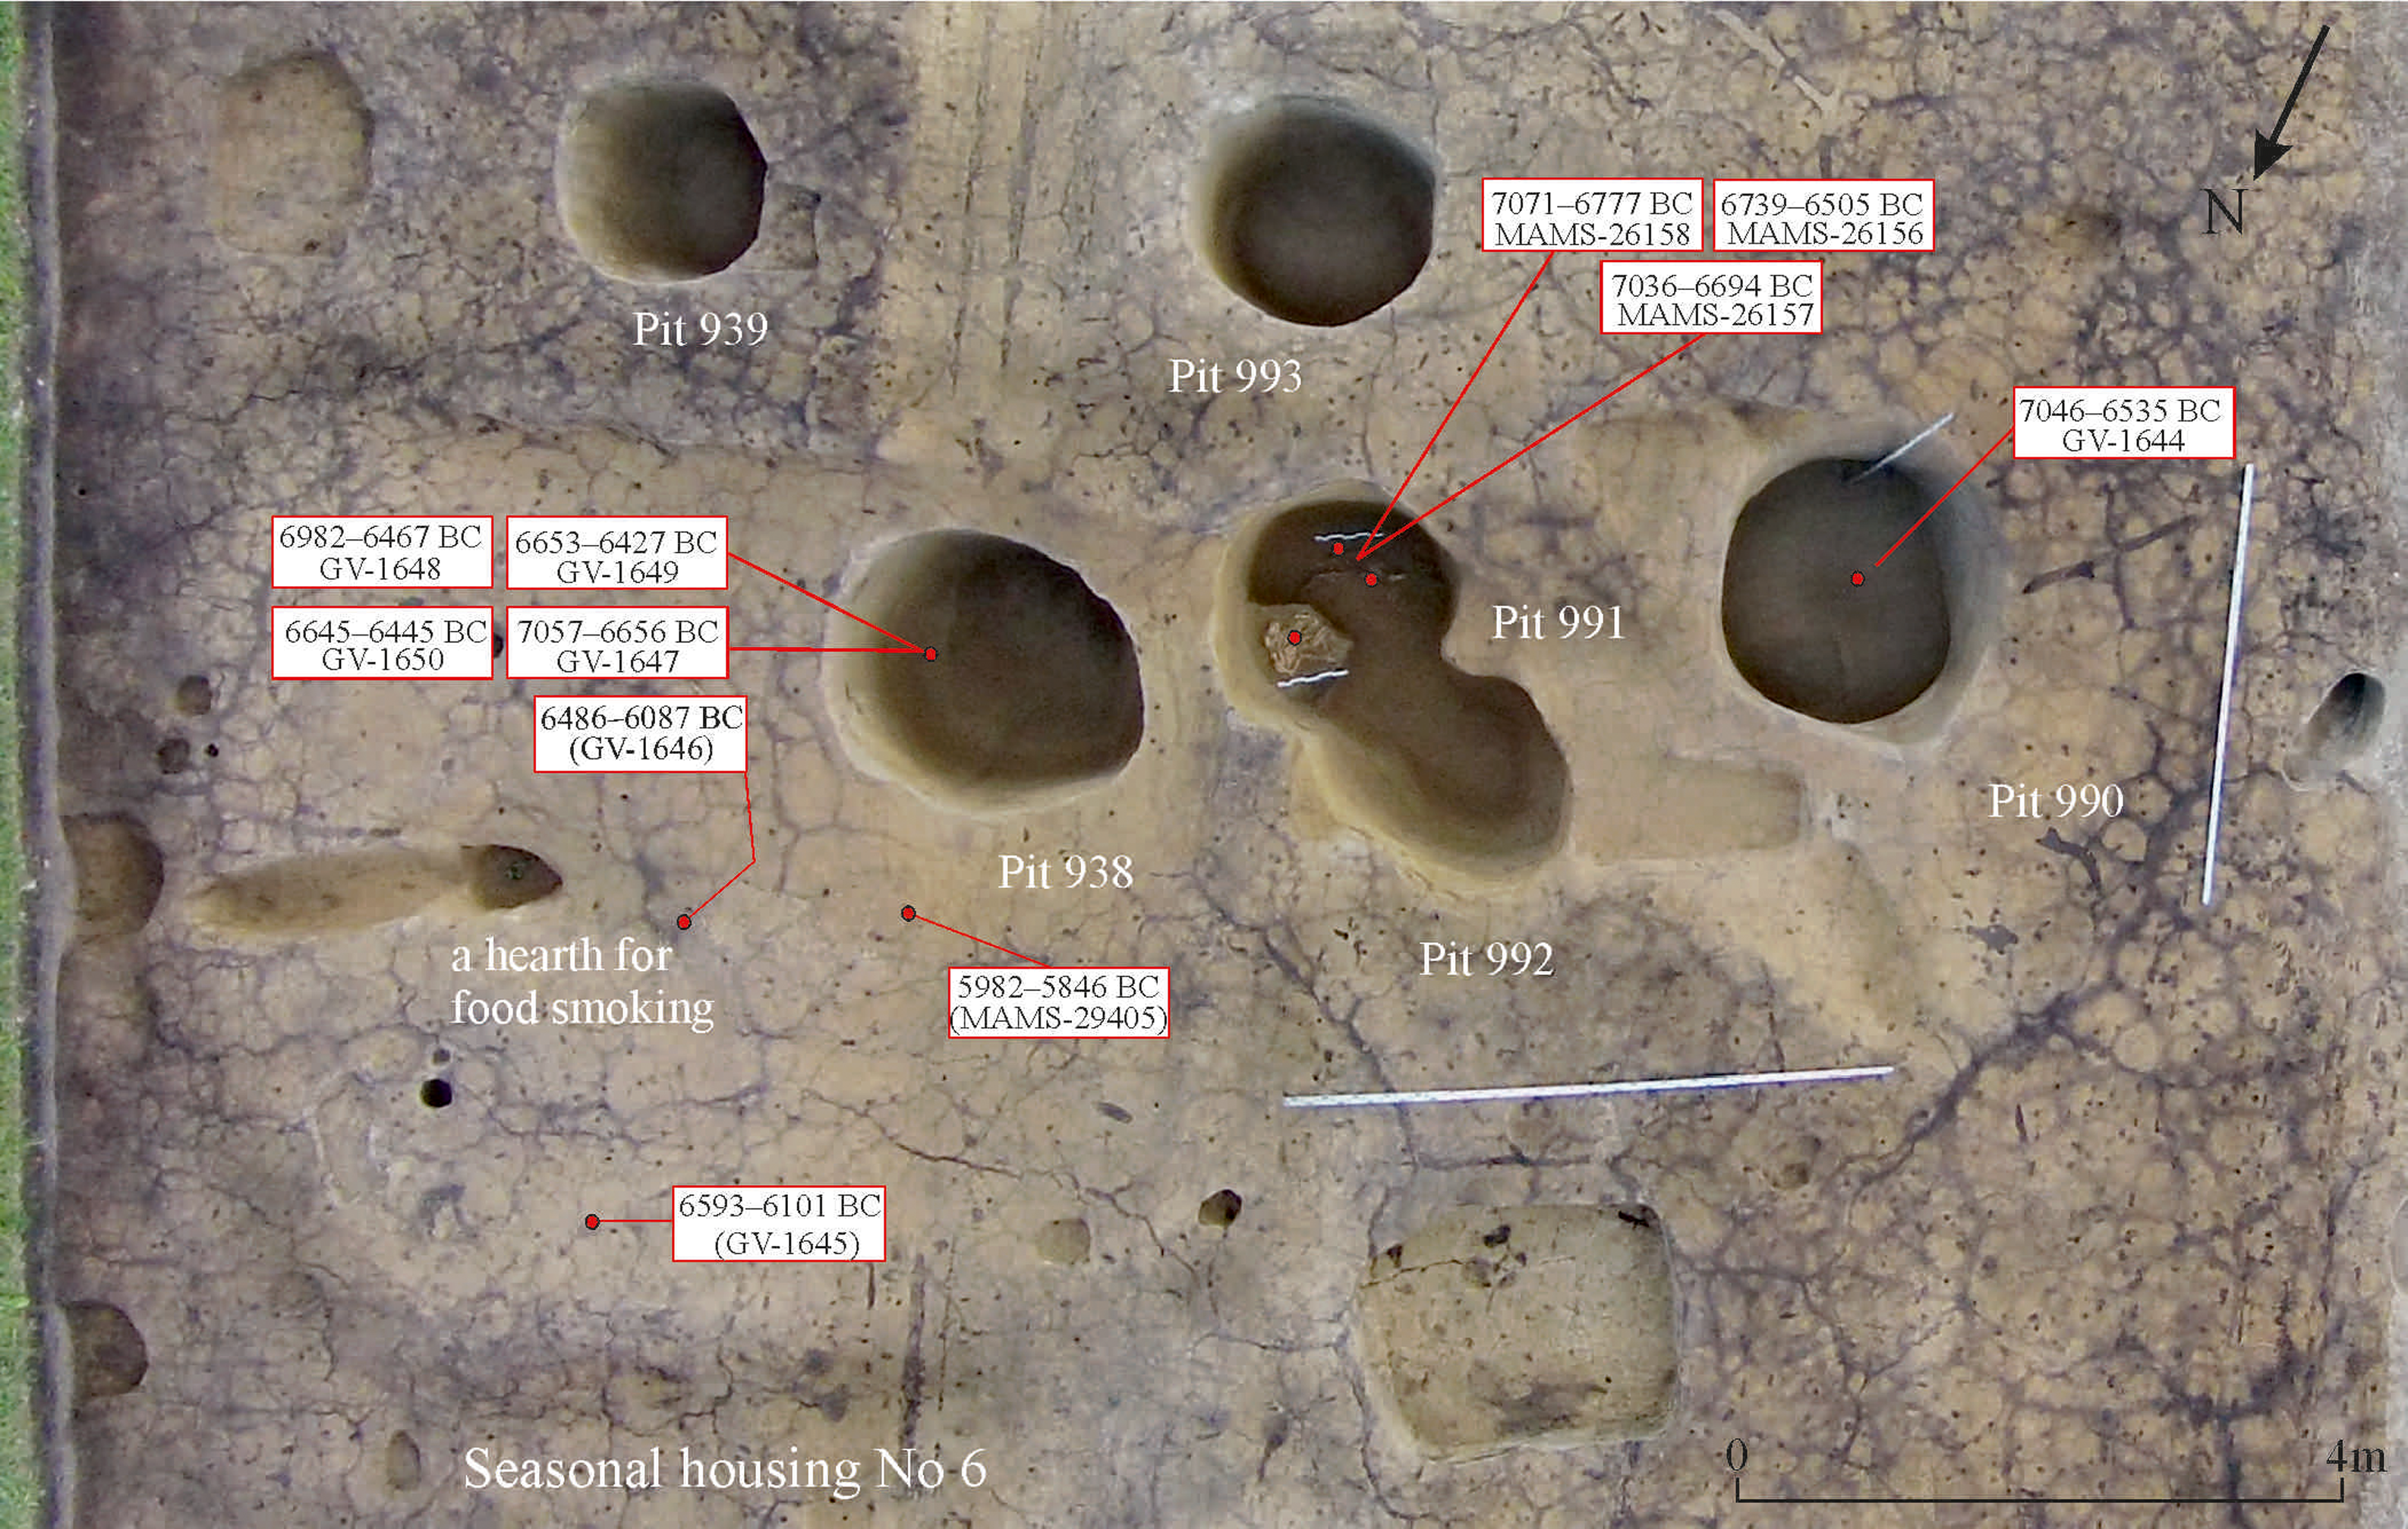
In the eastern part of Tartas-1, the Bronze Age burial ground with several Neolithic settlement features, including dwellings and a system of pits, were among the most remarkable recoveries of 2015 (Figure 2). The features occupy an area of approximately 750 m2 (Molodin et al. Reference Molodin, Mylnikova, Nesterova, Kobeleva and Selin2022). In these features, systems of postholes, a hearth for food smoking was traced, and their long-term use is stratigraphically recorded. Apparently, these are seasonal stops for fishermen and hunters, since a series of pits intended for storing fish and elk bones were discovered here (Figure 3). A large series of objects made of bones and teeth from wild mammal animals and birds, stone (Figure 4), as well as flat-bottomed ceramics were found (Figure 5).
Burial ground Tartas-1 (fragment of the plan).

Location scheme of finds in area of Neolithic seasonal housing No. 6.

Scheme of Neolithic handware and residential complexes, and Bronze Age pits and burials.

Archaeological site of Tartas-1: 1(a–c)— fish pit No 1741; 2–4—pottery from pits and dwellings.

All dates discussed below (Table 1) were obtained from mammal bones, bird bones and fish operculum. Samples were taken from stratigraphically flawless cultural horizons. After repeated use, the fish fermentation pits were sealed and were not disturbed by anyone else. Sometimes it was possible to capture undisassembled layers of fish. On pits Nos. 990, 991, without disturbing them, a Bronze Age burial of the Andronovo (Fedorovskaya culture) was built, which in turn was also not plundered. Two dwellings, seven pits associated with both household and ritual actions, were dated (Molodin et al. Reference Molodin, Mylnikova, Nesterova, Kobeleva and Selin2022).
The earliest date is for vertebra of the hare in pit No. 1383 (GV-2176): 2σ—7593–7142 cal BC. Another date for fox teeth (GV-2177) from the same pit No. 1383: 2σ—7035–6608 cal BC may indicate that fish storage pits were used throughout the entire era of the Baraba culture, and most importantly, they could be reused. The results of dating the bones form pits Nos. 990, 991 and 938 fall into the same period: No. 990 (GV-1309): 2σ—7046–6535 cal BC; two dates for pit No. 991 (MAMS-26158): 2σ—7071–6777 cal BC; (MAMS-26157): 2σ—7036–6694 cal BC; one date for pit No. 938 (GV-1312): 2σ –7057–6656 cal BC. The latest date was shown by a sample from the household-residential structure No. 6 (MAMS-29405): 2σ—5982–5846 cal BC. All other dates obtained from the objects at the Tartas-1 site (Figure 6) are closely correlated with each other and refer to the 7th millennium BC (Table 1) (Molodin et al. Reference Molodin, Mylnikova, Nesterova, Kobeleva and Selin2022).
Photo from a quadcopter of the location area of seasonal housing No. 6, pits, handware and residential complexes.

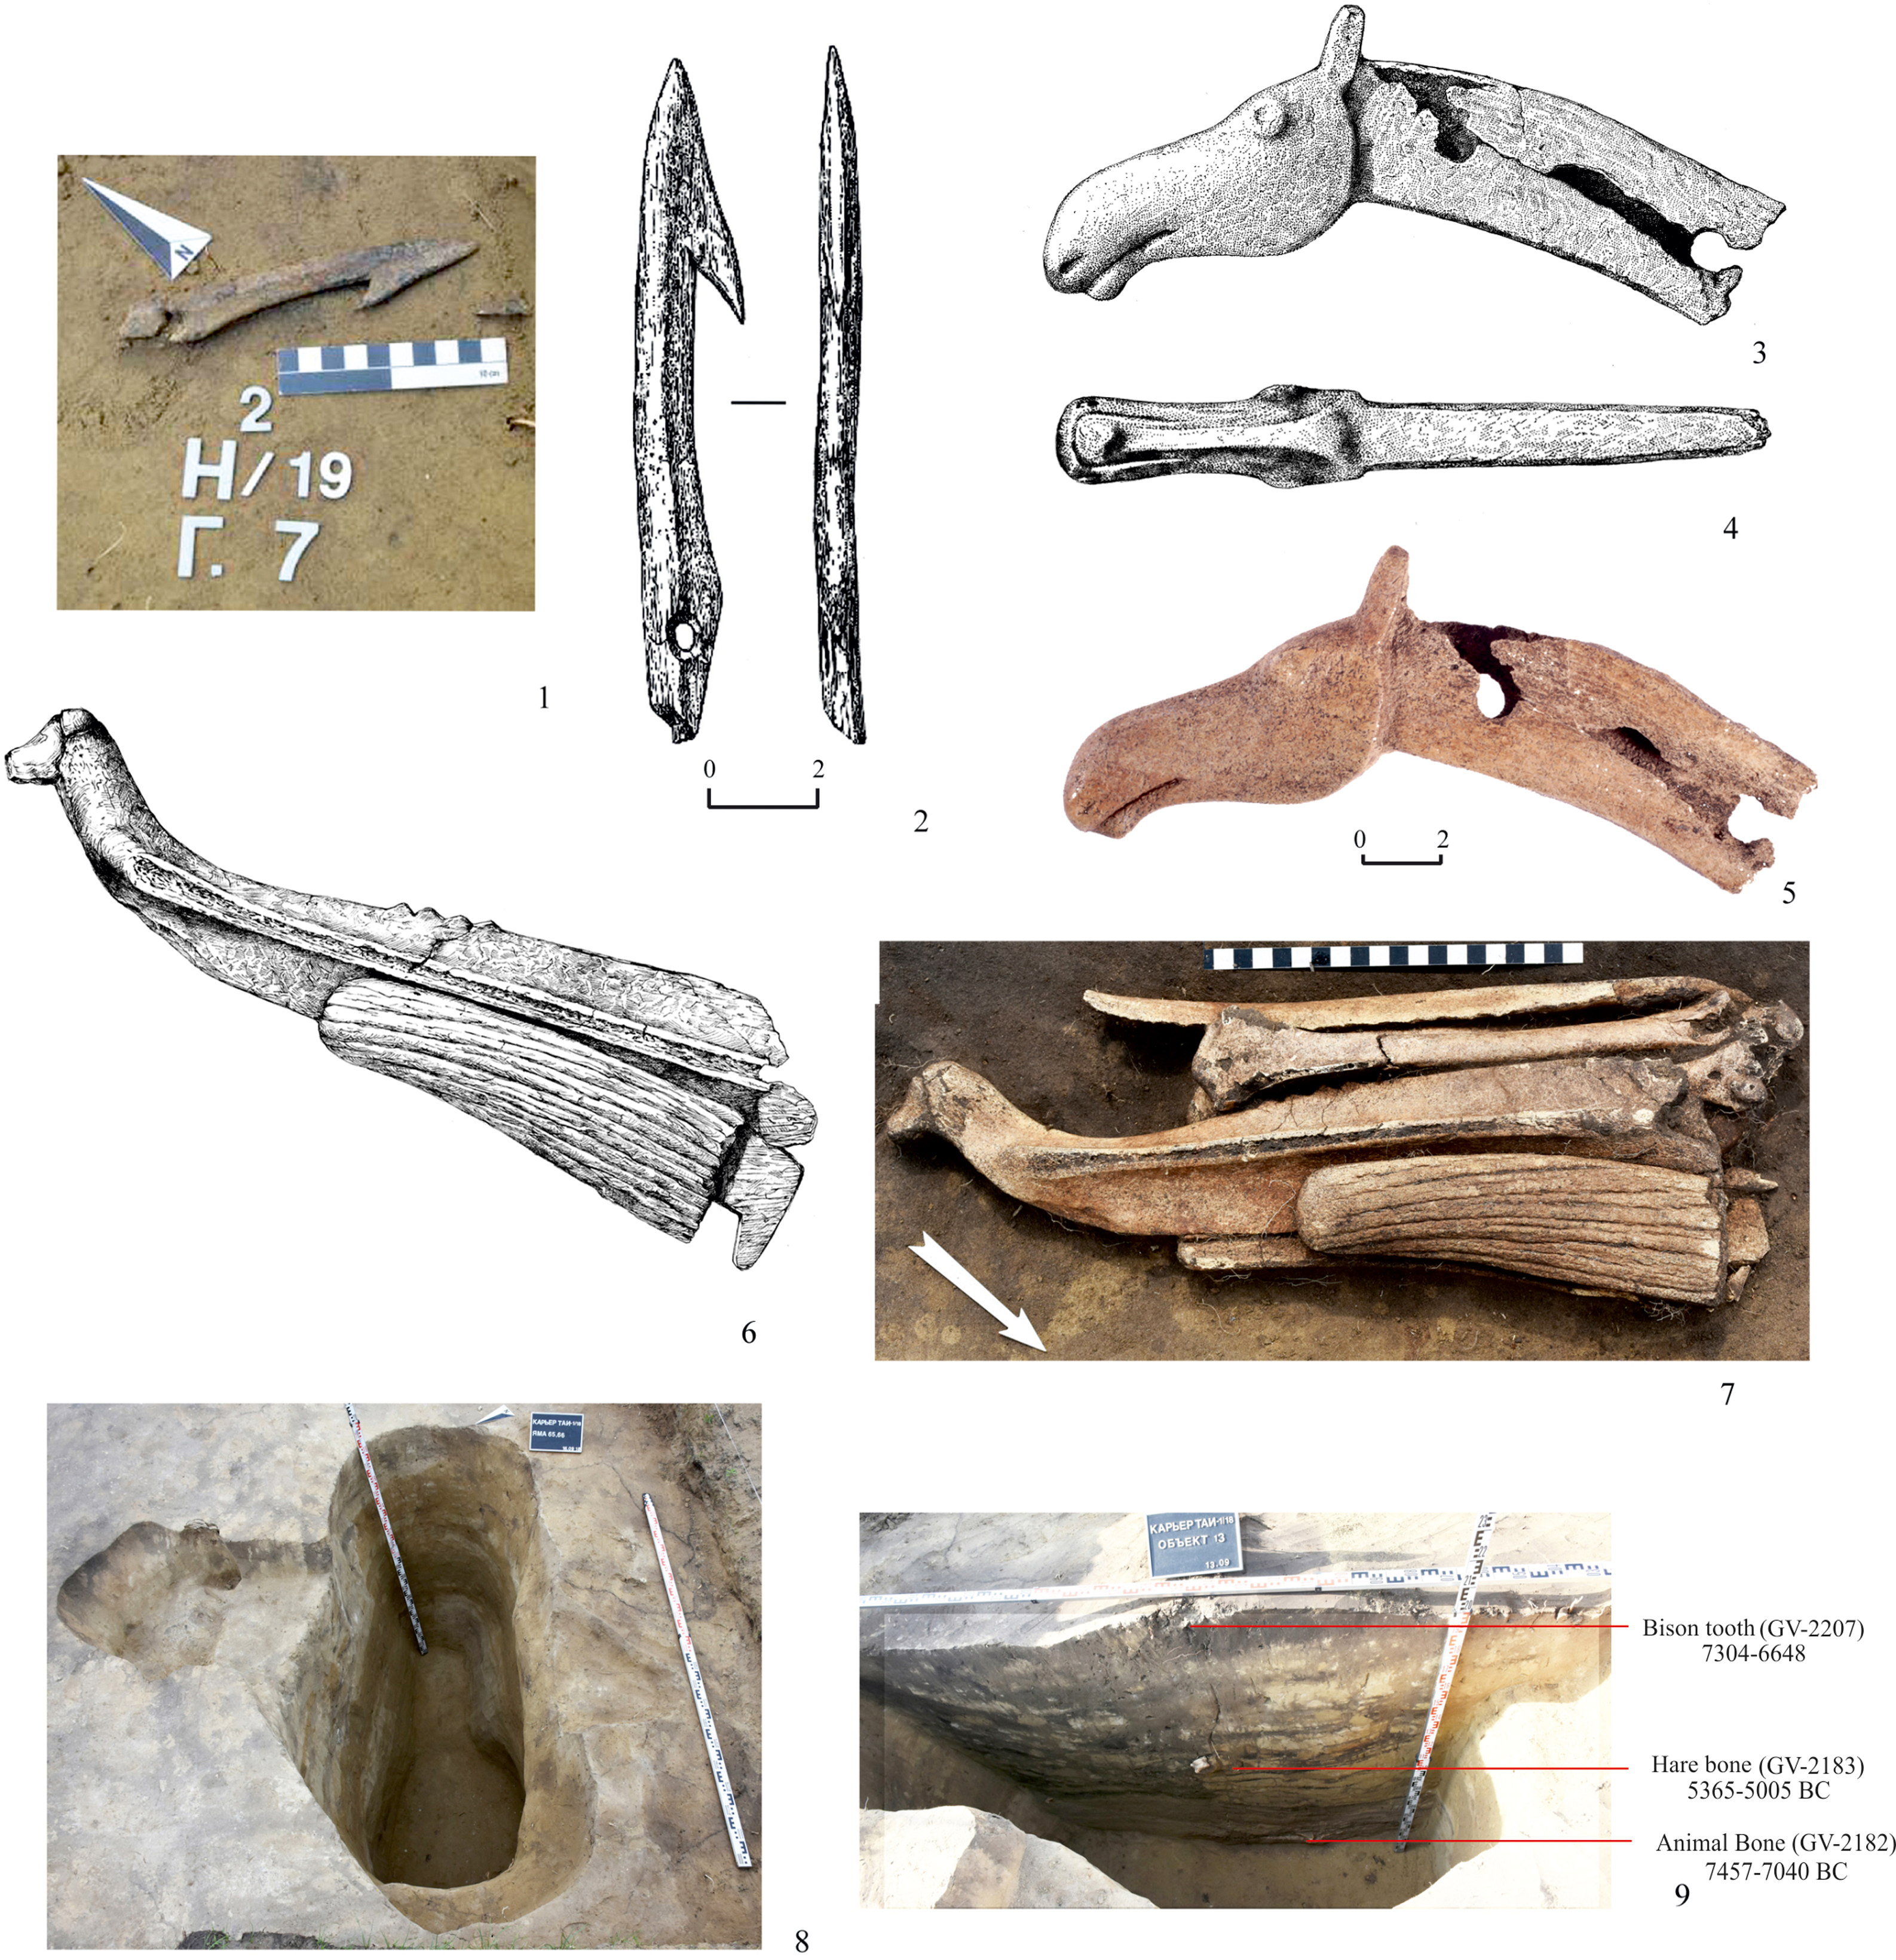
The objects found at the Vengerovo-2 site turned out to be dated within the identified boundaries of the model. A structure with a complex configuration, a two-chamber pit and a separate single pit were found here. In the bottom of the latter, in addition to a few animal bones, a magnificent antler harpoon was found (Figure 7, 1). The date (GV-2843) of this artifact was 2σ —6394–5806 cal BC. An animal bone sample taken from the same horizon of the pit, indexed as (MAMS-29409), was dated 2σ—6437–6266 cal BC. This coincides with the expected duration of the Tartas-1 site.
Аrchaeological site of Vengerovo-2 and Ust-Tartas mounds: 1 and 2—harpoon from Vengerovo-2, 3–5—elk head sculpture, 6—bird from icult hoard, 7—cluster 6, 8, 9—fish pits No. 65–66.

Fish pits and an original ritual complex were found at the Ust-Tartas mounds site (Figure 1). This is a fairly large area marked by a small ditch on the edge of the terrace (≈297 m2). The ditch is U shaped and narrow (0.2–1.5 m) but deep (up to 1 m from the ground level). The ditch and pits contain 92 early Neolithic objects in the form of pottery fragments, stone and bone tools, animal and bird bones and skulls (Molodin et al. Reference Molodin, Mylnikova, Nesterova, Kobeleva and Selin2022). A special place is given to the discovery of a hoard—a certain number of objects of a sacred nature, placed in special places (Figure 7). It was a set of objects tightly adjacent to each other placed in some kind of container. In the upper part of the hoard a pommel in the form of a three-dimensional sculpture of an elk head, an item made of an elk shoulder blade in the form of a bird with a three-dimensional head, a wavy edge, and a decorated outer part were found (Figure 7) (Molodin et al. Reference Molodin, Mylnikova, Nesterova, Kobeleva and Selin2022).
All of the above items have analogies in the items belonging to the period of the Mesolithic–Early Neolithic sites in the predominantly taiga zone of Europe and the Trans-Urals (Gurina Reference Gurina1956; Oshibkina et al. Reference Oshibkina, Krainev and Zimina1992).
The dates of samples from the sanctuary are presented in Table 1. By 2σ their dates are as follows: (GV-2392) 6636–6258 cal BC, (GV-2393) 5986–5726 cal BC, (GV-2394) 5479–5230 cal BC, (GV-2395) 5632–5478 cal BC, (GV-2828) 5534–5221 cal BC. From pits No. 18 and 27 accompanying the sanctuary, the dates obtained refer to the 7th–6th millennium BC. Fish pit No. 7 (MAMS-39313; MAMS-39314) is dated to the 8th–7th millennium BC. There is an interesting situation with fish pit No. 65–66: stratigraphically and planigraphically clearly recorded minimum one penetration—reuse of the pit for fish storage (Figure 7). The situation is similar to that of pit No.1383 of the Tartas-1 site—multiple use of storage pits. Its dates refer to the 8th–6th millennium BC (Table 1) (Molodin et al. Reference Molodin, Nenakhov, Mylnikova, Reinhold, Parkhomchuk, Kalinkin, Parkhomchuk and Rastigeev2019)
It should be noted that all sites investigated, the materials of which were dated, belong to the same Baraba culture. Three characteristic features that unify them are the following: (1) the presence of “fish” storage pits, (2) the presence of items made of bone—“wide knives” in the shape of a bird, and (3) most importantly—the features of ceramic complex: morphology, technology, ornamentation. Special features of ceramics manufacturing in the Baraba culture are the use of a cord when molding the upper part of the vessel, a bottom roller as a result of molding the bottom, and a flat bottom (for the Late Neolithic the region is characterized by a rounded bottom). Moreover, all newly emerging data only confirm this hypothesis.
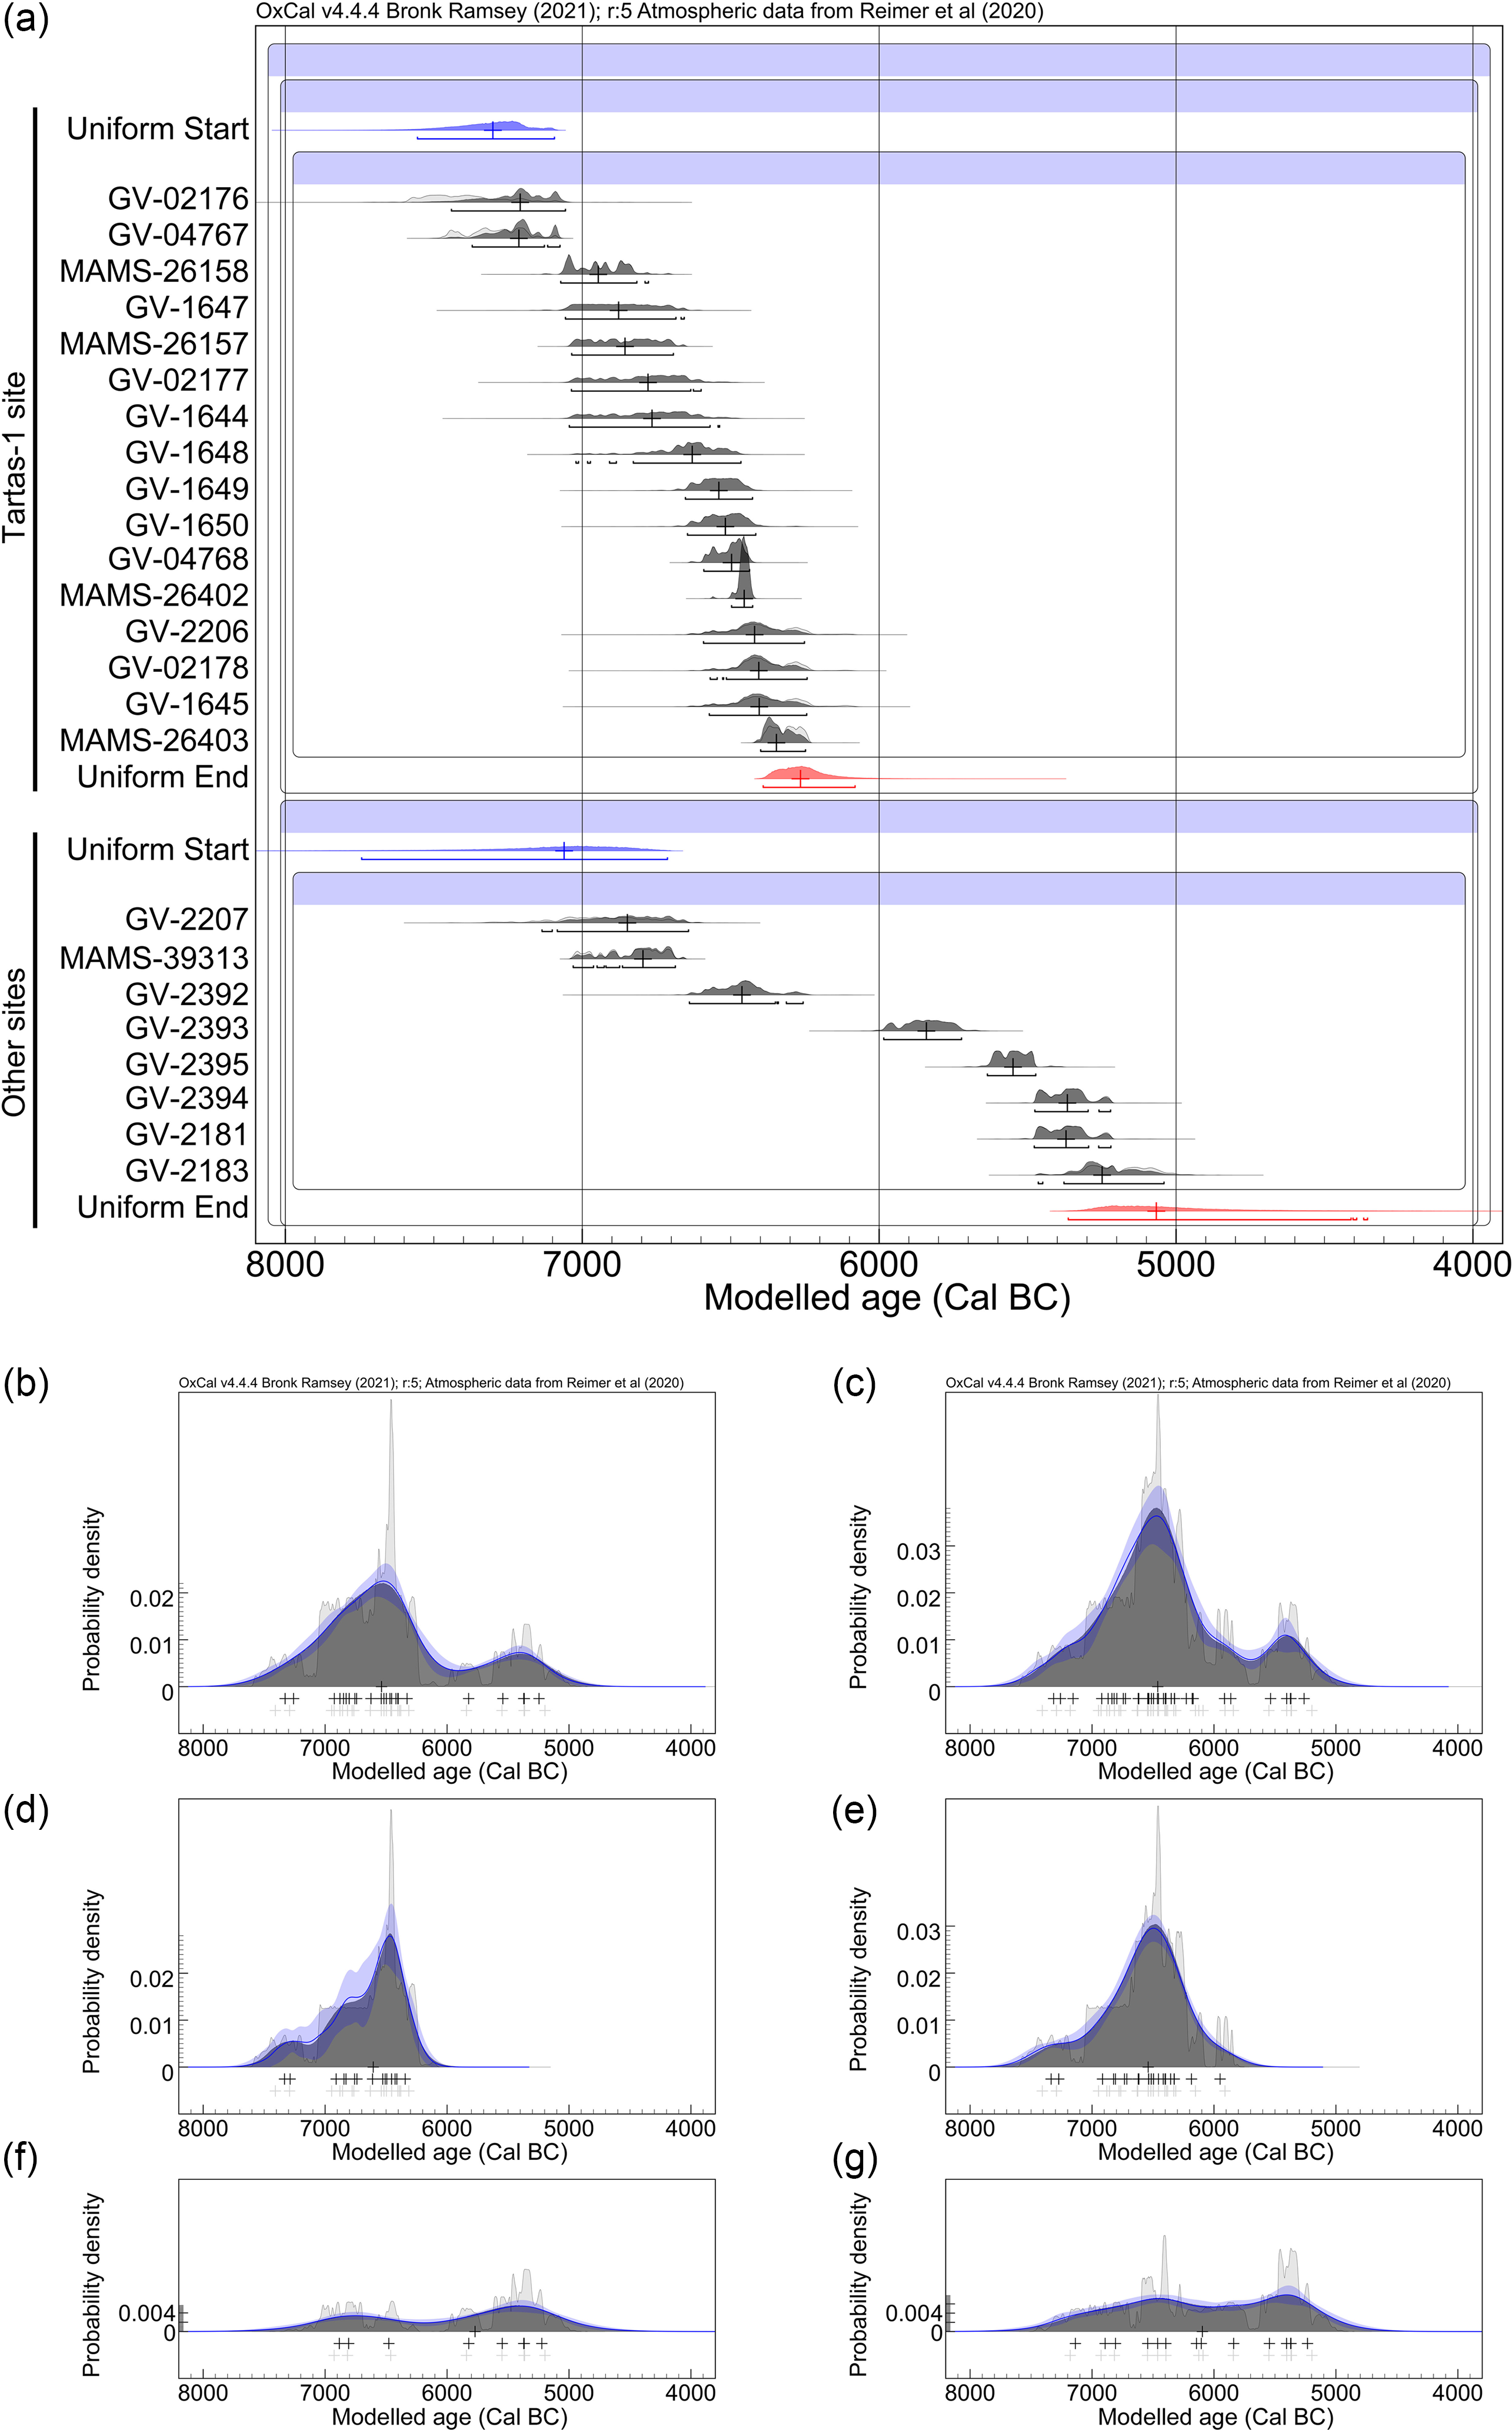
Initial uniform Bayesian modeling of Baraba culture radiocarbon chronology suggested that two characteristic timespans took place at the Tartas-1 site and at a cluster of UT+V sites (Table S1; Figure 8a), with comparable start boundaries (T—7560–7090 cal BC, UT+V—7610–6710 cal BC) yet with distinct end boundaries (T—6390–6080 cal BC, UT+V—5360–4510 cal BC). Nevertheless, KDE modeling showed that time ranges for Baraba sites could be described in terms of non-uniform bimodal distribution, suggesting two subsequent stages of existence occurred between BC 7500 and BC 5000 (Table S1; Figure 8b; KDE: start—7550–7350 cal BC, end— 5200–5100 cal BC). The archeological data also additionally limit the end of the Baraba culture to about BC 5000. An inclusion of radiocarbon dates from samples with unknown or C/N<2.9 ratios into modeling had minimal impacts on the estimations of timeline boundaries limiting the Baraba culture radiocarbon chronology (Figure 8; Tables S1, S2).
Chronological models of Baraba archaeological sites including Tartas-1, Ust-Tartas-1 (UT), and Vengerovo (V) locations: (a) temporal Bayesian chronological phase models for the Tartas-1 site and the cluster of UT+V sites with uniform boundaries. Spatio-temporal KDE models for (b–c) all Baraba sites, (d–e) the Tartas-1 site, (f–g) the cluster of UT+V sites; based on dates with C/N=2.9-3.6 ratios (b, d, f) or all dates (c, e, g). For Bayesian chronological models, 95% intervals for individual findings were depicted for posterior distributions under probability density distributions and uniform boundaries. For KDE models, integral calibrated ages of samples are presented as prior and posterior probability distributions (areas bordered by baselines and blue smoothed lines with 1σ uncertainty intervals). The median ages of individual samples are depicted as data point crosses for prior (light gray) and posterior (black) distributions.

According to a spatio-temporal KDE model (Table S1; Figure 8d), findings from the Tartas-1 site can be described in terms of a single normally distributed stage spanning 7th millennium BC mostly (KDE: start—7600–7300 cal BC, end—6250–6150 cal BC). The Bayesian one-phase model considered artifact No.17 (Table S1) in a way described by Ramsey (Bronk Ramsey Reference Bronk Ramsey2009): as a near-borderline event not belonging to the main pool of findings. It should be noted that the median age for the end boundary at the Tartas-1 site was ∼6270 cal BC (Table S1).
In contrast, spatio-temporal KDE modeling of the UT+V cluster (Table S1; Figure 8f) demonstrated a non-uniform bimodal range of ages spanning since the middle of 8th millennium BC till the start of 6th millennium BC (KDE: start 7500-7200 cal BC, end 4900–4700), with two specific peaks at 6400–6300 cal BC and at 5500–5300 cal BC. Both KDE (Figure 8f, Table S1) and refined Bayesian two-phase (Figure S1; Table S1) models suggested that the peaks were separated by a transitory period of uncertain duration spanning for several hundred years near BC 6000 (Table S1; transition boundary: uniform—cal BC 6390–6010, KDE—cal BC 6250–5700).
Due to specific spatio-temporal distributions identified by KDE models, several possible factors that might influence the results of the modeling were also assessed, including facility-based variations (Table S4, S5), a possible confounding by samples with unacceptable C/N ratios (Figure 8b–g; Table S5) and a probable impact of historical events affecting the distribution of findings at Baraba sites (Table S3, S4). In line with KDE models, the existence of two subsequent stages for the cluster of UT+V sites is supported by differences in median ages between individual sites reckoned (Figure S2; Tables S3 and S4, SITES: B10 = 22.39, F(1,22) = 13.29, p = 0.0014,
 $\eta _p^2$
= 0.38). According to ANOVA, a number of (UT+V)-sites-derived artifacts were of later origins than findings from the T site (Figure S2; Table S3). Only minimal-to-none differences between ages assessed at GV and MAMS facilities were identified by ANCOVA (Table S4; FACILITIES: B10 = 0.541, F(1,21) = 0.52, p = 0.477,
 $\eta _p^2\;$
= 0.02; SITES+FACILITIES: B10 = 10.55), showing inter-laboratory consistency in the inadvertent cross-checking and suggesting the SITES factor was a major known source for differences identified between Baraba sites by ANOVA.
With this, modeling results in pair with archeological data support existence of the Baraba culture between 7500 cal BC and 5000 cal BC, characterized by bimodal intensity of sites use during two subsequent stages of existence, separated by a transitory period of uncertain duration lasting since the end of 7th millennium. The first stage took place between 7500 cal BC and the transition-initiating event at the end of 7th millennium BC. During this time interval, all Baraba sites were in use by people, with the Tartas-1 site demonstrated the maximum number of findings increasing before the transition period, according to the KDE modeling (Figure 8).
The probability density with the end boundary for the Tartas-1 site suggests a relatively rapid abandonment of this site after the end of the first stage with no subsequent restoration of regular activity at this archaeological monument, making it possible to date the start of between-phase boundary near BC 6240. It cannot be excluded that the desertion of Tartas-1 site identified in the Baraba chronology was associated with the 8.2k climatic event characterized by lower temperatures and drier weather in the Central Asia region (Alley and Ágústsdóttir Reference Alley and Ágústsdóttir2005; Jörgensen et al. Reference Jørgensen, Pesonen and Tallavaara2022; Schulting et al. Reference Schulting, Mannermaa, Tarasov, Higham, Ramsey, Khartanovich, Moiseyev, Gerasimov, O’Shea and Weber2022).
In contrast to the abrupt end of the first stage, it is hard to delineate durations of the transition period and the second stage at the Baraba sites from one from another. Findings might support the prolonged nature of transition between stages identified. Modelling results in pair with archeological data suggest that the second stage at the Baraba region took place somewhere after the transition event till 5000 cal BC, with sites of the UT+V cluster were in use only.
Two stages of existence singled out by analysis for Baraba sites are consistent with the previous description of these archaeological monuments—three habitation horizons have been identified; restructuring of the hearth and restructuring of the structure as a whole (Molodin V.I. et al. Reference Molodin, Hansen, Myl’nikova, Reinhold, Nenachov, Nesterova and Durakov2017). It should be noted that two stages of existence are not the stages of the Baraba culture. Possibly the population stopped using Tartas-1 due to rising water, since there might have been no access to the site. Even in our time, as there is a dam at the location, the water rises and floods everything around. This did not happen at the Ust-Tartas-1 monument; its operation continued, since it is located on an 8-meter terrace (Molodin et al. Reference Molodin, Mylnikova, Nesterova, Kobeleva and Selin2022). Thus, two stages apply only to operation of cultural monuments located in the same microdistrict, but having different altitude characteristics.
While all our findings had relatively low C/N ratios of <=3.2, a number of samples with even lower C/N ratios of <=2.9 was higher within findings dated by 6400–5900 cal BC (Table 1; Figure S3; Fisher exact test(30) – p = 0.031, OR = 14.0, OR CI95 1.742–112.5), coinciding with the 8.2k event related period of global climatic changes (Alley and Ágústsdóttir Reference Alley and Ágústsdóttir2005). According to Bayesian ANCOVA, the C/N ratios of findings might be impacted both by the FACILITIES covariate due to differences in sample processing or by the 8.2k related climatic changes (Table S5; FACILITIES: BF10 = 576.1; FACILITIES+8-2K: BF10 = 1473.9; 8-2K: BF10 = 19.37). It could not be excluded that the increased number of findings with extremely low C/N ratios at that historical period might be diet-related, reflecting intrinsic shifts in bone compositions induced by 8.2k related climate changes somehow (DeNiro and Epstein Reference DeNiro and Epstein1977; Guiry and Szpak, Reference Guiry and Szpak2021). It is also possible that the CEZA-applied technique is sensitive to climate-related shifts in C/N ratios, which should be checked in the future.
We suggest that the Baraba region chronology is an interesting archaeological case with bimodal distributions of events at sites still not well understood, requiring integral application of Bayesian chronological models in pair with KDE models and Bayesian ANCOVA/ANOVA to delineate stages existed. Our data also suggest a need for novel methods dissecting overlapping stages effectively on a basis of distributions underlying those stages and other timelines of events available.
Supplementary material
For supplementary material accompanying this paper visit https://doi.org/10.1017/rdc.2025.10103
Acknowledgments
We express our gratitude to the team of the Curt-Engelhorn-Centre of Archaeometry for receiving some of the AMS dates of the Early Neolithic Baraba culture, as well as to the coauthors of our publications, Svend Hansen and Sabine Reinhold. The authors are grateful to the staff of BINP SB RAS for AMS dating. This research was conducted within the framework of the IAET SB RAS project “Comprehensive studies of the ancient cultures of Siberia and adjacent territories: chronology, technology, adaptation and cultural ties” (FWZG-2022-0006).