

Introduction
The relation between the World Trade Organization (WTO) and trade-related interest organizations has been and still is a contentious topic in many political and scholarly debates.Footnote 1 One of the key issues in these debates is the access that the WTO offers to a variety of interest groups wanting to participate in the institution's decision-making process. Although access to the WTO's predecessor the GATT was always limited, since the establishment of the WTO in 1995 the number of these access opportunities has slowly been growing. However, despite these new opportunities, the level of openness of the WTO towards societal interests is still amongst the lowest of all international organizations (Van den Bossche, Reference Van den Bossche2008). Many interest groups, in particular NGOs, have, as a reaction, contended that the WTO needs to become more responsive to their input (O'Brien et al., Reference O'Brien, Goetz and Williams2000; Esty, Reference Esty2001; Steffek and Kissling, 2006).Footnote 2
The call for more openness of the WTO towards interest groups has found much resonance in academic circles, attracting both proponents and opponents of the openness desired by different types of organized interests. The proponents of more openness argue that the WTO should allow a higher number of more diverse societal interests access to its decision-making process, thereby granting the WTO more expertise, accountability, and legitimacy (Charnovitz, Reference Charnovitz2000; Robertson, Reference Robertson2000; Scholte, Reference Scholte2000).Footnote 3 Opening up the system would, in addition, reduce the danger that the WTO falls prey to an over-specialized narrowly focused interest representation system, and consequently, in line with Olson (Reference Olson1982), became captured by specific interests. Opponents, on the other hand, contend that the WTO should maintain its system of limited access to interest groups or even further constrain access. They argue that the WTO should stay a state-driven institution in which NGOs and business organizations only have a limited role, because of the inherently biased nature of interest group systems more generally, the allegation that interest groups from developed countries would disproportionally profit from increased access opportunities thereby strengthening the position of developed countries even further, and, finally, the likelihood of capture as a result of the influential position of special interest groups (Shaffer, Reference Shaffer2001; Fried, Reference Fried1997; Spiro, Reference Spiro2000).
The effects of more openness, however, on the composition of the WTO interest system, and consequently on the democratic accountability and transparency of the organization, remain largely an empirical question. Rather than simply assume or predict that more openness will stimulate the mobilization of more diverse interests, this article examines how the interest group system of the WTO has evolved during the past two decades, a period characterized by increased openness towards non-state actors. That is, by exploring the development of the WTO interest population over time we provide a detailed and systematic insight into the actual consequences of opening up (parts of) the WTO system. An evaluation of the WTO interest system is not only useful from a scholarly point of view, it also benefits policymakers and the broader public as it generates insights into the behaviour of certain key WTO stakeholders. Without such knowledge, we do not know the extent to which trade interest representation is skewed toward one particular interest or not, which in turn makes it hard to take any meaningful position on the desirability of granting interest groups increased access to the WTO political system.
The article will be structured as follows. We first provide a brief history of the relation between the WTO and trade interest groups system and link this to existing, more general, political science perspectives on how interest group systems tend to develop. We argue that opening up a policymaking system to interest groups does not necessarily lead to a more diverse set of interests being represented. On the contrary, more openness and the growth of an interest group system often results in an overrepresentation of specific interests. Subsequently, we analyze the development of the WTO interest group population empirically. We do so based on a novel dataset of 1992 interest organizations that attended the seven different Ministerial Conferences (MCs hereafter), the highest decision-making body of the WTO. Our analyses show that the WTO interest group population is not characterized by infinite growth or an increasing diversification of interests that are represented. In the case of certain issue-related interests, in particular agriculture, the system has become even less diverse since the WTO allowed interest groups to participate at MCs. We also observe that business interests do not (increasingly) dominate the MCs, and that NGOs are also quite well represented at these venues. Yet, the stability at the aggregate level of the WTO obscures high levels of volatility at the organizational level; this suggests that only a small number of organizations are capable of continuing their lobbying in the long run.
WTO and interest groups: the relation between openness and diversity
Before the establishment of the WTO in 1995, interest groups did not develop an extensive relationship with the General Agreement on Tariffs and Trade (GATT), the international trade organization of that time. The technocratic nature of most trade negotiations as well as the explicit exclusion of societal interests made GATT an unattractive target for lobbying (Steffek and Kissling, Reference Steffek and Kissling2006). As the GATT consistently denied access to non-state actors, business and other societal interests prioritized close contacts with national governments instead of building transnational lobbies. As a result, state–society interactions in the trade domain mostly occurred at the national level and were best described as two-level games (Putnam, Reference Putnam1988; Evans et al., Reference Evans, Jacobson and Putnam1993).
In the 1990s, however, interest groups developed a greater interest in direct access to the GATT for two reasons. Firstly, in particular during the Uruguay Round, a growing awareness arose that trade affects many other policy areas, including development, and environmental and public health issues.Footnote 4 As a result, many NGOs across the globe started to monitor policymaking in the GATT system and began to demand more direct input into the policy process of the international trade regime. As Keohane and Nye wrote, the traditional club model of closed and exclusive negotiations came increasingly under pressure (Keohane and Nye, Reference Keohane, Nye, Porter, Sauve, Subramanian and Beviglia Zampetti2001; see also Charnovitz, Reference Charnovitz2000; Aaronson, Reference Aaronson2001; Meunier, Reference Meunier2003). In addition, the gradual worldwide lowering of tariff barriers had important consequences for the traditional club model as well. That is, new, primarily non-tariff trade barriers or so-called behind-the-border issues became more salient (Aaronson, Reference Aaronson2001; Young and Peterson, Reference Young and Peterson2006). Because trade policies regulate trade between nations with different regulatory traditions, domestic regulations distorting trade became part of the trade agenda. Areas of concern included labor rights, environment, services, food safety, education, health care, and culture – all contentious areas within many countries. This has led many NGOs, who were previously not interested in global trade politics, to enter the international trade domain. In addition, the gradual opening of the international economy created more favorable economic and political conditions for exporting firms. Important in this regard is that many exporting firms are large multinational companies who are, compared to other societal interests, a quite concentrated political force. In contrast, import-competing sectors, publicly owned service industries, and consumers remain a quite fragmented political force, especially at the global level. Yet, partially as a consequence of recent technological developments, the aggregation of these diffuse interests at the global level became more feasible. So, where traditional trade negotiations were once dominated by interests that focused on issues such as tariff barriers, jobs, exports, and the compensation of distributional losses, now a broader range of interests had reasons and the capability to mobilize in favor of or against trade liberalization or to seek compensation for decreasing profits and regulatory losses. As a consequence, an increasing number of societal interests started to demand more access to global trade decision-making.
In reaction to these developments, the WTO established guidelines in 1995 that stipulated more openness towards societal interests (Steffek and Kissling, 2007; Van den Bossche, Reference Van den Bossche2008). Although access to some arenas of the WTO policymaking process has markedly improved since 1995, effective access to formal decision-making processes remains heavily constrained (Piewitt, Reference Piewitt2010). A case in point is the following qualification in the 1996 Guidelines that recognized NGOs as important stakeholders: ‘it would not be possible for NGOs to be directly involved in the work of the WTO or its meetings’.Footnote 5 This means that interest organizations have no access to any formal meeting, trade negotiation, specialized committee, or hearing of the Dispute Settlement Body (DSB), which has several consequences for organizational participation and lobbying strategies. Firstly, although the WTO welcomes interest organizations at MCs, they are not able to attend the official trade negotiations (Van den Bossche, Reference Van den Bossche2008). As trade negotiations are primarily conducted by government officials and in settings where only trade officials gain access, the ability of interest groups to influence the hour-by-hour evolution of trade negotiations at MCs is severely limited. This constraint is exemplified by the fact that attending interest groups receive similar badges as journalists at MCs, thereby granting them the same opportunities and limitations. One notable exception is that some interest group officials occupy a formal position in the delegation of their country of origin. Although this allows them to follow the negotiating process more closely, they have no access or cannot monitor the actual negotiations in the green room.Footnote 6
Secondly, at symposia and public briefings, the WTO Secretariat does provide civil society with an opportunity to deliberate on trade topics and exchange views with other actors. Yet, at these meetings there are usually just a few governmental representatives present and the information presented mostly covers decisions that have already been made, which severely limits the options for interest groups to influence or monitor ongoing trade negotiations. Finally, in the case of the DSB, some more substantive changes seem to have been taken place, most prominently the well-documented Amicus Curiae Briefs, that is the possibility for parties not involved in the case, such as interest groups, to offer voluntary assistance to the DSB. Nonetheless, in practice the cases where such briefs were actually included are very rare, which illustrates the limited impact of this development (Charnovitz, Reference Charnovitz2000; Pauwelyn, Reference Pauwelyn2003; Van den Bossche, Reference Van den Bossche2008).
In sum, while interest organizations formally have more opportunities to gain access to the WTO's policymaking processes, in practice the limitations to their participation in formal decision-making venues suggests that access and chances to exert influence are still relatively limited (Scholte, Reference Scholte2000; Odell, Reference Odell2006; Steffek and Kissling, Reference Steffek and Kissling2006). These limitations on interest group involvement led many interest groups representatives, practitioners, and scholars to conclude that the WTO needs to become more responsive and open towards societal input (O'Brien et al., Reference O'Brien, Goetz and Williams2000; Esty, Reference Esty2001; Steffek and Kissling, 2006). The central argument underlying the demand for more openness is that more access and attention towards interest groups will stimulate the involvement of a higher number of diverse societal interests, which in turn will grant the WTO more expertise, accountability, and legitimacy (Charnovitz, Reference Charnovitz2000; Robertson, Reference Robertson2000; Scholte, Reference Scholte2000). In addition, opening up the system would ensure that the WTO would not fall prey to an over-specialized narrowly focused interest representation system. That is, by allowing interest groups to participate more intensively in the decision-making process the alleged bias within WTO's interest representation system would significantly be reduced, according to this line of reasoning. However, not everyone agrees that interest group participation will diminish the likelihood of biased policy outcomes. Opponents argue that the current openness of the WTO towards societal interests is already extensive and, if possible, should be curtailed because of the inherently biased nature of interest group systems more generally. This is especially the case for the WTO for which it is argued that organizations from developing and least-developing countries are highly disadvantaged due to a shortage of resources and expertise (Shaffer, Reference Shaffer2001; McGinnis and Movsesian, Reference McGinnis and Movsesian2004; Fried, Reference Fried1997; Spiro, Reference Spiro2000). In short, students arguing in favour or against opening up the WTO system towards more input of societal interest come to significant different conclusions on the actual effects of such measures, and consequently on the desirability of allowing interest groups to participate (more intensively) in the WTO decision-making process.
Assessing the impact of inclusiveness on interest group systems
The debate on the effects of offering more access opportunities to a wider variety of interest groups on WTO policy outcomes relates to a fundamental issue in the study of interest group politics, namely whether the involvement of interest groups in public policymaking enhances democratic legitimacy or whether it has a corrupting effect. Particularly regarding trade policymaking, there is a classic debate over whether interest group involvement optimizes welfare-enhancing policy outcomes or should just be seen as a deadweight loss (Olson, Reference Olson1965; Becker, Reference Becker1983; Grossman and Helpman, 2001, 270–275). A key question for international organizations, such as the WTO, is whether the involvement of interest groups helps to address a (perceived) democratic deficit inherent to international governance. This is especially important given that (certain) international organizations have grown in importance, thereby constraining the room to maneuver for national policymakers. Sovereignty loss of nation-states has potential negative consequences for the accountability and legitimacy of national governments, and this gradual erosion of democratic accountability at the national level is not compensated by increased political accountability at the international level (Smythe and Smith, Reference Smith, Neuman, Thakur and Tirman2006). Much of the debate on the functioning of the WTO – its transparency, its openness, its accountability – relates to this basic problem and the demand for more openness towards societal interests (see for instance Dunhoff, Reference Dunhoff1998; Esty, Reference Esty1998; Simmons, Reference Simmons1998; Charnovitz, Reference Charnovitz2000; O'Brien et al., Reference O'Brien, Goetz and Williams2000; Robertson, Reference Robertson2000; Shaffer, Reference Shaffer2001, Reference Shaffer2003; Pauwelyn, Reference Pauwelyn2002; McGinnis and Movsesian, Reference McGinnis and Movsesian2004; Narlikar and Wilkinson, Reference Narlikar and Wilkinson2004; Scholte, Reference Scholte2004; Van den Bossche, Reference Van den Bossche2008; Steger, Reference Steger2009; Piewitt et al., Reference Piewitt, Rodekamp and Steffek2010).
Despite the debate on whether or not interest groups should be allowed to participate more intensively at the WTO, the actual effects of such measures are for the most part still unclear. It is unclear, for instance, whether inclusive institutional arrangements will effectively address the alleged domination of the Northern hemisphere and business associations within many global interest systems. Moreover, we do not know whether a more diverse set of interests will indeed be represented when an international organization becomes more open to the input of societal interest groups (Fried, Reference Fried1997; Spiro, Reference Spiro2000). Studies of interest group systems at lower levels of government, however, indicate that the consequences of opening up a political system to the input of interest groups may differ substantially from what policymakers expect. The case of the European Union (EU) is illustrative in this regard. The European institutions (the European Commission, the European Parliament, and the Council) have, in various ways, attempted to involve interest groups in the policy process in order to address the democratic legitimacy of the EU. Recent empirical research shows, however, that expertise-based inside lobbying by, especially, organized business dominates the grass-roots mobilization of social movement organizations substantively (Berkhout and Lowery, Reference Lowery2007; Wonka et al., Reference Wonka, Baumgartner, Mahoney and Berkhout2010). Active outreach to interest groups by EU policymakers did not lead to more diversity in terms of types of interest groups. Rather, it tended to reproduce existing skewed distributions of interest representation whereby some types, mostly business interests, dominate the population of interest groups that seek access in Brussels.
Disproportional distributions of interest representation, as observed in the EU case, tend to be a natural feature of interest group populations, a feature which is not necessarily bound to the institutional characteristics of a specific venue, but more to how interest groups organize their lobby efforts (Baumgartner and Leech, Reference Baumgartner and Leech1998; Beyers et al., Reference Beyers, Eising and Maloney2008). To properly assess the functioning of an interest group system, we have to systematically assess how it changes over time. Numbers and distributions can offer us important insights into the composition of interest group systems, for instance which (types) of interests mobilize more or less easily, and whether the population becomes more or less heterogeneous over time. In this paper, we will analyze the evolution of the WTO interest system over time by tracing the density, diversity, and volatility rates of the interest group populations present at MCs. By using these concepts, which originate from studies on domestic interest group systems, we attempt to make the functioning of international venues comparable to other interest representation systems (Messer et al., Reference Messer, Berkhout and Lowery2011). Together these three characteristics offer insights into how the overall WTO interest group system has developed over time, and are therefore crucial indicators for a better understanding of the effects of a more open institutional structure.
How do density, diversity, and volatility relate to the development of interest group populations? Density is a relational concept and refers to the number of interest groups active within a certain area, either in geographical terms (Gray and Lowery, Reference Gray and Lowery1996; Halpin and Baxter, Reference Halpin and Baxter2008; Nownes, Reference Nownes2004) or in terms of substantive policy area (Browne, Reference Browne1990). Interest group system growth is not a simple linear process, however. Initially, the number of interest groups active in a certain area grows only slowly. During the initial period when a new interest group community is formed, the exchanges between policymakers and interest groups are not yet firmly established and considered legitimate. In this phase, much interest group activity has not yet gained a taken-for-granted status and they still need to find their way towards the policymaking elites (Nownes, Reference Nownes2004; Nownes and Lipinski, Reference Nownes and Lipinski2005; Nownes, Reference Nownes2010). The relatively low legitimacy levels during the initial stages of the development of an interest group population implies that young interest populations – such as the WTO interest group population in 1995–1999 – grow slowly at the beginning. After some time, many of these constraints disappear and the number of mobilized interest groups grows rapidly. At a given point in time, growth slows as a result of population dynamics. The number of potential constituents and government activity prove to be powerful constraints on the further growth of the interest group system. Interest group system growth thus follows a density-dependent mechanism in which their growing maturity and increasing density discourage further entry (Lowery and Gray, Reference Gray and Lowery1996). Simply opening up a system to a larger set of interest groups is therefore no guarantee for infinite growth of the interest group population lobbying that particular system.
The diversity of an interest group system has been a traditional concern in the interest group literature (Baumgartner and Leech, Reference Baumgartner and Leech1998; Beyers et al., Reference Beyers, Eising and Maloney2008). Limited diversity, or, put differently, a skewed pattern of interest representation as opposed to a balanced or more normally distributed pattern, is often considered as problematic because of the potentially uneven distribution of influence that results from this. While early interest group scholars differ markedly in their normative assessment of potentially limited diversity of a given interest community (Truman, Reference Truman1951; Schattschneider, Reference Schattschneider1960; Olson, Reference Olson1965), recent empirical studies repeatedly show a significantly skewed pattern of interest representation, specifically the dominance of business interests in both national and international systems (Baumgartner and Leech, Reference Baumgartner and Leech2001; Berkhout and Lowery, Reference Lowery2007). In that sense, the alleged abundance of business organizations in the WTO decision-making process (Esty, Reference Esty2001; Held and McGrew, Reference Held and McGrew2002) is not sui generis to the WTO, but more a generic feature of how interest group systems develop.
Volatility, finally, points to the extent to which interest groups are able to enter a specific area and maintain their lobby efforts over a longer period of time. Volatility is important for two reasons (Berkhout and Lowery, Reference Berkhout and Lowery2011). Firstly, it tells us something about how easy it is for new organizations to enter a policy venue. If a system were skewed towards a certain type of interest or biased in favor of a small number of players, it may become much more difficult for different kinds of new organization to enter it. Especially when certain types of interest groups were to leave the population much earlier and also more often than others do, this could indicate that a political venue is more open and accessible to some types of interests rather than others. Secondly, stability and volatility are important for the role interest organizations play. The more stable the pattern of representation is, the more interest organizations will be capable to build experience in lobbying and construct long-lasting policy networks with key policymakers. Organizations that maintain only a temporary presence are much less likely to create these vital resources and consequently less likely to be influential.
How did we trace the development of the WTO interest population?
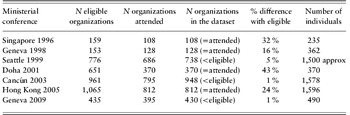
To assess the development of the WTO interest system over time, we constructed an overview of all interest organizations that attended or were eligible to attend WTO MCs. To collect these data, we followed a strategy that is common in recent interest group studies, namely the systematic mapping of all interest groups involved in lobbying at a particular policy venue (Halpin and Baxter, Reference Halpin and Baxter2008; Messer et al., Reference Messer, Berkhout and Lowery2011; Lowery and Gray, 1996; Wonka et al., Reference Wonka, Baumgartner, Mahoney and Berkhout2010). The dataset includes 1992 organizations that were registered by the WTO Secretariat as eligible to attend and/or attended one of the seven MCs the WTO organized since 1996. Basically, our map of the WTO interest system consists of organizations which sought access to the WTO by applying to the WTO Secretariat to be accredited at one of its MCs. Via a website-search we traced these organizations. For 1,593 organizations we could identify a website which offers more elaborate data on the organization; for 370 organizations we were not able to find a website, but information stored on other websites enabled us to code at least some basic features of these organizations. Only 29 organizations could not be traced. This dataset with web-based information gives us a comprehensive insight into the type of organizations interested in WTO policies, the region or the countries where they come from, their respective areas of interest, and how they are organized, to name a few of the variables for which the organizations were coded. Moreover, because we have data on all MCs from 1995 (Singapore) to the last in 2009 (Geneva), we can account for density, diversity, and stability changes over time. Table 1 provides an overview of the participation of interest groups at the different WTO MCs. In addition, we conducted a set of semi-structured interviews (21) with WTO officials, and interest group and governmental representatives. These interviews were designed to help us structure and contextualize the quantitative data we gathered.Footnote 7
Eligible, attending, and number of organizations in the WTO dataset

While the resulting database ensures a comprehensive overview of the WTO interest system over time, we need to be aware of some obstacles associated with the underlying data collection strategy. As a first important issue, the records kept by the WTO Secretariat lack some accuracy. To begin with, for some MCs (Singapore, Geneva 1998, Doha, Hong Kong) there are lists only of the organizations that effectively attended rather than who got accredited by the WTO Secretariat. There is, however, no data on which organizations this omission concerns and why these eligible organizations did not travel to the MC. For three conferences (Seattle, Cancún, and Geneva, 2009), the number of organizations on the WTO list is substantially larger than the number of organizations that, according to the official WTO sources, attended the MC. In these cases, the numbers are very close to the number of eligible organizations, which leads us to presume that the data here correspond with the eligible organizations. A second consideration with regard to the data refers to the exclusion of interest groups who are willing but not allowed to attend the MCs. Before each MC, interest groups have to submit an official request, stating the reasons why they want to attend and how their interests are related to WTO issues. The WTO Secretariat then decides on the basis of Article V, para. 2 of the WTO agreement whether interest groups are eligible to attend.Footnote 8 One important criterion for the WTO Secretariat is that accredited actors should be interest organizations – being business associations, labor unions, NGOs, think thanks, local governments – and not individual firms (Van den Bossche, Reference Van den Bossche2008). The WTO Secretariat does not keep a full record of all groups that were denied access to MCs, but WTO officials who are responsible for the selection process assured us that only a small number of interest groups is denied access in practice. This means that excluding these organizations will have only a limited effect on the findings we present.
Another, more important issue is the extent to which the WTO sources are representative of the interest groups which potentially could lobby the WTO, a common problem of interest group studies (Lowery et al., Reference Lowery, Poppelaars and Berkhout2008b; Poppelaars, Reference Poppelaars2009a, Reference Poppelaars and McGrath2009b; Berkman, Reference Berkman2001). In this study, we collected data only on interest group access to one specific venue of the WTO, namely MCs. We are aware that interest groups also use other venues to seek influence, such as their domestic governments, foreign delegates, or other WTO venues. Yet, as argued before, our analysis is not about influence as such. We merely aim to show what the consequences are when allowing interest groups to participate, at least for a part, in the WTO system. This way the opportunities that interest groups were provided during the past 15 years in terms of access to MCs may serve as a benchmark for future policy or debates on increased or decreased interest group input. Moreover, the MC is the highest decision-making body of the WTO and all interest groups we interviewed indicated that attending these meetings is an essential, albeit not the only, ingredient for lobbying on WTO policy. This leads us to expect that most of the interest groups that have an interest to influence WTO decision-making will also attend these meetings as part of their lobbying strategy.
The density of the WTO interest group system
We now turn our attention to the first part of the empirical analysis, which focuses on the density of the WTO interest group system. We operationalize density as the aggregate number of organizations mobilized for a given MC. The general expectation is that the number of mobilized interest groups will initially grow, because of the growing number of issues at stake in WTO negotiations, the increasing openness of the WTO itself, and the fact that over time interest organizations themselves professionalize, become more effective, and learn how to mobilize at the international level. However, at some point a density-dependence mechanism may set in, which means that once a substantial number of organizations get mobilized the entry of new groups and the exit of unsuccessful groups will be driven by competition of scarce resources. Or, after some time, groups encounter more and more constraints in realizing their policy goals and, in response, they may exit and/or seek access to other international organizations (Smith, Reference Smith, Davis, McAdam, Scott and Zald2005; Smith and Weist, Reference Smith, Davis, McAdam, Scott and Zald2005; Smith, Reference Smith, Neuman, Thakur and Tirman2006, 420; Alter and Meunier, Reference Alter and Meunier2009). Therefore, we expect that after some time the growth of the WTO interest group population will remain constant or slows down.
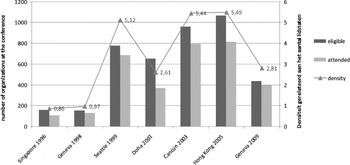
In Figure 1, the density of the WTO interest population is displayed. First, as expected, our mapping shows that the population of interest groups attending MCs developed slowly during the first few years that interest groups were allowed to participate (Nownes, Reference Nownes2004). Moreover, the data also confirm a trend which Smith (Reference Smith, Neuman, Thakur and Tirman2006) also identified for international NGOs in general, namely WTO lobbying is, like other international lobby communities, not an infinite growth business. Although there are clear differences between the number of organizations effectively attending and eligible to attend several MCs, overall the numbers follow the same trend. The data indicate a process starting with slow growth (1995–1998), then entering a stage where the population grows rapidly (1999–2003), and finally a stage whereby the number of active organizations starts to decline (2005 onwards). Figure 1 also clearly shows a ‘Doha-effect’, a sharp decrease in the number of organizations attending and/or eligible for that particular MC. The Doha-effect seems to reflect a combination of factors. Fewer interest organizations asked to get access to the Doha MC in the aftermath of 9/11. And, in addition, limited availability of hotel accommodation and strict visa requirements ensured that a much smaller number of eligible organizations could actually attend the conference.
Comparing density of WTO population over time

We also calculated a relative density measure by relating the number of attending organizations to the number of WTO member-states.Footnote 9 This relative density measure follows the same trend as the simple count numbers. This strong correspondence is explained by the fact that the number of member-states has not grown dramatically since the WTO started in 1995, and, most importantly, that only 13 interest organizations (out of a total of 1,992) originate from the 27 new WTO member-states. The impact of adding new member-states does not relate directly to density; a large share of the mobilized interest organizations originates from the founding member-states of the WTO. In sum, after a slow start, the density of the WTO interest population increased rapidly for a couple of years and then more or less stabilized. At first glance, it therefore seems that the WTO interest system has reached a mature, stable composition of interest organizations.
The diversity of the WTO population
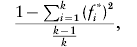
As discussed, diversity refers to the (im)balance of different types of interests represented in a given interest system. An important issue is what sort of meaningful distinctions are useful in order to describe the diversity of a population of interest groups. In this paper, we concentrate on three classifications. A first classification involves a distinction between economic versus non-economic interests, and between specific sectors within these broad areas of interest. Variation in terms of organization type constitutes the second classification, whereby we distinguish between business associations, NGOs, labor unions, and institutions. The country or region of origin is the final distinction with which we assess diversity. For each of these three distinctions, we outline density rates and compare the three classifications based on the nominal dispersion indices. The nominal dispersion index measures the dispersion between nominal categories and varies between 0 and 1, with higher values indicating more dispersion.Footnote 10 Low values indicate that some organization types or issue areas are heavily represented and strongly outnumber other categories.
The first distinction, issue variation, is closely related to a pattern that has been repeatedly observed in interest group studies, namely ‘bandwagoning’, whereby a small number of groups lobby alone, while most groups lobby in crowds or flocks (Baumgartner and Leech, Reference Baumgartner and Leech2001; Halpin and Baxter, Reference Halpin and Baxter2008). Therefore, we would expect to see peaks in the skewed nature of mobilization attention,whereby a minority of policy issues attracts the majority of activity. Ideally, we would need data on issue-based mobilization in order to identify bandwagons in a more precise way. As there are no such issue-based data available, we need to rely on a more rough characterization and we decided to identify the area of policy interest for each organization by combining two coding schemes. For economic organizations – mostly business and labour – we adopted the United Nations ISIC Classification Registry (21 major categories and 103 subcategories), while for non-economic organizations we relied on an adapted version (12 categories) of the World Values Survey (Messer et al., Reference Messer, Berkhout and Lowery2011). As many organizations are potentially active in multiple areas, we attributed multiple codes to organizations whenever appropriate. By using this system of multiple coding, that is each organization may receive up to three codes relating to its areas of activity and each code counts as an observation in the dataset, we get a more diversified picture, namely n=5,793.
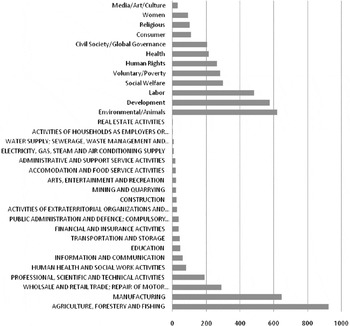
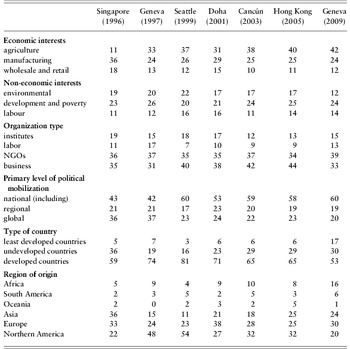
Figure 2 presents the distribution across 21 economic (for the major categories) and 12 non-economic areas for all interest groups present at all MCs. The combination of these economic and non-economic categories allows us to draw a first picture of the overall diversity of issue areas. For economic sectors, we observe a policy bandwagon with regard to the agriculture sector. There is substantial attention in three other areas – manufacturing, retailing, and professional activities – but the attention for these areas remains considerably smaller. The low coverage of some issues is not unsurprising, given the limited impact of the international trade regime for these areas (e.g. real estate). Yet, for some areas the low coverage is somewhat unexpected (e.g. financial and insurance activities, and transport). The non-economic areas, in contrast, seem more heterogeneous, as we can see a more diverse distribution. To obtain a more detailed analysis of how diversity in terms of issue areas has developed over time, we compared the percentages of the economic and non-economic interest groups that attended a particular MC related to the three largest economic and non-economic issues areas (see first set of rows in Table 2). For economic issue areas, the results confirm a bandwagon effect with regard to agriculture; almost at every MC the number of organizations representing the agricultural sector rises – for example, for the most recent MC in Geneva, 42% of all economic interest groups that attended that MC. Although this result is probably related to the fact that agriculture is one of the main topics of discussion during the last few MCs, it does also point to the fact that the WTO system has not become more diverse over time in terms of the economic interests that are mobilized. On the contrary, it appears that the WTO interest system is slowly being dominated by agricultural interest groups, potentially at the expense of other types of economic interest groups. In the case of non-economic issue areas, specifically environmental NGOs, interest in attending MCs seems to be lost after an initial growth in the period before Doha. Organizations interested in development and poverty issues, on the other hand, show a steady increase in attendance (De Bièvre and Hanegraaff, Reference De Bièvre, Hanegraaff and Reinalda2011). This is probably an effect of the Doha development agenda, as we can see that the percentage of such groups increases again after the Doha MC in 2001 after dropping somewhat in the MCs before Doha.
Distribution of attention per issue area (N=5,793)

Development of issues, type, and origin of organizations at MCs (percentages)

With regard to organization types, the second diversity indicator, we differentiated between business, labour, NGOs, and institutions (see the third set of rows in Table 2).Footnote 11 The difference between business and NGOs is not very large and does not fluctuate substantially over time; it always remains between 33% and 44%. The number of labour unions remains rather low (between 9% and 17%), a finding which is consistent with other observations on this type of interest organization and the WTO (Beyers and Kerremans, Reference Berkhout and Lowery2007). These results suggest that there is no systematic underrepresentation of non-business interests compared to business interests. Apparently, non-economic interests are quite well represented at the WTO (Piewitt, Reference Piewitt2010). We do not observe strong growth of one type of organization; while there are some fluctuations, we do not observe substantial changes in any particular direction.
A third diversity indicator is the territorial origin of the interest groups involved. The fourth and fifth sets of rows in Table 2 show that domestically based groups constitute by far the largest group of lobbying organizations, and their share has grown considerably over the years. The number of such groups has increased by 17 percentage points, from 43% to 60% during the last MC in Geneva.Footnote 12 The number of regionally based organizations (of which 44% are EU-level business organizations and NGOs) constitute a relatively stable share – between 17% and 23% – of the overall population. Although, one cannot simply conclude that domestically based groups will represent nationalistic interests, the strong and ever-growing presence of nationally based groups leads us to nuance the so-called growing importance of transnational interest groups or global social movements. Instead, our data suggest that international conferences are increasingly used by domestic groups for all sorts of purposes, which could include the continuation of their domestic lobbying and the monitoring of national governments at international venues. This general picture fits into the notion that domestic groups play a key role in potential policy changes when it comes to protectionism, and might also be a result of the fact that most regulatory policies are still situated at the national level (Goldstein and Martin, Reference Goldstein and Martin2000).
The final set of rows in Table 2 (region of origin) confirms at first sight a strong representation of countries of the Northern hemisphere (Piewitt, Reference Piewitt2010). When we scrutinize the data more carefully however, the picture becomes more nuanced. In addition to overrepresentation of the northern hemisphere countries, we also observe a potential geographical effect, that is a strong representation of organizations from countries or regions close to the conference venue, which is most obvious when we compare the Seattle MC with the Doha MC. Organizations from the US outnumber other organizations by far at the Seattle MC (54%), whereas in Doha the number of US organizations sank to 27% of the overall population. In Doha, we also see an increase in the number of Asian and African organizations. This, most likely, is the result of the close proximity of Doha to these regions. In general, however, it is safe to conclude that organizations from developed countries still constitute the bulk of the organizations that attend WTO MCs.
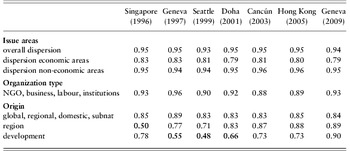
Finally, we compared the development of each of the diversity variables over time based on the nominal dispersion indices (see Table 3). With regard to issue areas, we conclude that dispersion is mostly higher for non-economic interest than economic interest and does not greatly vary over time. The lower dispersion for economic issue areas is basically due to the ‘bandwagon effect’ we observed with regard to agriculture. Even more interesting is that over time the economic diversity did not increase substantially as more interest groups attended the MCs. This means that increased attendance of economic interest groups has led to a situation where more interest groups deal with similar issues, rather than more interest groups dealing with different issues. The situation for non-economic issues is even starker, as the nominal dispersion index dropped slightly, indicating that the population of social interest groups that attended MCs became less diverse over time. These findings confirm that increased attendance of interest groups at the WTO or the openness of the WTO towards societal interests does not necessarily lead to a more diverse set of interests being represented.
Nominal dispersion indices and diversity in the WTO interest group population

Index: dispersions lower that 0.70 are put in bold.
The nominal dispersion index concerning the diversity in terms of organizational types is high, which leads us to conclude that the population of interest organizations lobbying at WTO MCs is quite balanced between business interests and non-business interests. Also interesting to see is that the dispersion index is lowest at the most crowded MCs, namely Cancun and Hong Kong. In short, a more open system and of higher levels of participation do not lead directly to a more diverse set of types of interest groups. Quite the contrary, at the MCs with the highest attendance rates, the diversity rates decrease rather than increase.
Finally, the lowest dispersion is observed with regard to the origin of interest organizations. Dominant are national interest organizations and organizations originating from developed, mostly OECD countries, in Europe and Northern America. Yet, with respect to this factor we observe that dispersion has become less severe over time, and that the lowest dispersion measures concern the earlier MCs. This is interesting as this indicates that diversity in terms of country of origin has grown over time; more and more advocates originating from developing countries are represented at WTO MCs. Also interesting is the fact that domestic interest groups have been and still are the most dominant actors at MCs, which indicates that between 1995 and 2009 the WTO interest group system has not evolved into a more global system of representation. There is, however, a trend towards more diversity in terms of interest groups that are situated at the regional level (Europe, South-East Asia, Latin-America, and so on). There is an increase of regionalist representation, an increase that is mostly at the expense of global interest organizations rather than national ones. To conclude, with the exception of interest groups from development countries and regionalist organizations, where we see a trend towards diversification, the overall diversity in most areas did not increase over time.
The volatility of the interest representation at WTO MCs
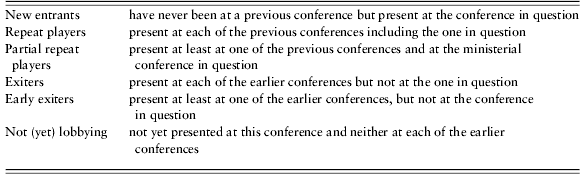
Based on the observations in the previous section we might conclude that the WTO system is relatively stable, namely that at the aggregate level of represented sectors, countries and broad organizational distinctions, there are no tremendous changes to be observed. To offer a more complete picture about the stability of the WTO interest system, we analyzed when groups enter MCs and when they exit from this venue.Footnote 13 Entry and exit rates are important, because they can be seen as key indicators of the stability and volatility of the system. We coded the 1992 organizations for exit and entry-rates at each MC. For the purpose of this paper, we restrict the analysis to exploring the aggregate variation of exit and entry over time. Entry levels differentiate between the organizations that are newcomers to the WTO and those that regularly participate at MCs. Exit rates concern organizations that did not lobby at a particular MC. We differentiate between those that were present at all previous MCs (repeat players), those that were present at least one of the earlier MCs (partial repeat players), those that were at each of the previous MCs but not at the one in question (exiters), and those who were at least one of the earlier MCs but not at the one in question (early exiters) (see Table 4).
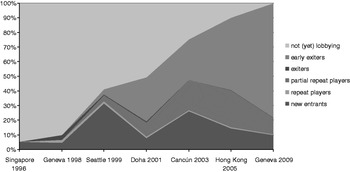
Comparing exit and entry rates over time

Categories of entry and exit
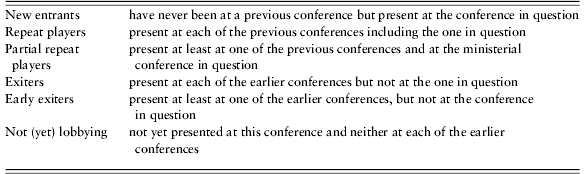
Figure 3 depicts the entry and exits rates for all MCs. As a first general observation, we see that that each MC attracts new organizations, but that since the Cancún MC (2003) the number of new entrants starts to decrease. Second, repeat players, that is organizations that are present at all previous conferences, are an extremely rare ‘species’. More substantial is the category of partial repeat players, a category that grows until the Cancún conference, but starts to decline after Cancún. The number of organizations that attended at least one of the previous conferences grows till 2003, but many of these organizations did not return after 2003. This suggests that the population that lobbies during the WTO MCs is characterized by strong fluctuations, a decreasing level of stability, or increased volatility.
This volatility is confirmed by the exit rates. The rate of ‘early exits’ is substantial and grows over time, indicating that many organizations attended a particular MC but not subsequent ones. Compared to new entrants, the category of early exit is relatively large, which again confirms the high volatility of the total population. We also see that the number of partial repeat players increases while, as said, the number of new entrants declines. A declining number of new entrants could point to competition and a density-dependence mechanism, namely at some point a growing number of lobbying organizations discourages new organizations to enter as the added value of lobbying decreases. When there are more organizations that lobby, the chances of individual success are lower. Yet, the substantial size of partial repeat players and early exits suggest additional mechanisms to be present. For instance, organizations sometimes concentrate their lobby efforts on one particular MC because there is one specific issue on the agenda that concerns them. Or, interest groups use MCs in order to organize meetings and to coordinate various international activities rather than to lobby on specific trade issues.Footnote 14 Also interesting is that, for Doha, the visa restrictions did not so much impact the group of ‘exiters’, which after all remains a small group for Doha, but affected the groups characterized by ‘early exit’ substantially. All these trends point to the importance of contextual variables such as policy agenda and environmental selection criteria in addition to density-dependent mechanisms, and/or the strategic adaption of the interest groups themselves.
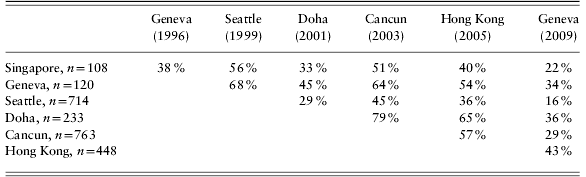
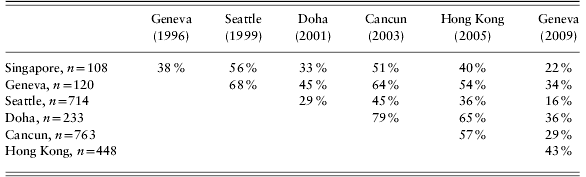
Table 5 links exit and entry rates rates to specific MCs and allows us to say something about the effect of different MCs. For each conference, we analyzed the newly added members (column 1). For instance, in Doha, 233 new organizations entered that did not attend Singapore, Seattle, or Geneva. The next columns show how many of these new organizations attended one of the subsequent summits. When we compare the percentages, we observe substantial differences between the MCs. For instance, the Seattle Conference was very successful in attracting new entrants, but less than half of these new entrants showed up at later conferences. Also for Cancún and Hong Kong, two other MCs with large numbers of new entrants, we observe a rather low number of organizations returning at later conferences. This is especially significant when compared to Singapore and Geneva (1996), two early MCs where only a small number of new groups were added. The proportion of returning organizations is much higher for these conferences (compared to later MCs such as Seattle, Cancún, and Hong Kong). Interesting is Doha, a conference where the number of new groups when compared to the other MCs is low (as well as the overall number of participants), but where we see that a majority of these groups shows up at future conferences. Possibly, more selective conferences such as Doha, Geneva 1996, and Singapore attract, due to competitive effects, more active, resourceful, and experienced interest organizations. However, more research is needed on the relation between key organizational characteristics and entry and exit rates to better explain the development of the WTO interest group population over time.
Returning newcomers at WTO MCs
Conclusion
In addition to the many debates on the desirability of increased civil society participation in the WTO, in this paper we empirically investigated the actual effects of allowing more interest groups to participate at MCs of the WTO. We examined, based on a novel dataset of 1992 interest groups that attended one or several of the MCs, the density, diversity, and the volatility of the WTO's interest system as it has developed since 1996. In this way, we contribute to a deeper understanding of the often complex relationship between international institutions and interest groups as well as our understanding of the development of interest groups systems more generally.
In terms of density, we found that more openness in terms of allowing interest groups to participate at MCs is no guarantee for linear or infinite growth. What we observed is an initial stage of slow growth (1996–1999), followed by a period of rapid increase (1999–2003), and, finally, a stage where the number of active organizations starts to decline (2005 onwards). When it comes to diversity, we observed that the composition of the WTO interest group system, at a glance, does not favor business interests over other interests, at least not in terms of the number of organizations that attend MCs. The WTO interest representation system is, however, skewed towards certain types of issues and country of origin. Especially in the case of economic issue areas, manufacturing and especially agricultural interest groups have become increasingly dominant within the population. Other important sectors on the other hand, such as finance and transport sectors, seem far less represented. The development of non-economic interest groups seems more evenly distributed, although the increase of development and poverty organizations and the decline of environmental NGOs after the Doha MC (2001) may lead to a less diverse population. The data also demonstrate that a vast number of interest groups lobbying at the WTO MCs are national interest groups, and that the share of these organizations, despite all expectations of a growing number of transnational NGOs, is growing, both in relative and absolute terms (see also Smith and Weist Reference Smith, Davis, McAdam, Scott and Zald2005 for the importance of ties with the domestic policy context). Interest groups from developed countries also vastly outnumber groups that come from developing countries. Nevertheless, these differences decrease somewhat over time, pointing to an increasing input of developing countries at MCs. Finally, as far as volatility is concerned, the WTO system of interest representation is rather volatile. Repeat players – organizations that attend MCs more than once – remain a minority and the number of organizations exiting after attending one MC has grown over time. This indicates that for many organizations, it is difficult or not attractive to keep a long lobbying presence at WTO MCs.
There are some important issues which we could not fully address in this paper, but which offer interesting avenues for further research. To begin with, although gaining access to MCs can be important for gaining political attention and influence, the data do not allow us to draw firm conclusions on influence (Dür, Reference Dür2008; Poppelaars, 2009a). As said before, organizational densities themselves do not translate into direct influence. Moreover, there is only very limited systematic data about precise activities of interest groups at WTO MCs. Many observers of the WTO (or other policymaking venues) are tempted to think that the reasons why organizations lobby are directly related to the gaining of influence on specific policy issues. Yet, interest groups lobby for multiple reasons, including organizational maintenance, monitoring of the policy environment, seeking policy relevant information, etc. (Lowery, Reference Lowery2007). Additional research, including comparative research that covers other international organizations, needs to clarify these issues. Related, it is important to emphasize that bias and skewness are two different things. The fact that we observe a skewed distribution in the interest group system does not necessarily mean that the policy outcomes of the system are biased towards certain interests. To conclude on a bias of policy outcomes we need information on how a skewed pattern of mobilization or interest group presence at MCs translates in actual policy outcomes. This requires data on successful lobbying strategies of interest groups and whether these are affected by the population characteristics we demonstrated earlier (Lowery et al., Reference Lowery, Poppelaars and Berkhout2008a).
In general, our findings offer novel empirical insights into the consequences of opening up of the WTO system towards more input of non-state actors. In particular, our results offer insights into the development of a relatively young interest population, which is unique in interest group research (but see Nownes, Reference Nownes2004, Reference Nownes2010; Nownes and Lipinsky, Reference Nownes and Lipinski2005). Importantly, the results show that the WTO interest group system is not becoming more diverse as is often claimed. Especially in terms of issue areas, certain areas have become more dominant compared to others. Nonetheless, we also see that over time some of the traditionally ‘weaker interests’, such as developing country interests, have become somewhat better represented. The system in general seems to develop in a rather consistent and stable manner, regardless of how many interest groups attend at MCs. Yet, at the same time the WTO interest representation system is also characterized by a substantial volatility in terms of individual attendance. Apparently, it is not so difficult for interest groups to start lobbying at an MC, yet it is not so evident that these organizations maintain a durable presence at these conferences. This indicates that the WTO interest groups system is not as stable as it seems at first glance, and that it is potentially prone to sudden and radical disturbances. That is, high volatility rates could indicate that certain interest groups feel that attending these meetings is unproductive in terms of influence production and consequently decide to exit the interest system of the WTO indefinitely. From a normative perspective, this could become problematic if certain types of interests would exit more rapidly and in greater numbers than other types of interests, as this would eventually strengthen the already uneven system of interest representation at the WTO and further disrupt objectives that were aimed to open up the WTO to more diversified types of interest.