Introduction
The aim of organic farming is to establish and maintain soil–plant–animal interdependence and to create a sustainable agroecosystem based on local resources. Livestock is largely concerned by the organic farming standards of the International Federation of Organic Agriculture Movements, which specify that (i) a balanced mix of crops and animal production should be promoted to give closed, sustainable nutrient cycles, (ii) animals should be given freedom and access to natural behaviour and (iii) biodiversity should be maintained (Hovi, Reference Hovi2002). Most of the research on organic farming, sustainable agriculture (Park and Seaton, Reference Park and Seaton1996) or agroecology (Dalgaard et al., Reference Dalgaard, Hutchings and Porter2003) has to consequently be interdisciplinary, combining biotechnical sciences together with economics and sociology. In 1998, organic sheep and goats represented 0.4% of the European Union’s herds, with a weaker development than for other animal productions. This may be related to (i) constraints in feeding management (feed produced on-farm or bought in at high cost), (ii) constraints in disease control, in particular endoparasites such as helminths (Hovi et al., Reference Hovi, Sundrum and Thamsborg2003), and (iii) insufficiently organised marketing (Nardone et al., Reference Nardone, Zervas and Ronchi2004). Studies on organic meat sheep production should therefore include animal feeding, breeding, disease control, production and product quality together with economic profitability.
This study was designed to compare two organic sheep production systems differing in their reproduction rhythm. In the first system, the ewes lambed once per year (1L/1Y), with lambings equally distributed between spring and autumn, the overall strategy being to balance feed self-sufficiency (pasture-feeding) and lamb marketing period. In the second system, the ewes lambed three times over 2 years (3L/2Y). In non-organic farms, managing three lambings per ewe over 2 years (3L/2Y) has proved to be of economic interest, as it allows an increase in ewe productivity (Speedy and FitzSimons, Reference Speedy and FitzSimons1977; Brelurut, Reference Brelurut1987) and economic profitability compared with one lambing per ewe per year (Benoit and Veysset, Reference Benoit and Veysset2003; Benoit et al., Reference Benoit, Laignel and Liénard1999). The 3L/2Y system is classically based on three mating periods per year, with ewes frequently synchronised using hormones in spring mating. This system is, however, much more intensive for the animal, more reliant on concentrate feed and more complex to organise than 1L/1Y (Cournut and Dedieu, Reference Cournut and Dedieu2004). Also, as organic regulations forbid the use of hormones and limit the use of synthetic drugs and concentrate feed, we set out to test the hypothesis that using 3L/2Y in organic sheep production was riskier in terms of reproduction performance, health and possibly economic profitability, and therefore less sustainable than using 1L/1Y.
Material and methods
Experimental design
Each system used 118 ewes and 24 ha, with a stocking rate of 0.8 livestock unit/ha, the animal and land characteristics being similar. Both systems were managed over 4 years (2000–2003) by the same personnel.
One lambing per year (1L/1Y)
Lambings were equally distributed in two periods, March and November. Two lambings sessions were planned to (i) optimise ewe productivity, since dry ewes could be recycled from one mating period to the next, (ii) control the flock renewal after a first lambing at 18 months and (iii) optimise the lamb marketing period, with sales in winter, which is a profitable period for retail prices.
Three lambings over 2 years (3L/2Y)
Ewes were assigned two batches lambing in March, November and June at 8-month intervals (Benoit, Reference Benoit1998). Lamb marketing was thus spread over the year. This intensive reproduction system was expected to reveal the limiting factors facing organically managed sheep systems run intensively.
Experimental farm
This study was conducted at the Clermont-Ferrand/Theix INRA (Institut National de la Recherche Agronomique) experimental farm of Redon in the Auvergne region, located 700 to 850 m above sea level, on shallow soil. Annual rainfall averaged 700 mm with frequent drought in summer. The initial surface area (48 ha) was split equally between the two systems (pasture for hay 52%, improved pastures for grazing 27% and rangelands 21%).
Mixtures of cereals (triticale, barley and oats) and peas were sown from 2000 (1.1 and 1.5 ha in 1L/1Y and 3L/2Y, respectively) to increase feed self-sufficiency, with the aim of producing 40% to 50% of concentrate feed requirements. It was planned to cultivate the cereal–pea plots for 3 years and then use them as cultivated grassland for 3 years.
Reproduction management
The two flocks were made up from an initial batch of Limousine breed sheep keeping the same age structure. The same rams were used for mating (Limousine breed for flock renewal and Ile-de-France breed for meat lambs). In 1L/1Y, lambs were suckled by their dams as long as good quality pasture was sufficiently available, as recommended by Prache et al. (Reference Prache, Brelurut and Thériez1986). In 3L/2Y, lambs were weaned earlier to limit the mobilisation of the dams’ fat reserves and optimise the next mating period (Cognié et al., Reference Cognié, Schirar, Martinet, Poulin and Mirman1984). Mean age at weaning was 85 and 76 days for March and November lambings, respectively, in 1L/1Y, and 58, 70 and 64 days for March, June and November lambings respectively, in 3L/2Y.
In October mating, the rams were kept with the females for 35 days in both systems. In June mating, when the sexual activity of the Limousine breed is low (Walrave et al., Reference Walrave, Cantin, Desvignes and Thimonier1975; Tournadre et al., Reference Tournadre, Bocquier, Petit, Thimonier and Benoit2002), ram effect was used in both systems to induce sexual activity in ewes previously in anoestrus (Signoret, Reference Signoret1990; Thimonier et al., Reference Thimonier, Cognié, Lassoued and Khaldi2000). As recommended by Tournadre et al. (Reference Tournadre, Bocquier, Petit, Thimonier and Benoit2002), rams were introduced from the end of May until mid-July (3L/2Y) or end-July (1L/1Y). In 3L/2Y, the third mating period involved lactating ewes before they entered anoestrus (Walrave et al., Reference Walrave, Cantin, Desvignes and Thimonier1975); it started on 20 December and lasted 35 days. The time lag between weaning and beginning of the next mating period was thus as follows: for October mating, 59 and 108 days for 3L/2Y and 1L/1Y, respectively, for June mating, 23 and 109 days for 3L/2Y and 1L/1Y, respectively. For 3L/2Y lactating ewes mated in January, weaning was 47 days after the beginning of the mating period.
Management of animals, pasture and crops, and organic fertilisation
The animals were turned out to pasture between 15 March and 5 April. When climatic conditions were unfavourable, lactating ewes and lambs were kept indoors at night. In autumn, pregnant ewes were kept indoors from 2 weeks before first lambing onwards; the other ewes remained at pasture up to mid-December. November-born lambs were fed indoors with hay and concentrate, the daily level of concentrate being restricted to a maximum of 600 g/day in compliance with organic farming regulations. March- and June-born lambs were grazed. In 3L/2Y, grazing lambs were supplemented with concentrate feed, ad libitum, not exceeding 600 g/day per lamb, from birth to slaughter. In 1L/1Y, grazing lambs were not supplemented before weaning; from weaning onwards, they were supplemented, ad libitum, not exceeding 600 g/day per lamb. The lambs were slaughtered at the experimental abattoir, which was located less than 6 km from the pasture and sheepfold, when they had reached a satisfactory level of fatness.
The strategy for parasitism prevention was as follows: pasture contamination was prevented by allowing only one grazing period for lactating ewes (thereafter mowing for conserved forage or grazing by dry ewes) and by using preventive anthelminthic treatment before ewes were turned out to pasture (Athanasiadou et al., Reference Athanasiadou, Gray, Younie, Tzamaloukas, Jackson and Kyriazakis2007). We limited infestation of lambs after weaning by fattening them on clean, previously mowed pastures. We used synthetic pharmaceuticals only when no other effective treatment was available (Cabaret et al., Reference Cabaret, Bouilhol and Mage2002).
When possible, meadows were cut early and conserved in wrapped round bales (30% of total conserved forages). The nitrogen supply was taken as based on the legumes for the pastures and the protein-rich plants for crops to replace purchased nitrogen fertiliser (Doyle and Topp, Reference Doyle and Topp2004). Compost was spread on the pastures harvested for conserved forages and on the 2nd and 3rd year of crops, at 5 t/ha.
Data recording and measurements
Forage production and quality, and feed consumption
In mowed pastures, forage production was estimated by weighing randomly chosen bales and counting the number of bales harvested. In grazed plots, pasture production was estimated using 24 exclosure cages placed on 12 representative paddocks in each system. The herbage grown in exclosure cages was measured in May, July and September. On samples of hay taken at random from bales, we measured crude protein content (CP, Dumas N × 6.25) and net energy value (INRA, 1989). The abundance of legumes was assessed visually in July using a 5-point scale from 0 (no legumes by surface area) to 5 (75% legumes by surface area). In grazed plots, pasture intake was estimated from the number of grazing animals, assuming a daily intake of 1.7 kg dry matter (DM) (dry and pregnant ewes), 3.0 kg DM (lactating ewes), 2.0 kg DM (rams) and 1.0 kg DM (weaned lambs).
Mineral balance and soil fertility
Mineral balance (N, P and K) at system level was calculated as the difference between inputs (fertilisers, feed) and outputs (meat). Symbiotic fixation was not taken into account. The pasture nutrition indices were calculated over 2000 to 2002 according to Salette and Lemaire (Reference Salette and Lemaire1981) for the nitrogen index, and Salette and Huché (Reference Salette and Huché1991) for the P and K nutrition indices. They were not assessed in the year 2003 as the pasture production was too low.
Animal performance
Lambs were weighed at birth, and at 10, 30 and 70 days of age, at weaning and at slaughter. Lamb liveweight and growth rate were subjected to ANOVA using the GLM procedure of the Statistical Analysis Systems Institute (SAS) software package (1999) to examine the effect of the production system, lambing period and the interaction between the two factors, and taking into account the effect of sex and breed (Limousine v. Ile de France × Limousine). Ewe productivity was calculated as the number of lambs (lambs sold and ewe lambs used for replacement) produced per ewe per year. Ewe fertility, prolificacy and productivity were subjected to ANOVA to examine the effect of production system.
Carcass characteristics and quality
Measurements were made at 24 h post mortem in 2001, 2002 and 2003. The carcasses were weighed and classified for conformation using the 15-point scale as described by Fisher et al. (Reference Fisher, Enser, Richardson, Wood, Nute, Kurt, Sinclair and Wilkinson2000). Fatness was assessed by weighing perirenal fat. Subcutaneous caudal fat colour (L*a*b*) was measured using a MINOLTA CM-2002 spectrocolorimeter (illuminant D65, Minolta France S.A., Carrieres sur Seine, France). Firmness of subcutaneous dorsal fat was assessed on a 15-scale from 3 (oil fat) to 15 (hard fat). Carcass characteristics were subjected to ANOVA to examine the effect of production system, taking into account the effect of sex and experimental year.
Health evaluation
We recorded ewe and lamb mortality and putative cause of death or slaughtering. We measured nematode digestive-tract strongyles and Moniezia infestation using faecal egg counts (Bentounsi et al., Reference Bentounsi, Attir, Meradi and Cabaret2007). Faecal samples were taken monthly between March and November on five ewes and five lambs. These animals were randomly chosen at the beginning of the grazing season and were then sampled throughout the grazing season, unless they were sold, in which case another animal was randomly chosen. A necropsy was performed in autumn just before the conversion (four ewes and five lambs) and thereafter each year on three lambs and three ewes in each system. The lambs were randomly chosen at the end of the grazing season and the ewes were randomly chosen among those slaughtered for reproductive or age reasons. The abomasum, small and large intestine, were processed according to the Ministry of Agriculture, Fisheries and Food (MAFF, 1986). Nematodes were counted and identified to species. The ewes’ lungs were screened for protostrongylid lungworm nematodes (Cabaret et al., Reference Cabaret, Dakkak and Bahaida1980). In autumn 2000, we screened for Oestrus ovis in lamb sinuses according to Yilma and Dorchies (Reference Yilma and Dorchies1991). Ewe and lamb mortality data were subjected to ANOVA to examine the effect of production system. Faecal egg counts and necropsy data were subjected to ANOVA to examine the effect of production system and the type of animal (ewe v. lamb).
Economic evaluation
Full details of the method used for the calculation of economic data are given in Benoit and Laignel (Reference Benoit and Laignel2006). Briefly, gross margin was calculated as the difference between gross product and variable costs. Gross product was calculated as the sum of animal retail sales plus the various receipts (wool, sheep premiums) minus animal purchases (rams). Variables cost included feed purchases and cereals and peas produced on-farm, fertilisers and seeds for the grassland area, veterinary costs, livestock supplies, services and fees. Feed self-sufficiency was estimated as follows: [(energy requirements of the flock, i.e. ERF)−(energy of the feed purchased)]/ERF. The same ratio was calculated for forage self-sufficiency: [ERF−(energy of the feed purchased and of concentrates produced on-farm)]/ERF. The energy of the feed purchased and ERF were estimated according to INRA (1989). These data were compared with those obtained in 10 organically managed and 16 non-organically managed farms (Laignel and Benoit, Reference Laignel and Benoit2004).
Results
Forages
As stocking rate and pasture management were basically alike in the two systems, forage production and quality were averaged.
Forage production and quality
Forage production reached 6.4 t DM/ha for 2000 and 2001. It decreased dramatically in 2002 (4.2 t DM/ha) and 2003 (3.8 t DM/ha) because of drought conditions. Net energy value of hay (INRA, 1989) averaged 0.65 UFL (Unités Fourragères Lait) over the experimental period. The CP content of hay was 91.5 g/kg DM on average and it decreased over the experimental period from 101 to 82 g/kg DM. This was in line with a decrease in legumes in the pastures, legumes score decreasing from 2.5 to 1.4 and from 1.6 to 1.3 in pastures and rangelands, respectively. Peas were absent in 3 out of the 4 years because of frost.
Forage consumption
This reached on average 320 kg DM hay and 526 kg DM pasture (ewes grazed for 223 days on average). Due to restriction of concentrate distribution to 40% of the stall-fed lambs’ diet, the quantity of hay ingested was high compared with what is observed in lambs fed a diet with 80% concentrate (25 v. 6 kg DM/lamb, Tournadre et al., Reference Tournadre, Dulphy and Jailler2006). This had a strong impact at system scale: forage consumption by lambs was estimated to be 9% of total forage consumed compared with about 2% in non-organic systems raising all lambs indoors (Laignel and Benoit, Reference Laignel and Benoit2004). On an average, forage self-sufficiency was 73.2% and 68.6% and feed self-sufficiency was 78.7% and 75.6% in 1L/1Y and 3L/2Y, respectively.
Mineral balance
No exogenous fertiliser was used, since mineral exportation (N, P) through the meat produced was low (average 235 kg liveweight/ha per year). At system level, on average throughout the experiment, only 5.5 kg N/ha per year and 2.3 kg P/ha per year were exported via meat production, whereas 15.5 kg N/ha per year and 2.7 kg P/ha per year were introduced by feed and straw purchases. The only fertilisation came from compost (on-farm manure), production of which was 125 kg DM (35% DM) per ewe per year, with N/P/K composition 24/8/43 (g/kg DM).
The nitrogen nutrition indice was mid-range in 2000 (69) but low in 2002 (57), reflecting the decrease in legumes in the pastures. The P and K nutrition indices were good (112 and 102 for P, 106 and 99 for K indices, respectively, in 2000 and 2002). Thus, suitable management of organic materials appeared to be sufficient to maintain soil fertility of P and K. N soil fertility was related to legumes in the swards.
Reproductive performance
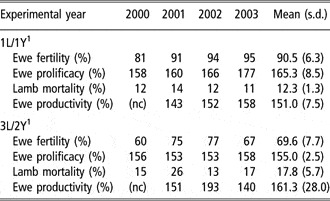
Ewe fertility and prolificacy, and lamb mortality were more favourable in 1L/1Y than in 3L/2Y (Table 1): on an average, ewe fertility was 90.5% in 1L/1Y v. 69.6% in 3L/2Y (P < 0.001), ewe prolificacy was 165.3% in 1L/1Y v. 155.0% in 3L/2Y (P < 0.05) and lamb mortality was 12.3% in 1L/1Y v. 17.8% in 3L/2Y (P < 0.05). As expected, lambing rate was higher in 3L/2Y than in 1L/1Y: over the period 2001 to 2003, 33% of ewes lambed twice per year in 3L/2Y against 4% in 1L/1Y. On an average, ewe productivity was 7% higher in 3L/2Y than in 1L/1Y (161.3% v. 151.0%, ns), and was much more variable in 3L/2Y than in 1L/1Y, ranging from 140% to 193% in 3L/2Y against from 143% to 158% in 1L/1Y (Table 1). Ewe productivity observed in 2002 for 3L/2Y was considered as the highest possible in this reproduction rhythm.
Reproduction performances

11L/1Y and 3L/2Y: one lambing per year and three lambings over 2 years, respectively.
(nc) = not calculated, as the lambing rate was not yet stabilised in 3L/2Y.
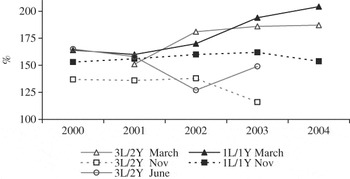
In 3L/2Y, fertility was highest for the October mating (Figure 1), but was low for January mating (ewes in lactation and at the beginning of anoestrus period) and even lower for June mating, when intervals between previous weaning and mating were short. In addition, 95% of the 21 ewes in a mating group were infertile at June 2003 mating, possibly due to the very high temperatures that this group was more exposed to, the fertility of the other group of 30 ewes being 67%.
Ewe fertility according to lambing period. 1L/1Y and 3L/2Y: one lambing per year and three lambings over 2 years, respectively.

In 1L/1Y, ewe prolificacy regularly increased from 2000 to 2003 for both March and November lambing (Figure 2). In 3L/2Y, the same profile was observed for March lambing, but ewe prolificacy was much more widely variable for June and November lambing. Ewe prolificacy was lower in 3L/2Y than in 1L/1Y (P < 0.05), in line with earlier results (Brelurut Reference Brelurut1987), this being mainly due to a lower prolificacy at November lambing (134% in 3L/2Y against 157% in 1L/1Y, P < 0.001), ewe prolificacy being fairly similar in the two systems for March lambing. In June, results were intermediate compared with the other lambing seasons.
Ewe prolificacy according to lambing period. 1L/1Y and 3L/2Y: one lambing per year and three lambings over 2 years, respectively.

Ewe lamb fertility was higher in 1Y/1L than in 3L/2Y (81% v. 59%, P < 0.001), probably because ewe lambs at first mating were older and heavier in 1L/1Y than in 3L/2Y (12.5 v. 10.9 months, P < 0.01 and 44.9 v. 42.3 kg, P < 0.001, respectively).
Lamb characteristics and performance
Single, twin and triple-born lambs accounted for 67%, 27% and 6% of total lambs born. Lambs that could not be suckled by their mothers (6.4% of lambs) were sold at birth. Grazing lambs represented 72% and 53% of total lambs in 3L/2Y and 1L/1Y, respectively. Average concentrate consumption per lamb was 33% higher in 3L/2Y than in 1L/1Y (46 v. 31 kg).
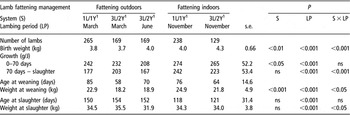
Lamb growth rate between birth and 70 days of age, which mainly corresponded to the suckling period, was higher in 1L/1Y than in 3L/2Y (P < 0.05) (Table 2). As lamb growth rates at November and March lambing were not significantly different between systems (265 and 274 g/day in 3L/2Y and 1L/1Y, respectively, and 232 and 242 g/day in 3L/2Y and 1L/1Y, respectively), the differences came from the low growth rate observed for 3L/2Y lambs born in June (208 g/day). For lambs born in November and reared indoors, growth rate during the post-weaning fattening period after weaning was higher in 1L/1Y than in 3L/2Y, though the difference was of low amplitude (274 v. 265 g/day, P < 0.05). For lambs born in March and reared at pasture, growth rate during the post-weaning fattening period was higher in 3L/2Y than in 1L/1Y (203 v. 177 g/day, P < 0.001), mainly because of between-systems differences in concentrate supplementation level at pasture. However, despite concentrate supplementation of grazing lambs in 3L/2Y, June-born lambs showed a low post-weaning growth rate (167 g/day), possible explanations being (i) competition for good quality pastures with March-born lambs, (ii) parasitism which frequently peaks during summer (Prache et al., Reference Prache, Thériez and Béchet1992), (iii) limited resort to concentrate supplementation linked to ‘organic’ commitments, which limited the possible solutions when animals were faced with low pasture availability/quality or a high level of parasitism (Prache et al., Reference Prache, Thériez and Béchet1992) and (iv) high summer temperatures.
Mean performances of slaughtered lambs according to fattening management, experimental system and lambing period

11L/1Y and 3L/2Y: one lambing per year and three lambings over 2 years, respectively.
Age and liveweight at weaning were different between the two systems due to the different reproduction rhythms (Table 2). This was partly responsible for a higher consumption of concentrate by grazing lambs in 3L/2Y than in 1L/1Y (42.9 and 18.5 kg/lamb, respectively). Mean age at slaughter was fairly similar in the two systems (144 v. 135 days in 3L/2Y and 1L/1Y, respectively).
Carcass characteristics and quality (Table 3)
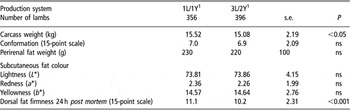
Over the period of 2001 to 2003, a total 356 and 396 lambs in 1L/1Y and 3L/2Y, respectively, were slaughtered. Carcass weight was higher in 1L/1Y than in 3L/2Y (15.52 v. 15.08 kg, P < 0.05). Differences between systems were found in 2003, as carcass weight was similar in the two systems in 2001 and 2002: it averaged 15.7 and 15.6 kg in 1L/1Y and 3L/2Y, respectively, over the period of 2001 to 2002, against only 14.3 and 13.8 kg in 1L/1Y and 3L/2Y in 2003. Fattening and conformations scores, and subcutaneous fat colour were similar in the two systems. Firmness of subcutaneous fat was lower in lambs from 3L/2Y than from 1L/1Y (10.2 v. 11.1, P < 0.001), probably because of a lower age at weaning and a higher concentrate intake level (Priolo et al., Reference Priolo, Micol, Agabriel, Prache and Dransfield2002) in 3L/2Y than in 1L/1Y.
Lamb carcass characteristics and quality

11L/1Y and 3L/2Y: one lambing per year and three lambings over 2 years, respectively.
Due to the time lag of the conversion process, the lambs were sold under the Organic Farming label from the beginning of the year 2002. All lambs with unsatisfactory conformation (below 3) or fatness (below 1 or above 4 on a 5-point scale from 1 ‘very lean’ to 5 ‘very fat’) were excluded from organic farming certification. On these criteria, 67% and 55% of the 1L/1Y lambs were fit for sale on the organic market in 2002 and 2003, respectively. These proportions were similar in 3L/2Y (64% and 60% in 2002 and 2003, respectively).
Animal health
General health status of ewes
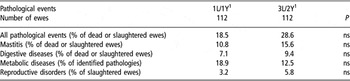
The proportions of the main pathological events observed over the 2000 to 2003 period in dead or slaughtered ewes and their distribution among mastitis and digestive, metabolic or reproductive diseases were not significantly different between the two systems (Table 4).
Main pathological events in dead or slaughtered ewes

11L/1Y and 3L/2Y: one lambing per year and three lambings over 2 years, respectively.
General health status of lambs
Peri-natal mortality (up to 10 days of age) was higher in 3L/2Y than in 1L/1Y (13.6% v. 9.8%, respectively, P < 0.01). This difference was partly due to more stillbirths in 3L/2Y (4.7% v. 2.7% of births in 3L/2Y and 1L/1Y, respectively, P < 0.05), mostly related to abortions in March 2001 (toxoplasmosis, 20 abortions in 3L/2Y v. four in 1L/1Y). After age 10 days, lamb mortality was not significantly different between the two systems (4.7% v. 3.1% in 3L/2Y and 1L/1Y, respectively). Arthritis, enterotoxaemia and pneumonia were the main causes of death, without significant differences in their occurrence between systems. In 3L/2Y, lamb mortality was higher in June than in March and November lambing, although not significantly, probably owing to small sampling (10.6%, 8.0% and 6.6%, respectively), partly because lambing was outdoors in June and indoors in March and November.
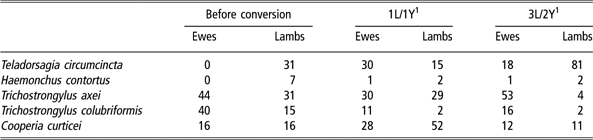
Parasite species in necropsied sheep (Table 5)
The proportions of the main digestive-tract nematode species were not significantly different before and after conversion to organic farming, unless for Teladorsagia circumcincta in ewes, for which there was a tendential increase after the conversion (P = 0.10). There was no significant differences between systems in either ewes or lambs. The proportions of parasite species observed in this study were close to those obtained in organic private farms, except for a higher proportion of Teladorsagia (Cabaret et al., Reference Cabaret, Bouilhol and Mage2002). Moniezia was equally present in both systems. Oestrus ovis was present in most of the lambs in autumn 2000, but at low levels (less than five larvae/lamb) and was not investigated further. Similarly, Muellerius capillaris was present at low levels and was not further investigated.
Proportions of the main digestive-tract nematode species before conversion to organic farming and over the study
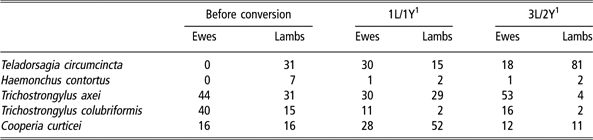
11L/1Y and 3L/2Y: one lambing per year and three lambings over 2 years, respectively.
Faecal egg counts (Table 6)
The excretion of strongyle eggs was higher in 3L/2Y than in 1L/1Y in both ewes and lambs (P < 0.05). The excretion of oocysts (Coccidia) was also higher in 3L/2Y than in 1L/1Y lambs (P < 0.05). The proportion of lambs with Moniezia eggs in their faeces was not significantly different between the two systems.
Faecal egg counts: mean and range

11L/1Y and 3L/2Y: one lambing per year and three lambings over 2 years, respectively.
2For Moniezia, the values indicate the mean (range) proportion of lambs with eggs in their faeces.
Treatments
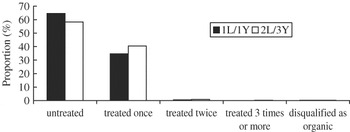
Levamisole or pyrantel tartrate were used for anthelmintic treatments, this choice being based on (i) the digestive-tract nematode species observed in necropsied animals, since they were sensitive to these drugs (Berrag et al., Reference Berrag, Silvestre, Chartier, Gasnier, Laignel, Tournadre, Ballet and Cabaret2001) and (ii) the near absence of Oestrus ovis, Muellerius capillaris and absence of flukes. The lambs were treated against Moniezia using a commercial phytotherapeutic drug, but its efficacy was poor and it can be considered that Moniezia infestation remained practically untreated (Cabaret et al., Reference Cabaret, Gonnord, Cortet, Sauvé, Ballet and Tournadre2005). Very few animals were disqualified from organically raised status for receiving too many synthetic pharmaceuticals (Figure 3). For example, only 0.5% and 0.7% of lambs produced in the year 2002 were so disqualified for 3L/2Y and 1L/1Y, respectively.
Proportion of lambs untreated or treated 1, 2, 3 or more times with synthetic pharmaceuticals, and disqualified from ‘organic’ status. 1L/1Y and 3L/2Y: one lambing per year and three lambings over 2 years, respectively.

Economics
Gross margin
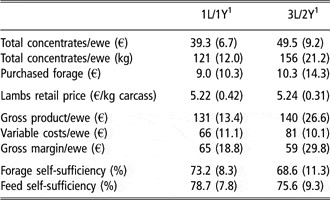
On an average, over the 2001 to 2003 period, gross margin per ewe was 10% higher in 1L/1Y than in 3L/2Y (€65 v. €59, respectively), and it was also less variable, ranging from €49 to €86 in 1L/1Y, against €31 to €90 in 3L/2Y (Table 7). Even in 2002, when ewe productivity was excellent in 3Y/2L (27% higher than in 1L/1Y), the gross margin per ewe was quite similar for the two systems (€90 v. €86 in 3L/2Y and 1L/1Y, respectively, Table 7) because of differences in concentrate costs (€57.5 v. €36.3 in 3L/2Y and 1L/1Y, respectively). In 2003, drought conditions penalised gross margin in both systems owing to increased fodder purchases, but the 3L/2Y flock also suffered a decline in fertility at the November lambing (Figure 1); the gross margin per ewe dropped to €31 in 3L/2Y and €49 in 1L/1Y.
Economic results: mean (s.d.) over the period 2001–2003

11L/1Y and 3L/2Y: one lambing per year and three lambings over 2 years, respectively.
Gross product
On an average, over the 2001 to 2003 period, the gross product was 6% higher in 3L/2Y than in 1L/1Y (€140 v. €131) and was much more variable in 3L/2Y than in 1L/1Y, ranging from €121 to €170 in 3L/2Y, against €120 to €146 in 1L/1Y (Table 7). The main factor that determined the gross product was the number of lambs sold per ewe, which depended directly on ewe productivity, as the sale retail price was the same in the two systems (€5.22 and €5.24 per kg carcass in 3L/2Y and 1L/1Y, respectively), and the carcass weight was only slightly lower in 3L/2Y. In 2002, when ewe productivity was the highest in 3L/2Y, the gross product per ewe was €24 higher in 3L/2Y than in 1L/1Y (€170 and €146, respectively).
On an average, 6.6 (s.d. 6.0) and 6.8 (s.d. 3.5) lambs were sold per fortnight in 1L/1Y and 3L/2Y, respectively. The lower variability in 3L/2Y demonstrates that this system provided better seasonal marketing, with lambs sold in the fourth quarter of the year, when lambs are often scarce on the market.
Variable costs
On an average, over the 2001 to 2003 period, variable costs per ewe were 22% higher in 3L/2Y than in 1L/1Y (€81 v. €66, respectively). Concentrate cost per ewe (concentrate feed bought in or produced on-farm) was higher in 3L/2Y than in 1L/1Y (€49.5 v. €39.3, respectively). For the ‘reference’ year 2002, the between-systems difference in variable costs reached 34% (€79 v. €59 in 3L/2Y and 1L/1Y, respectively), mainly due to concentrate costs (€57.5 v. €36.3 in 3L/2Y and 1L/1Y, respectively). The higher concentrate cost per ewe in 3L/2Y compared with 1L/1Y stemmed mainly from (i) the higher lambing rhythm, which led to higher feed concentrate requirements for the ewes, (ii) the higher number of lambs produced per ewe and (iii) the lower age of the lambs at weaning. In 2002, a total of 178 kg of concentrate feed was consumed per ewe in 3L/2Y against 113 kg in 1L/1Y (including 89 and 65 kg, respectively, for the ewe).
In 2002, the forage deficit linked to a short drought needed forage purchases priced at €7 and €4 per ewe in 1L/1Y and 3L/2Y, respectively (46 and 28 kg per ewe). In 2003, a much harder drought forced forage purchased costing up to €20 and €27 per ewe in 1L/1Y and 3L/2Y, respectively (150 and 197 kg per ewe, i.e., nearly 50% and 60% of stored forage requirements).
Other production costs per ewe (veterinary, livestock supplies, services and fees) were 19% higher in 3L/2Y than in 1L/1Y (€16.3 v. €13.7) with higher veterinary costs (fees and products, €5.6 per ewe v. €4 in 3L/2Y and 1L/1Y, respectively). In 2002, these costs were higher in 3L/2Y than in 1L/1Y (€14.7 v. €13.2). During the conversion period (2000 to 2001), veterinary costs per ewe were three to four times higher than afterwards (2002–2003), mainly due to preventive measures: €7.4 and €10.0 in 1L/1Y and 3L/2Y v. 2.2 and 2.5, respectively.
Discussion
The experimental site had been farmed for the previous 10 years under extensive non-organic management (Thériez et al., Reference Thériez, Brelurut, Pailleux, Benoit, Lienard, Louault and De Montard1997). Although the management had to be adapted, the conversion to organic farming was not therefore a total change. In 1L/1Y, ewe productivity was slightly lower than that previously obtained on this site with non-organic management using hormonal treatment of ewes (151% v. 159%, Thériez et al., Reference Thériez, Brelurut, Pailleux, Benoit, Lienard, Louault and De Montard1997). This was due to a decrease in prolificacy (165% v. 180%) rather than a decrease in fertility (90.5% v. 85.5%). The non-use of hormonal treatment did not therefore penalise out-of-season fertility, but prolificacy. Nevertheless, ewe productivity was high in 1L/1Y even without any hormonal treatment; this probably depends on the sheep breed used.
The prevention strategy we used allowed a sustainable control of parasitism, which is of over-riding importance in organic sheep production. The number of animals disqualified from organically raised status for receiving too many synthetic pharmaceuticals was very low, and concurrently, there was a low parasites selective pressure towards anthelmintics.
Comparison between the two organic production systems
Despite a large between-system difference in the planned reproduction rhythm, ewe productivity was only 7% higher in 3L/2Y than in 1L/1Y. This low between-system difference in ewe productivity was mainly due to: (i) high sollicitation of the 3L/2Y ewes with a negative impact on their fertility, (ii) in June, low feed quality and lower ewe fertility, and (iii) lower health status in 3L/2Y, with higher lamb mortality and higher parasitism level. In addition, ewe productivity was much more variable in 3L/2Y than in 1L/1Y, the ewe fertility being highly variable and sometimes very low in 3L/2Y for November and June lambings. In this study, we chose the same breed for both systems to maximise common factors. One can envisage to use a specific breed in each system, as the aim and strategies were specific to each one (Nauta et al., Reference Nauta, Baars, Saatkamp, Weenink and Roep2008). In particular, it could be relevant to consider a breed with a better out-of-season reproduction potential in 3L/2Y to ensure better and more regular fertility in June and November lambings.
Although 3L/2Y offered better seasonal marketing of lambs, its gross margin was lower on average and more variable than that of 1L/1Y, mainly because of higher concentrate inputs. Also, carcass weight and quality were lower in 3L/2Y than in 1L/1Y. In today’s economic climate, marked by a strong increase in the price of major inputs (concentrates, cereals and energy), the economic advantage of 1L/1Y would be even greater as this system is more self-sufficient for feed; this property should lend it a better energy balance (Benoit and Laignel, Reference Benoit and Laignel2008).
Lastly, 3L/2Y entailed more difficult management due to the greater number of animal batches and higher between-batch competition for good quality pastures at some periods. In this system, the most difficult period was June, with strong competition for quality pastures between grazing lambs, lactating ewes and mated ewes. Also, ewes lambing in June faced enhanced parasitism probably due to low ewe protective immunity after lambing. We can consider that 1L/1Y responded better to societal concerns for animal welfare, of which a major component is animal health (Hermansen, Reference Hermansen2003). The 1L/1Y animals had a better overall sanitary status, with lower lamb mortality and lower parasitism. The underlying problem of animal illness raises ethical and economic issues. High animal welfare status can therefore gain consumer confidence and justify premium price (Sundrum, Reference Sundrum1999).
Consideration of soil fertility maintenance suggests that both systems were sustainable from that point of view. However, the search for feed self-sufficiency, with the cultivation of cereal mixtures providing a third to half the concentrate requirements, resulted in low feed purchases compared with the previous non-organic extensive system (Thériez et al., Reference Thériez, Brelurut, Pailleux, Benoit, Lienard, Louault and De Montard1997). Hence the contribution of these inputs to the mineral balances was much lower, and was not offset by the purchase of organic fertilisers. Over the long term, this could cause a decline in soil fertility (Mogensen et al., Reference Mogensen, Kristensen and Danfaer2007), which would require careful consideration of the most efficient use of manure and nutritional indices as a tool for fertilisation management, and the development of legume species in pastures. As 1L/1Y reached a better feed self-sufficiency than 3L/2Y, there may be a greater risk of long-term mineral depletion in this system.
Comparison with private farms
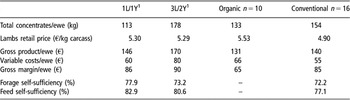
We compared the technical and economic results of the present study with those obtained in 2002 in 10 organic and 16 non-organic private farms in the same area by Laignel and Benoit (Reference Laignel and Benoit2004) (Table 8). Ewe productivity in this study was higher than that in the organic private farms (152% and 161% in 1L/1Y and 3L/2Y, respectively, compared with 135% on average in private farms). Ewe productivity of 3L/2Y in the present study was close to that obtained in six non-organic farms that used a similar reproduction rhythm (163% on average).
Economic results in year 2002: comparison with conventional and organic private farms

11L/1Y and 3L/2Y: one lambing per year and three lambings over 2 years, respectively.
The organic farms obtained a higher mean lamb carcass weight (16.2 v. 15.1 kg and 14.7 kg in 1L/1Y and 3L/2Y, respectively). In all, 70% of the lambs produced in organic private farms were sold on the organic market, compared with 67% and 64% in 1L/1Y and 3L/2Y, respectively. Conventional farm lambs had a higher carcass weight (16.9 kg), but were sold at a lower retail price (€4.90/kg compared with €5.53/kg in organic private farms and €5.30/kg in the present study). Concentrate consumption averaged 133 kg and 154 kg per ewe in organic and non-organic private farms, respectively, compared with 113 and 178 kg per ewe in 1L/1Y and 3L/2Y, respectively. The low concentrate consumption in 1L/1Y was due to the high level of pasture use and high forage self-sufficiency. The high level of concentrate consumption in 3L/2Y was due to a very high ewe productivity that year. However, concentrate consumption levels are of over-riding importance in organic farming, given the price of bought-in concentrate feed (€0.20 per kg for conventional farms v. €0.32 per kg in the present study).
Benoit and Laignel (Reference Benoit and Laignel2002) observed a marked difference in health costs between organic and non-organic private farms, together with a high between-organic farms variability. In the present study, health costs per ewe remained low (€2.5 in 2002 to 2003 v. €4.0 in organic or non-organic private farms), matching that observed in well-managed organic private farms.
In 2002, the gross margins obtained in the present study (€86 and €90 per ewe in 1L/1Y and 3L/2Y, respectively) were comparable to those of non-organic farms (€85 per ewe) and much better than those of organic farms (€65 per ewe). These data demonstrate that the economic results of the two organic systems studied rivalled those of non-organic farms in the same area and were much better than those of organic farms, which frequently have excessively high concentrate inputs and high health costs.
Conclusions
Our main finding is that intensification in sheep organic farming for meat production through an increased reproduction rhythm did not lead to better economic results and proved riskier, more variable and more difficult to manage, and therefore less sustainable. We emphasise that the less intensive system, in terms of reproduction rhythm (1L/1Y), remained both highly efficient from the animal standpoint, with a fairly good ewe productivity, and highly self-sufficient for feed. The technical and economic results of the 1L/1Y organically managed system matched those of non-organic farms in the same area, but the organic system better fitted societal demand for ‘natural’ products, with a better environmental impact.
Acknowledgements
This study was funded by FEOGA Massif Central and CIAB (INRA). We thank M. Petit, F. Bocquier, M. Bouilhol, J. Barnouin, P. Jacquiet and H. Hoste for valuable advice in the study design, and J. Y. Pailleux, M. Verdier, R. Jailler, Y. Thomas, A. Guittard, J. Cortet, C. Sauvé and J. P. Chacornac for their technical assistance. We thank several students for their help: M. F. Millord, P. Treissac, L. Simmoneau and V. Gonnord.