


1. Introduction
The preservation of overpressure is a critical prerequisite for shale gas enrichment, serving as a key indicator of effective sealing conditions (Qiu et al. Reference Qiu, Feng, Borjigin, Shen, Ma, Yu and Cao2020; Luo et al. Reference Luo, Guo, He, Omosanya, Tao and He2024 a, Reference Luo, Guo, He, Zhao, Tao, Dong, Yang and Chen2024 b; Nie et al. Reference Nie, Zhang, Jin, Liu, Li, Dang, Li, Bian, Sun, Zhang and Su2024). The initial formation of such shale overpressure is primarily controlled by internal factors including disequilibrium compaction, smectite-to-illite transition and hydrocarbon generation (Guo et al. Reference Guo, He, Liu and Zheng2011; Krushin, Reference Krushin2014; Dasgupta et al. Reference Dasgupta, Chatterjee and Mohanty2016; Qin et al. Reference Qin, Han and Zhao2019; Wang et al. Reference Wang, Hu, Qiu, Liu, Jia, Cao, Liu and Li2022; Jarosiński et al. Reference Jarosiński, Bobek, Głuszyński, Sowiżdżał and Słoczyński2023). However, these overpressure systems are highly susceptible to tectonic events, particularly exhumation, which can fundamentally alter reservoir preservation potential (Engelder and Behr, Reference Engelder and Behr2021; Jarosiński et al. Reference Jarosiński, Bobek, Głuszyński, Sowiżdżał and Słoczyński2023). Exhumation not only modifies the thermal and pressure regimes of strata but, more critically, can induce widespread brittle deformation and natural hydraulic fracturing (NHF). This process may enhance permeability in some contexts but more often catastrophically breaches seal integrity, leading to overpressure dissipation and hydrocarbon escape (Ohm et al. Reference Ohm, Karlsen and Austin2008; English et al. Reference English, English, Corcoran and Toussaint2016; Makuluni et al. Reference Makuluni, Johnson, Hauser, Langhi and Clark2021). Therefore, although static geological factors are widely studied, exhumation-induced stress evolution remains a core unquantified factor for overpressure preservation. Consequently, reconstructing the pore pressure evolution history is not merely a technical exercise but fundamentally hinges on a precise quantification of the exhumation process, which is essential for derisking exploration strategies.
The southern Sichuan Basin (SSCB) features a unique transitional tectonic regime where intense, multi-stage exhumation profoundly impacts deep shale gas preservation (Liu et al. Reference Liu, Wu, Jiang, Zhou, Luo, Wu, Li, Liu and Deng2021). Within this basin, the Lower Cambrian Qiongzhusi Fm., one of the world’s oldest shale gas plays, boasts massive resource potential confirmed by recent high-yield discoveries (Yong et al. Reference Yong, Wu, Wu, Yang, Xu, Luo, Liu, He, Zhong, Li, Zhu and Chen2024, Reference Yong, Wu, Liu, Zhao, Liu, Zhang, Shen, Xie, Li and Tian2025; Guo et al. Reference Guo, Deng, Zhao, Wei and He2025; Nie et al. Reference Nie, Liu, Jin, He, Liu, Zhai, Li, Dang, Zhang and Han2026). For instance, recent breakthrough wells within the structurally favourable zones of the SSCB (e.g. Well Z201) have achieved remarkable peak daily gas productions exceeding 738 800 m3. In stark contrast, exploration attempts in heavily exhumed and intensely faulted regions outside the basin, such as Guizhou Province (e.g. Wells HY1 and TX1), have largely failed to yield commercial gas flows despite their high organic carbon contents (Nie et al. Reference Nie, Liu, Jin, He, Liu, Zhai, Li, Dang, Zhang and Han2026). This stark coexistence of commercial success and failure, which is directly governed by differential exhumation and preservation conditions, makes the SSCB an ideal natural laboratory for investigating the fundamental mechanisms of overpressure preservation.
Compared with the younger, commercially successful Wufeng-Longmaxi Fm., the Qiongzhusi Fm. has undergone a significantly greater maximum burial depth and a more protracted exhumation history, necessitating far more stringent preservation conditions. The Wufeng-Longmaxi Fm. shale in SSCB exhibits well-developed fractures, mostly calcite-filled, with the largest vein width reaching 6 cm (Wu et al. Reference Wu, Chen, Liu, Wu, Gao, Luo, Deng and Zhou2022). Furthermore, exploration targeting this formation has been ongoing for over a decade, resulting in abundant core data. Significant fluid inclusion pressure and vein dating data from shale gas fields such as Luzhou (Yao et al. Reference Yao, Fu, Ma, Yan, Wang, Li and Wang2022; Cui et al. Reference Cui, Li, Guo, Lin, Hu, Han, Qian and Zhao2023), Changning (Liu et al. Reference Liu, Wu, Jiang, Zhou, Luo, Wu, Li, Liu and Deng2021; Wu et al. Reference Wu, Chen, Liu, Wu, Gao, Luo, Deng and Zhou2022) and Fuling (Luo et al. Reference Luo, Guo, He, Omosanya, Tao and He2024 a, Reference Luo, Guo, He, Zhao, Tao, Dong, Yang and Chen2024 b) in SSCB have been used to constrain the pore pressure evolution history. In stark contrast, the deeper, Qiongzhusi Fm. has limited core data, smaller fracture widths and difficulties in obtaining test data such as inclusion trapping pressures and calcite dating. Core data from the Qiongzhusi Fm. reveal that fractures are predominantly high-angle shear fractures, with widths generally less than 0.5 mm (Yong et al. Reference Yong, Wu, Liu, Zhao, Liu, Zhang, Shen, Xie, Li and Tian2025). Limited methane and aqueous inclusion analyses indicate pore pressures of 65–116 MPa (Li et al. Reference Li, Wu, Zhou, Jiang, Shi, Yang, Luo, He, Wang, Liang and Deng2025) and overpressure of 10–50 MPa in the Weiyuan and Ziyang area. The Qiongzhusi Fm. is stratigraphically divided into Member 1 and Member 2, with Member 1 further subdivided into Sub-member 1 and Sub-member 2. Notably, the current pressure coefficients in Sub-member 2 (characterized by high gas-in-place contents) span a wide range from 1.0 to 2.2 (Yong et al. Reference Yong, Wu, Wu, Yang, Xu, Luo, Liu, He, Zhong, Li, Zhu and Chen2024; Guo et al. Reference Guo, Deng, Zhao, Wei and He2025), reflecting significant pore pressure fluctuations with a poorly understood evolution mechanism. Did areas with lower pressure coefficients experience high intense exhumation? To what degree of exhumation will lead to the destruction of overpressure conditions? The fundamental mechanisms linking differential exhumation to the observed heterogeneity in preservation states remain poorly constrained, primarily due to the lack of vein samples and quantitative exhumation data.
To investigate the exhumation process of the Qiongzhusi Fm. and its control on overpressure preservation, this study reconstructed the comprehensive exhumation, thermal and pore pressure evolution histories through the integration of vitrinite reflectance (VR), acoustic transit time (AC) data, low-temperature thermochronology, basin and petroleum system modelling (BPSM), and Skempton’s poroelastic relaxation model (SPRM). Our results not only explain the present-day pressure differentials but also provide a predictive model for identifying preserved overpressured sweet spots.
2. Geological setting
The Sichuan Basin (SCB) is located on the eastern margin of the Qinghai-Tibet Plateau and the western margin of the Yangtze Block (Figure 1a, Liu et al. Reference Liu, Deng, Li and Sun2011, Reference Liu, Wu, Jiang, Zhou, Luo, Wu, Li, Liu and Deng2021). The SSCB refers to the region east of the Daliang Mountain, south of the Leshan-Longnvsi ancient uplift, west of the Huaying Mountain and north of the Dalou Mountain, covering an area of about 40 000 square kilometres (Figure 1b, Zhu et al. Reference Zhu, Chen, Liu, Shi, Wu, Luo, Yang, Yang and Zou2021). The SCB has experienced multiple unconformities (Figure 1c–d) since the Paleozoic, including the Caledonian movement, Indosinian movement, Yanshan movement and Himalayan movement (Liu et al. Reference Liu, Deng, Zhong, Ran, Yong, Sun, Yang, Jiang and Ye2016, Reference Liu, Sun, Zhong, Deng, Song, Ran, Luo and Han2017). In SSCB, different from the abrupt margin-plate systems, such as those in northern and northwestern SCB, the gradual interior-plate systems in SSCB has caused the extensional deformation of the detachment structures in the Xuefeng intracontinental orogenic belt (XFIOB) to extend from the southeast to the northwest into the basin interior (Liu et al. Reference Liu, Deng, Li and Sun2011; Deng et al. Reference Deng, Liu, Qin, Li, Luo, Li, Li and Gou2015). This has led to the multi-stage nature of uplift and exhumation in SSCB, with significant temporal and spatial differences in uplift and exhumation among different regions (Deng et al. Reference Deng, Liu, Wang, Li, Liu and Cao2013; Liu et al. Reference Liu, Deng, Zhong, Ran, Yong, Sun, Yang, Jiang and Ye2016; Qiu et al. Reference Qiu, Feng, Borjigin, Shen, Ma, Yu and Cao2020). In addition, all existing surface apatite fission track (AFT) data in SSCB have undergone complete annealing during the burial period (Deng et al. Reference Deng, Liu, Wang, Li, Liu and Cao2013; Qiu et al. Reference Qiu, Yan, Tang, Wang, Yang, Tang and Wang2016; Qiu et al. Reference Qiu, Feng, Borjigin, Shen, Ma, Yu and Cao2020), and the uplift amplitude since the maximum burial period generally exceeds 2000 m, which restricts the research on the stages and maximum amplitude of uplift.
(a) Overview of the study area’s location. (b) Map of the SSCB, showing the outcrops of strata and structures. (c) The regional chronostratigraphic chart of the SSCB shows the various lithologies within the study region; the red wavy lines represent the unconformity surface, suggesting major exhumation events. (d) N-S seismic profiles in the SSCB.

In the Middle Silurian, the Caledonian movement caused overall uplift centred on the Leshan-Longnvsi ancient uplift in the SCB. The core area of this ancient uplift has been eroded down to the Cambrian, with the Silurian and Permian unconformably overlaid in SSCB (exhumation amount 0–700 m, Yuan et al. Reference Yuan, Sun, Li and Lin2013; Gu et al. Reference Gu, Liu, Zhang, He, Li, Hao, Jiang and Li2023; Wang et al. Reference Wang, Xie, Jiang, Su, Huang, Gu, Ma, Shi and Jiang2023). At the end of the Middle Permian, influenced by the Dongwu movement and the lowering of sea levels during the ice age, exhumation occurred at the top of the Maokou Fm. in the Middle Permian, resulting in an unconformable contact between the Middle and Upper Permian (exhumation amount 0–200 m in SSCB Jiang et al. Reference Jiang, Lu, Lyu and Yang2014; Jiang et al. Reference Jiang, Hu, Jiang, Zhai, Ren, Chen, Li and Zhang2018). At the end of the Middle Triassic, the Indosinian movement caused overall uplift of SCB, resulting in exhumation at the top of the Middle Triassic and an unconformable contact with the Upper Triassic (exhumation amount 50–400 m in SSCB; Zhu et al. Reference Zhu, Xu, Shan, Yuan, Zhao and Hu2009; Nie et al. Reference Nie, Zhang, Jin, Liu, Li, Dang, Li, Bian, Sun, Zhang and Su2024). Since then, the SCB has transitioned from marine to continental sedimentation. Since the Late Cretaceous, the SCB has undergone multiple episodes of uplift due to tectonic movements such as the Yanshan and Himalayan periods, resulting in widespread exhumation of over 1000 m on the surface (Deng et al. Reference Deng, Liu, Liu, Li and Zhao2009).
The exposed strata in SSCB are predominantly Jurassic, with remnants of Cretaceous strata within the basin and Triassic-Cambrian strata exposed outside the basin. Completion reports, log data and outcrop profiles in SSCB show that the Middle Triassic and its lower strata are predominantly composed of limestone, mudstone and shale, although the Upper Triassic and its overlying strata are mainly of mudstone, siltstone and sandstone.
3. Samples and methods
3.a. Samples
Four AFT samples were collected from wells located in the SSCB (Supplementary Table S1). These samples originate from distinct stratigraphic units: the Shaximiao Fm. (M. Jur.) in Well ZTA, the Shaximiao Fm. (M. Jur.) in Well ZE, the Ziliujing Fm. (L. Jur.) in Well TA and the Xujiahe Fm. (U. Tri.) in Well NC. We collected 11 apatite (U-Th)/He (AHe) and 8 zircon (U-Th)/He (ZHe) samples from 10 wells, including Well ZE (Supplementary Table S1). Notably, the four AFT samples were derived from the exact same rock samples as four of the AHe samples. Most samples target the Xujiahe Fm. (U. Tri.) and Shaximiao Fm. (M. Jur.), with a limited number sourced from the Qixia Fm. (M. Perm.). Detailed relationships among these samples, including sampling depths, formations and Well information, are provided in Supplementary Table S1. VR measurements were conducted on samples collected from 12 wells (e.g. Well ZE). The sampled intervals span multiple key stratigraphic units: the Ziliujing Fm. (L. Jur.), Xujiahe Fm. (U. Tri.), Feixianguan Fm. (L. Tri.), Longtan Fm. (U. Perm.) and Liangshan Fm. (L. Perm.).
We used AC data from 36 wells in SSCB. It should be noted that the permeability of mudstone formations is low, and fluids in the pores often cannot be smoothly discharged, resulting in under-compaction. The variation of porosity with depth in under-compacted formations does not follow the Athy (Reference Athy1930) standard compaction curve. For example, in the upper Triassic, upper Permian, Silurian and Ordovician mudstone sections of Well GSB (with high gamma ray (GR) values), the AC data is generally abnormally high, as shown in Figure 2. In the process of calculating the compaction-based exhumation amount, the AC data of the Middle Jurassic to Cretaceous systems are mainly used.
AC and GR data from Well GSB and Well LUE.

3.b. Methods
3.b.1. Low-temperature thermochronology
The closure temperatures of the apatite and zircon (U-Th)/He systems are ∼65–85°C (Wolf et al. Reference Wolf, Farley and Kass1998; Farley, Reference Farley2000; Qiu et al. Reference Qiu, Reiners, Mei, Jiang, Stefan and Tao2009) and ∼170–190°C (Reiners et al., Reference Reiners, Spell, Nicolescu and Zanetti2004), respectively, with their corresponding helium partial retention zones (HePRZs) being ∼40–85°C and ∼120–180°C (Wolf et al. Reference Wolf, Farley and Kass1998; Stockli, Reference Stockli2005). The closure temperature of the AFT system is ∼100–120°C (Ketcham et al. Reference Ketcham, Donelick and Carlson1999), and its corresponding partial annealing zone (PAZ) is ∼60–120°C (Galbraith and Laslett, Reference Galbraith and Laslett1993). Therefore, the comparison of low-temperature thermochronology based on different systems can reveal the characteristics of the shallow surface anticline deformation process and the sample uplift and exhumation process.
Apatite and zircon grains were separated from crushed rock samples using conventional heavy liquid and magnetic separation techniques. Under a binocular microscope, euhedral, transparent and inclusion-free grains were hand-picked. Between three and five single crystals of apatite or zircon with intact morphologies and similar sizes were selected for (U-Th)/He analysis. Each grain was photographed and measured to determine F t correction factors for alpha ejection (Farley et al. Reference Farley, Wolf and Silver1996). Helium extraction was performed using a Patterson 960 nm laser degassing system at the Institute of Geology, China Earthquake Administration. Selected grains were encapsulated in capsules and heated using a Patterson 960 nm laser degassing system to extract 4He from apatite/zircon crystals. Extracted He is purified, spiked with 3He for isotope dilution and quantified via quadrupole mass spectrometer. After degassing, the apatite/zircon grains were then dissolved in HNO3/HF-HNO3 solutions. Then U and Th concentrations were determined by inductively coupled plasma mass spectrometry (ICP-MS). The (U-Th)/He ages and effective uranium (eU) concentrations were calculated using standard procedures (Farley et al. Reference Farley, Wolf and Silver1996; Vermeesch, Reference Vermeesch2008).
Apatite grains were hand-picked under a binocular microscope, mounted in epoxy, and polished to expose internal grain surfaces. The mounts were etched in 5 M HNO3 at room temperature for 20 s to reveal spontaneous tracks. Spontaneous track densities were determined by optical microscopy under transmitted light at 1000× magnification. After track counting, the same grain mounts were analysed for U concentrations by Laser Ablation Inductively Coupled Plasma Mass Spectrometry (LA-ICP-MS). LA-ICP-MS analyses were conducted using a 193 nm ArF excimer laser coupled to a quadrupole ICP-MS. Ablation spots (22 µm in diameter) were targeted within the track-counted areas to ensure representative sampling of the same domain. Apatite fission-track ages were calculated using the zeta (ζ) calibration method.
3.b.2. Vitrinite reflectance
Organic particles were embedded in epoxy resin, and then polished blocks were prepared by grinding and polishing following the industry standard SY/T 5124-2012. VR was measured using a Zeiss polarizing microscope and a J&M spectrophotometer micrometer. Calibration was performed using gadolinium-gallium-garnet (1.721%) and cubic zirconia (3.130%) standards. Random reflectance measurements were conducted in oil with a refractive index of 1.518, with no fewer than 20 measurements per sample, and the final result was taken as the average.
3.b.3. Compaction method
The compaction method calculates the exhumation amount (Figure 3a–d), mainly using the principle of exponential decay of porosity with increasing burial depth (Athy, Reference Athy1930) and the irreversibility of mechanical compaction. Many studies indicate that AC is a function of porosity in uniform lithology, and in relatively shallow intervals of sedimentary basins, porosity and AC exhibit a linear relationship, where AC also exponentially relates to depth (Magara, Reference Magara1976; Heasler and Kharitonova, Reference Heasler and Kharitonova1996; Corcoran and Mecklenburgh, Reference Corcoran and Mecklenburgh2005):
 $T = {T_0}{e^{ - bx}} + c$
Evolution of porosity vs. depth trends in exhumed sedimentary basins (modified from Corcoran and Dore, Reference Corcoran and Doré2005); (a) normal compaction (exponential decay of porosity with burial depth, under hydrostatic conditions) in subsiding basin – the reference curve; (b) exhumation leads to anomalous porosity vs. depth trend with vertical displacement from the reference curve yielding (E G), an estimate of gross exhumation; (c) post-exhumation re-burial (B E) reduces the vertical displacement between the anomalous curve and the reference curve to E N, the net exhumation at a given well location; (d) the new sedimentary layers exceed the exhumation thickness, obscuring the original maximum compaction depth, rendering compaction methods unsuitable for calculating exhumation.

T is the AC. T 0 is the surface value (x = 0) of the independent variable. x is the depth. b is the exponential change constant, and c is the offset constant (approximately the propagation AC in the rock matrix). At depth 0, which is the surface in this equation, the AC is T = T 0 + c = 180 μs/ft (approximate value of the AC in surface sediments). Applying AC to calculate exhumation requires comparing the target well AC versus the depth curve with the uneroded ‘normal compacted reference curve’. However, exhumation is widespread in SCB, making it difficult to directly obtain the ‘normal compacted curve’. This study uses the original surface AC, i.e. x = 0, T = 180 μs/ft, as the calibration standard to fit the normal compacted curve of different wells.
It should be noted that, except as mentioned above, under-compacted formations are not suitable for calculating exhumation using compaction methods. When new sedimentary layers on unconformities exceed the exhumation amount, the compaction depth reaches a new maximum, obscuring the compaction degree of this unconformity (Figure 3d). Therefore, compaction methods are also not suitable for calculating exhumation in this scenario (Magara, Reference Magara1976; Fu et al. Reference Fu, Li, Lu and Fu2004). Calculations of exhumation on unconformities before the Late Triassic are similarly not applicable.
4. Results
4.a. Low-temperature thermochronology
Four AFT samples were obtained from the apatite samples of the wells, with 29–37 grains tested for each sample (Supplementary Table S1). The single-grain AFT ages of all samples are much younger than the stratigraphic deposition age. Measured track lengths range from 3 to 130 counts per sample, yielding central ages between 27 and 40 Ma. These results indicate complete burial annealing (with burial temperatures >120°C) followed by subsequent uplift and cooling. The samples exhibit total track lengths of 7.64–15.8 μm, with mean track lengths of 11.6–13.6 μm – values substantially shorter than the initial track length (16 ± 1 μm). This suggests that the samples underwent a prolonged annealing process while remaining in the partial annealing zone.
In addition, 46 single-grain AHe ages were obtained from 11 apatite samples, ranging from 0.6 to 36 Ma; 31 single-grain ZHe ages were obtained from 8 zircon samples (Supplementary Table S1), with ZHe ages ranging from 3.5 to 272 Ma. The AHe ages from the same well are significantly younger than their corresponding AFT ages and ZHe ages. For example, the average AHe age of the Shaximiao Fm. in Well ZE is 24.8 Ma, with a corresponding AFT age of 39.3 Ma; the average AHe age of the O1 l horizon in Well WHA is 3.93 Ma, with a corresponding ZHe age of 71.21 Ma. This indicates that the strata passed through different closure temperature intervals at a relatively slow cooling rate, and it can be preliminarily determined that the current exhumation pattern in SSCB is as shown in Figure 4b. The low-temperature thermochronological data distributed at different vertical depths provide favourable constraints for the inversion of the time-temperature path of the cooling history. It is worth noting that both AFT and AHe have undergone complete burial annealing, and the grain ages record the time when the samples last passed through the AFT and AHe partial retention zones. The ZHe ages in the area north of the Weiyuan Anticline (Well ZTA, Well JTA) are significantly close to or older than the stratigraphic deposition age, indicating that the samples have not undergone complete annealing after burial, and their burial temperature did not exceed the closure temperature of the ZHe system; the ZHe ages in the Weiyuan, Zigong and Changning areas at similar present depths all underwent complete annealing during the burial period.
Burial-thermal evolution profile in the SSCB: (a) This figure illustrates the relationship between AHe and ZHe ages and present-day stratigraphic depth. The dashed lines denote the stratigraphic deposition ages of each well. (b) It depicts the relationship between vitrinite reflectance (VR) and present-day depth. The black solid line represents the VR-depth trend under normal sedimentary settings (Ohm et al. Reference Ohm, Karlsen and Austin2008), although the three dashed lines, from bottom to top, correspond to positions with depth reductions of 2000, 3000 and 4000 m, respectively.

Regional terrestrial heat flow and temperature measurement data from oil and gas exploration wells indicate that the surface temperature and geothermal gradient in SSCB are 20°C and 25∼35°C/km, respectively (Hu et al. Reference Hu, He and Wang2000; Zhu et al. Reference Zhu, Xu, Yuan, Zhao, Shan, He, Tian and Hu2010; Xu et al. Reference Xu, Zhu, Tian, Rao and Hu2011). Among them, the age of the zircon sample (ZHe) from Well ZTA (∼202.59 Ma) is very close to the depositional age of the T3 x (208–201 Ma) where it occurs (Figure 4a). Taking the key constraint that the sample did not reach the ZHe closure temperature, and assuming that the ancient surface temperature was similar to the present surface temperature (20°C), the uplift cooling amplitude of the sample (i.e. the cooling from the maximum burial temperature to the present temperature of 86°C) can be estimated as the difference between the lower limit of the closure temperature (170°C) and the present temperature to the difference between the upper limit (190°C) and the present temperature, i.e. approximately 84∼104°C. Similarly, the zircon sample from Well JTA was taken from the T3 x at a depth of 3000 m, which did not undergo complete annealing after burial. The present formation temperature is about 110°C, and the uplift cooling amplitude is approximately 60∼80°C. However, the ZHe ages in Weiyuan (Well WHA at 1900 m, Well WHB at 2150 m), Zigong (Well ZE at 2840 m) and Changning (Well NC at 2800 m) at similar depths are significantly younger than the depositional age, all of which underwent complete annealing during the burial process, and their uplift cooling amplitudes are greater than those in the area north of Ziyang.
4.b. Vitrinite reflectance
Vitrinite identification and oil-immersed optical reflectance measurement were conducted on the main organic-rich mudstone of each well. The relationship between the measured average VR and sampling depth is shown in Figure 4b. The test results show an obvious increasing trend with depth, generally ranging from 0.77% to 3.28% (Figure 4b). Among them, the minimum average VR comes from the T3 x of Well ZB, and the maximum comes from the P1 q of Well JYTA. For reference, the average level of VR from wells in the Haltenbanken and northern North Sea (Ohm et al. Reference Ohm, Karlsen and Austin2008), as well as their projections shifted upwards by 2000 m, 3000 m and 4000 m, are plotted in Figure 4b. There are significant differences in VR among different wells from central SCB to SSCB, and these values are higher than the average levels in the Haltenbanken and northern North Sea.
At the same present depth, the VR of Well ZTA is obviously at the lowest level, indicating that it has undergone the minimum amount of exhumation after reaching the maximum burial depth, with the overall trend shifting upwards by approximately 2000 m relative to the average level. The VR-depth trends of the wells in the Luzhou and Weiyuan areas are generally distributed in the interval where the average level shifts upwards by about 3000–4000 m. The wells in the Tiangongtang and Changning areas are distributed in the interval where the average level shifts upwards by approximately 4000 m. This characteristic reflects the relative features of exhumation degrees in the SSCB, among which Changning, Weiyuan and Luzhou are three exhumation centres. Between these exhumation centres lie relatively low exhumation zones; for example, the VR of Well LUA (southern Luzhou) and Well WC (southern Weiyuan) are significantly lower than that of the wells in Luzhou and Weiyuan.
4.c. Compaction method
The fitting of normal compaction curves for Jurassic mudstone–sandstone mixed lithology was completed using Excel and Origin software. The actual calculation process involves adding the present burial depth (x) to a predetermined exhumation amount (E 0) to obtain the maximum burial depth (B max = x + E 0). In Origin, Eq. (1) serves as the functional model for the relationship between maximum burial depth (B max) and AC (T), iterating multiple times to preset exhumation amounts, so that when the fitting curve x = 0, T approximates 180 μs/ft. The coefficient c represents AC in rocks with zero porosity, ranging from 39 μs/ft for limestone to 68 μs/ft for shale (Magara, Reference Magara1976; Heasler and Kharitonova, Reference Heasler and Kharitonova1996). Additionally, several studies indicate compaction coefficients b for mudstone–sandstone mixed lithology and pure mudstone compaction curves ranging from 2.0 × 10⁻⁴ to 5.6 × 10⁻⁴ (Figure 5b), based on well AC data from the Bighorn Basin (Heasler and Kharitonova, Reference Heasler and Kharitonova1996), Irish Sea Basin (Ware and Turner, Reference Ware, Turner, Doré, Cartwright, Stoker, Turner and White2002), Rockall Basin and Porcupine basins (Corcoran and Mecklenburgh, Reference Corcoran and Mecklenburgh2005).
Generate an approximation of the normal compaction reference curve for the SSCB. Best-fit AC vs. depth curves for wells in the SSCB (a), then averaged to yield the normal compaction reference curve in (b), T = 120.15e−0.0002x + 59.75. The underlying assumption is that the AC vs depth relationship of the Jurassic mixed lithologies (mudstone and sand) in the SSCB follows the functional form T = T 0e−bx + c.

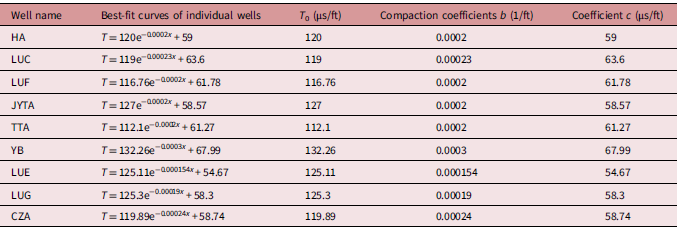
Due to the significant scatter in the AC logging curves, there exist varying degrees of calculation errors in the best-fit curves of individual wells compared with the true compaction curves. The compaction coefficients for individual wells in the SSCB range between 1.54 × 10⁻⁴ and 3 × 10⁻⁴ (Figure 5a, Table 1), although in the Bighorn Basin they range from 2.17 × 10⁻⁴ to 3.98 × 10⁻⁴ (Heasler and Kharitonova, Reference Heasler and Kharitonova1996). Therefore, the average fitting curve of nine individual wells in the SCB is taken to derive the normal compaction reference curve for the SCB, T = 120.15e−0.0002x + 59.75, which is compared with the Jurassic AC in each well to calculate exhumation (Figure 3b).
Best-fit curves of individual wells in the SSCB

Table 1. Long description
A table titled ʼBest-fit curves of individual wells in the SSCBʼ with nine rows and four columns. The columns are labeled ʼWell-nameʼ, ʼBest-fit curves of individual wellsʼ, ʼT0 (us/ft)ʼ, and ʼCompaction coefficients b (1/ft)ʼ and ʼCoefficient c (us/ft)ʼ. The table compares these values for different wells. Row 1: Well-name, HA; Best-fit curves of individual wells, T = 120e^-0.0002x + 59; T0 (us/ft), 120; Compaction coefficients b (1/ft), 0.0002; Coefficient c (us/ft), 59. Row 2: Well-name, LUC; Best-fit curves of individual wells, T = 119e^-0.00023x + 63.6; T0 (us/ft), 119; Compaction coefficients b (1/ft), 0.00023; Coefficient c (us/ft), 63.6. Row 3: Well-name, LUF; Best-fit curves of individual wells, T = 116.76e^-0.0002x + 61.78; T0 (us/ft), 116.76; Compaction coefficients b (1/ft), 0.0002; Coefficient c (us/ft), 61.78. Row 4: Well-name, JYTA; Best-fit curves of individual wells, T = 127e^-0.0002x + 58.57; T0 (us/ft), 127; Compaction coefficients b (1/ft), 0.0002; Coefficient c (us/ft), 58.57. Row 5: Well-name, TTA; Best-fit curves of individual wells, T = 112.1e^-0.0002x + 61.27; T0 (us/ft), 112.1; Compaction coefficients b (1/ft), 0.0002; Coefficient c (us/ft), 61.27. Row 6: Well-name, YB; Best-fit curves of individual wells, T = 132.26e^-0.0003x + 67.99; T0 (us/ft), 132.26; Compaction coefficients b (1/ft), 0.0003; Coefficient c (us/ft), 67.99. Row 7: Well-name, LUE; Best-fit curves of individual wells, T = 125.11e^-0.000154x + 54.67; T0 (us/ft), 125.11; Compaction coefficients b (1/ft), 0.000154; Coefficient c (us/ft), 54.67. Row 8: Well-name, LUG; Best-fit curves of individual wells, T = 125.3e^-0.00019x + 58.3; T0 (us/ft), 125.3; Compaction coefficients b (1/ft), 0.00019; Coefficient c (us/ft), 58.3. Row 9: Well-name, CZA; Best-fit curves of individual wells, T = 119.89e^-0.00024x + 58.74; T0 (us/ft), 119.89; Compaction coefficients b (1/ft), 0.00024; Coefficient c (us/ft), 58.74.
Compared with the normal compaction reference curve, the AC data from wells ZTA, GSB, JYTA, LUE and others indicate significant exhumation events in SSCB since the Late Cretaceous. The paleo-burial depth, when plugged into the normal compaction reference curve to calculate the difference from present burial depth, yields net exhumation, depicted as the vertical difference between the scattered points and the curve in Figure 6a–d. The calculated differences follow a normal distribution, and this study uses the mean of the frequency histogram to represent the exhumation amount for each well. For instance, Well ZTA currently retains upper Jurassic strata, with a calculated exhumation of 2182 m; Well GSB has been exhumed to the Upper Jurassic, with an exhumation amount of 2470 m; Well JYTA and Well LUE have been exhumed to the Middle Jurassic, with exhumation amounts of 3222 m and 3060 m, respectively. As mentioned above, low-temperature thermochronological data indicate that these wells in the Late Cretaceous experienced uplift and exhumation without subsequent deposition of new strata, consistent with Figure 3b, confirming these differences as actual exhumation amounts. Similarly, applying this method to 36 wells in SSCB exhumation amounts ranging from 2000 m to 3500 m (Supplementary Table S2).
AC vs depth for Jurassic compared with the reference curve, together with net exhumation histograms and standard descriptive statistics for four wells from the SSCB: (a) Well ZTA; (b) Well GSB; (c) Well JYTA; (d) Well LUE.

4.d. Total exhumation since the maximum burial stage
As mentioned above, the zircon (U-Th)/He (ZHe) ages of samples north of Weiyuan (Well ZTA, Well JTA) are close to their stratigraphic depositional ages, indicating that the ZHe system closure temperature (170–190°C) was not reached during subsequent burial. In contrast, ZHe ages (110–40 Ma) from similar depths across the Weiyuan-Zigong-Changning region are younger than depositional ages (Figure 4a). These samples were completely annealed after reattaining the ZHe closure temperature during burial, followed by regional uplift and exhumation to present depths. The differential ZHe annealing reflects lower exhumation north of the Weiyuan Anticline compared with the anticline core and its southern flank, consistent with exhumation magnitudes derived from VR-depth and AC-depth trends.
Since the maximum burial, the magnitude of uplift and cooling temperature in the area north of the Weiyuan Anticline should be less than 84°C. The VR and AC-depth trends of Well ZTA show that the exhumation amount of this well is approximately 2000 m. In the Weiyuan Anticline core, complete annealing of surface AFT samples (Liu et al. Reference Liu, Ma, Sun, Cai, Liu, Huang, Xu, Yong, Wang, Wang and Pan2008) implies a temperature drop >100°C (AFT closure: 110 ± 10°C; surface: ∼20°C). Based on the residual stratal thickness trends, the exhumation amount in the core of the Weiyuan Anticline is estimated to reach 4000 m, although that around the basin margin all exceeds 3000 m (Figure 7). For the Zigong-Luzhou-Changning region, complete annealing of AFT, AHe and ZHe systems indicates reheating above their closure temperatures, implying a temperature drop >100°C (greater than north of Weiyuan). VR-depth trends reveal the Huaying Mountain Fault (HMF) belt as an exhumation centre (3000–4000 m), although Well LUA (south) and Well WC (north) show lower exhumation (∼3000 m). AC-depth trends show similar patterns but yield lower values (2000–3500 m), which may result from differences in basement heat flow between the SCB and Haltenbanken/North Sea.
Axial stratigraphic cross-section through the Sichuan Basin. The datum is the surface of unconformity. (a) Northwest–Southeast profile, well WA and well DSA have eroded to Triassic strata. Based on residual thickness from adjacent wells and exhumation amounts, the original strata thickness trend is estimated; exhumation for well WA is inferred to exceed 4000 m, and for well DingS1, it is estimated to exceed 5000 m. (b) A Southwest–Northeast profile is like a profile in calculating the original strata trend. Well WYA and well ZA eroded to Middle Jurassic strata, with exhumation amounts of approximately 3600 and 2800 m, respectively.

In the Changning region, AFT generally underwent complete annealing during the burial period (Liu et al. Reference Liu, Wu, Jiang, Zhou, Luo, Wu, Li, Liu and Deng2021; Wu et al. Reference Wu, Chen, Liu, Wu, Gao, Luo, Deng and Zhou2022). The Triassic strata have been widely exhumed and exposed, making it difficult to accurately estimate the exhumation amount in this area by AC. The VR-depth trends of the wells indicate that the exhumation amount here is significantly higher than that in the interior of the basin, reaching 4000 m. However, considering that the Emeishan basalt eruption event during the Middle-Late Permian significantly increased the thermal evolution degree in the southwestern SCB (Jiang et al. Reference Jiang, Wu, Wang, Kuang, Zhou, Yang, Li, Luo, Deng and Jiao2024), this diagram is likely to have overestimated the exhumation amount in the Changning and Ningxi areas.
5. Discussion
5.a. Difference in uplift timing since the maximum burial depth
Although low-temperature thermochronological samples generally underwent complete annealing during burial, the low-temperature thermochronological data distributed at different vertical depths provide favourable constraints for the inversion of the time-temperature path of the cooling history. By conducting joint thermal history simulation on AFT and AHe data from Well ZTA and other wells in the SSCB using the Ketcham annealing model and Hefty software (Ketcham, Reference Ketcham2005, Ketcham et al. Reference Ketcham, Carter, Donelick, Barbarand and Hurford2007), relatively accurate time-temperature paths were obtained. The boundary conditions of the model mainly include the stratigraphic age of samples, AFT characteristics, apatite (U-Th)/He age characteristics and present surface temperature, etc. The goodness of fit (GOF) test was used to verify the fitting degree between the simulated apatite AFT age, fission track length and the actual measured values of the samples. The GOF values of AFT from the simulation results range from 0.6 to 0.9, indicating that the thermal evolution history simulated based on the chronology data has high credibility (Figure 8a–d).
Time–temperature paths modelled for the SSCB. (a) Well ZTA (Shaximiao Fm., M. Jur.); (b) Well ZE (Shaximiao Fm., M. Jur.); (c) Well TA (Ziliujing Fm., L. Jur.); (d) Well NC (Xujiahe Fm., U. Tri.); (e) sample GL125-1 (Shaximiao Fm., M. Jur.; data from Qiu et al. Reference Qiu, Yan, Tang, Wang, Yang, Tang and Wang2016); (f) sample GL113-1 (Shaximiao Fm., M. Jur.; data from Qiu et al. Reference Qiu, Yan, Tang, Wang, Yang, Tang and Wang2016). Sample locations are shown in Figures 1 and 10. Dashed rectangles delineate the partial annealing zone (PAZ), and black arrows indicate the uplift stages, which are categorized into four stages in total.

Apatite samples from outcrops in the SSCB generally record two evolutionary stages: slow uplift and cooling from the late Cretaceous to the early Cenozoic (Stage Ⅲ), and rapid uplift and exhumation from the early Cenozoic to the present (Stage IV) (Deng et al. Reference Deng, Liu, Liu, Li and Zhao2009, Reference Deng, Liu, Wang, Li, Liu and Cao2013; Qiu et al. Reference Qiu, Yan, Tang, Wang, Yang, Tang and Wang2016; Qiu et al. Reference Qiu, Feng, Borjigin, Shen, Ma, Yu and Cao2020). Based on apatite samples from outcrops on the southern margin of the basin, Liu (2021) further divided Stage IV into an accelerated cooling phase (early Cenozoic to Miocene, ∼40–20 Ma) and a rapid cooling phase (late Cenozoic, since ∼20 Ma). In addition, previous studies have pointed out that before the above-mentioned stages, there were also slow cooling in the early Cretaceous (Stage Ⅰ, as shown in Figure 8e–f; Qiu et al. Reference Qiu, Yan, Tang, Wang, Yang, Tang and Wang2016) and rapid cooling from the early Cretaceous to the late Cretaceous (Stage Ⅱ; Liu et al. Reference Liu, Ma, Sun, Cai, Liu, Huang, Xu, Yong, Wang, Wang and Pan2008; Qiu et al. Reference Qiu, Feng, Borjigin, Shen, Ma, Yu and Cao2020) in the SSCB and its peripheral areas. Since Stages Ⅰ and Ⅱ are beyond the dating range of AFT from outcrops in the SSCB, they are mainly identified through thermal history simulation. This article focuses on the discussion of Stages Ⅲ and IV.
Controlled by the long-distance subduction of the Pacific Plate beneath the South China Continent and the Xuefeng intracontinental orogeny (XFIO), the deformation on both sides of the Xuefeng basement uplift zone extends in an asymmetric fan-shaped pattern through folding and thrusting towards the NW and SE directions. During the late Cretaceous–early Cenozoic (Stage Ⅲ), the back-edge fault zone of the Xuefeng intracontinental fold-thrust belt underwent piggyback thrusting deformation, and the northeastern segment of the HMF zone formed (Deng et al. Reference Deng, Xu, Li, Tu, Jiang, Li, Liu, He, Yong and Liu2025). The southern part of the basin experienced slow uplift and cooling. Correspondingly, the southeastern margin of the basin (around the Sangmuchang anticline) was the first to cool to the AFT closure temperature (Figure 9), showing a trend of decreasing ages from east to west near the fault zone (SF – 72.8 Ma, HJP – 61.0 Ma, ADX4 – 48 Ma). Next, the AFT ages of the Shaximiao Fm. in the southern part of the HMF are generally 50–60 Ma, also showing a decreasing trend from east to west (GL113 – 65.9 Ma, NX202 – 42.8 Ma, SQM07 – 21 Ma). Subsequently, the area north of the HMF (Zigong-Weiyuan-Ziyang area, with AFT ages of 30–40 Ma) and the southern margin of the basin (around the Xuyong-Changning anticline, with AFT ages of 20–30 Ma) gradually cooled to the AFT closure temperature (Figure 9).
Map of exhumation characteristics since the maximum burial depth. Solid lines represent contours of exhumation amounts determined by a combination of multiple methods; dashed lines represent contours of exhumation amounts inferred based on the trend of residual stratigraphic thickness from wells; and the area enclosed by the orange double-dot-dash line is the preferential uplift zone in the SSCB during the Late Cretaceous. References are as follows: [1] Liu et al. Reference Liu, Ma, Sun, Cai, Liu, Huang, Xu, Yong, Wang, Wang and Pan2008; [2] Deng et al. Reference Deng, Liu, Wang, Li, Liu and Cao2013; [3] Qiu et al. Reference Qiu, Yan, Tang, Wang, Yang, Tang and Wang2016; [4] Qiu et al. Reference Qiu, Feng, Borjigin, Shen, Ma, Yu and Cao2020; [5] Wu et al. Reference Wu, Wu, Liu, Zhou, Luo, Wu, Li and Deng2021; [6] Liu et al. Reference Liu, Wu, Jiang, Zhou, Luo, Wu, Li, Liu and Deng2021.

Affected by the intense tectonic compression during the Himalayan period, the overall cooling rate of the SSCB significantly increased starting from the early Cenozoic (∼40 Ma) (Stage IV). Since entering Stage IV, the wells in the basin have shown a three-stage characteristic: accelerated cooling (∼40–20 Ma) – slow cooling (∼20–10 Ma) – rapid cooling again (since ∼10 Ma). Compared with the continuously accelerated uplift and exhumation process in the orogenic belts on the basin margin since ∼40 Ma, the degree of exhumation in the basin is significantly smaller. Both the wells and outcrop apatite samples in the SSCB indicate a similar accelerated uplift and exhumation process in the early Cenozoic, generally showing the uniformity of rapid uplift and exhumation controlled by the cratonic basement of the basin. However, affected by various surrounding orogenic belts, the basin and its margin exhibit a certain degree of difference in the uplift and exhumation processes.
5.b. Impact of differential exhumation on thermal evolution
The successful restoration of exhumation provides a critical input for accurately reconstructing the thermal evolution history of the source rocks. Clarifying the thermal evolution characteristics of organic matter in these source rocks is a critical step in evaluating hydrocarbon generation conditions, source–reservoir configuration relationships and favourable shale gas reservoir zones.
The Caledonian uplift (primarily during the Silurian) caused the thermal evolution to stop. The source rock entered the high-maturity stage in the Late Permian and reached the over-maturity stage in the Late Triassic (Yang et al. Reference Yang, Zuo, Duan, Li, Zhang, Dang, Yang and Zeng2023; Guo et al. Reference Guo, Zhao, Xie, Wang, Jiang, Li and Zhu2024). For the evaluation of shale gas reservoirs, when the organic matter reaches a VR of 3.6%, organic matter generally begins to graphitize and pores collapse, which leads to a significant deterioration of reservoir conditions (Wang et al. Reference Wang, Dong, Cheng, Huang, Wang and Wang2014, Jiang et al. Reference Jiang, Hu, Jiang, Zhai, Ren, Chen, Li and Zhang2018; Zhang et al. Reference Zhang, Zhao, Luo, Liang, Zhou, Wang, Lu, Qiu, Liu and Liu2022).
In this study, we quantified the exhumation in the SCB and further simulated the thermal evolution characteristics of the Sub-member 2 of the Qiongzhusi Fm. shale using the PetroMod software. The heat flow values refer to Qiu (Reference Qiu, Liu, Fu, Li, Xu and Zhu2021). To calibrate the thermal models in PetroMod, the chemical kinetic model of organic matter reflectance adopts Easy%R o DL (Schenk et al. Reference Schenk, Peters and Burnham2017; Burnham, Reference Burnham2019; Li et al. Reference Li, Zhang, Liang, Pei and Chen2024), constrained by VR data. Except for the exposed Cambrian strata in the Changning Anticline and Sangmuchang Anticline, the present burial depths of the Sub-member 2 of the Qiongzhusi Fm. is buried between 3000 and 7500 m. After accounting for exhumation, the paleoburial depths of the Sub-member 2 of the Qiongzhusi Fm. reach 6500–10 000 m, respectively. The simulation results indicate that the maturity of the Sub-member 2 of the Qiongzhusi Fm. ranges from 3.2% to 4.0%, with the lowest thermal evolution intensity in the Weiyuan Anticline area and the highest in the Luzhou- Changning area. The calculated favourable area for the maturity of Sub-member 2 of the Qiongzhusi Fm. (VR < 3.6%) is in the Weiyuan-Ziyang area. The VR = 3.6% boundary for Sub-member 2 of the Qiongzhusi Fm. corresponds approximately to a current burial depth of 5500 m. This result is significantly higher than the equivalent maturity converted from bitumen reflectance (Xu et al. Reference Xu, Qiu, Liu, Shen and Wang2018; Qiu et al. Reference Qiu, Liu, Fu, Li, Xu and Zhu2021) and is similar to the maturity calculated by laser Raman spectroscopy (Yong et al. Reference Yong, Wu, Wu, Yang, Xu, Luo, Liu, He, Zhong, Li, Zhu and Chen2024).
The simulation results reveal significant spatial variations in the thermal maturity of Lower Paleozoic shales in the SCB, characterized by a gradual increase in thermal evolution intensity from the central to the southern SCB region (Figure 10). This pattern is highly correlated with the Caledonian tectonic framework of the ancient uplift in central SCB (Li et al. Reference Li, Yi, Hu, Yang and Xiong2014; Wang et al. Reference Wang, Xie, Jiang, Su, Huang, Gu, Ma, Shi and Jiang2023). Notably, despite the exposure of Cambrian strata in both the southern (Changning Anticline) and southeastern (Sangmuchang Anticline) parts of the basin, their thermal evolution intensities differ significantly; the southern region exhibits thermal evolution intensities consistent with the basin interior, although the southeastern region shows a decreasing trend towards the basin margin. This discrepancy is primarily controlled by differential sedimentation processes triggered by the activity of the XFIOB during the Late Triassic-Cenozoic period (Wang et al. Reference Wang, Zhang, Zhang and Zhao2018; Deng et al. Reference Deng, Xu, Li, Tu, Jiang, Li, Liu, He, Yong and Liu2025).
Present-day thermal maturity characteristics of Sub-member 2 of the Qiongzhusi Formation. The blue dashed line marks the 5500 m burial depth contour, which roughly coincides with the thermal maturity threshold of VR = 3.6%.

Summing up, the following stages of thermal evolution can be distinguished:
Caledonian Stage: The development of the ancient uplift in central SCB caused the residual thickness of Lower Paleozoic strata to increase in a northwest–southeast direction, with a maximum thickness difference of 1000 m, establishing the initial ‘south-high, north-low’ pattern of thermal evolution.
Hercynian–Indosinian Stage: The Dongwu and Indosinian movements caused regional uplift, with exhumation of less than 400 m in SSCB. During this stage, the sedimentary thickness differences were small, and the thermal evolution continued to inherit the north–south differentiation pattern established during the Caledonian stage, with relatively uniform progression.
Cretaceous (Stages Ⅰ and Ⅱ): Intense activity of the XFIOB led to the contraction of the ancient sedimentary basin, terminating sedimentation and halting thermal evolution in the southeastern region. Meanwhile, continuous sedimentation in SSCB allowed thermal maturity to accumulate, forming a ‘south-high, southeast-low’ thermal evolution differentiation.
Late Cretaceous to early Cenozoic (Stage Ⅲ): Thrust structural deformation occurred in the XFIOB. The southern part of the basin (the Luzhou-Xishui area south of the HYMF) underwent slow uplift and cooling, ceasing further heating earlier than the area north of the HYMF. This, to some extent, alleviated the north–south differences in thermal evolution caused by the Caledonian tectonic uplift.
Early Cenozoic to the present (Stage IV): Regional uplift caused the basin to enter an exhumation phase, with the thermal evolution of the Lower Paleozoic strata reaching its peak.
5.c. Impact of differential exhumation on pore pressure evolution
Maintaining pore pressure within a reasonable range (particularly overpressure) is a critical prerequisite for effective preservation conditions in shale reservoirs and serves as a key guarantee for shale gas enrichment. Pore pressure modelling involves spatial factors such as structural configuration, lithological assemblages with varying permeability and fault distribution (Mosca et al. Reference Mosca, Djordjevic, Hantschel, McCarthy, Krueger, Phelps, Akintokunbo, Joppen, Koster and Schupbach2018; Reda et al. Reference Reda, Salem, Abdel-Fattah, Fathy, Farouk, Al-Kahtany and Gentzis2025). As a result, pore pressure estimation based solely on single-well scale analysis has inherent limitations.
To this end, BPSM was conducted using data from well lithology, formation tops, wellbore pressure, seismic data and exhumation estimates (Figure 11a). The modelled overpressure in the Sub-member 2 of the Qiongzhusi Fm. reached 20 MPa in Well WB (Weiyuan area, Figure 11b) and 40 MPa in Well ZA (Ziyang area, Figure 11c), with corresponding pressure coefficients generally reaching 2.0. The modelling results indicate that following the Caledonian exhumation, the Weiyuan area retained a thicker succession of Lower Paleozoic strata. By the Middle Permian, Sub-member 2 of the Qiongzhusi Fm. initially entered the oil generation window. At this stage, its burial depth was generally around 2000 m, which was insufficient for fluid retention, and no sustained overpressure developed (Figure 11d). During the Middle Triassic, the formation entered the main hydrocarbon generation phase. Although significant oil migrated into overlying strata, the Ziyang area, due to reduced permeability caused by compaction, experienced restricted fluid expulsion and was the first to develop overpressure (Figure 11e). By the Late Cretaceous, the Qiongzhusi Fm. reached its maximum burial depth and peak pore pressure (Figure 11f). The Sub-member 2 of the Qiongzhusi Fm. was generally buried at depths between 6500 and 7000 m. In the model without faults, overpressure was widely maintained beneath the Triassic salt layer during uplift (Figure 11g).
2D Basin and Petroleum System Modelling in the Weiyuan-Ziyang Area. (a) Geological profile (190 km in length) built in Petrel using drilling lithology and seismic data, with the Qiongzhusi Formation discretized vertically into 20 cells. (b, c) Present-day pore pressure-depth profiles for wells WB and ZC from PetroMod simulation without faults. (d–g) Overpressure and hydrocarbon migration pathways (Combined Darcy flow and Invasion Percolation) during the (d) Variscan, (e) Indosinian, (f) Yanshanian and (g) present day.

Current wellbore pressure tests show that the pressure coefficient in Well ZA in the Ziyang area is 2.0, consistent with the modelling results. However, the pressure coefficients in the Qiongzhusi Fm. are 1.01 in Well WA and 1.49 in Well WB in the Weiyuan area, significantly lower than the predictions of the model without faults. Core and image logging observations reveal that the development degree of unmineralized or semi-mineralized fractures in the core of the Weiyuan Anticline is significantly higher than that in the Ziyang area. Crucially, these unmineralized fractures are predominantly of high-angle and vertical (Jiang et al. Reference Jiang, He, Deng, Li, Xiong, Deng, Xu, Xie, Ma and Li2025). Consequently, they severely compromise the sealing integrity of the shale reservoir, profoundly controlling the migration and adjustment of shale gas. Although incorporating faults into the model could improve alignment with actual drilling data, the lack of reliable constraints on fault sealing capacity and timing of activity prevents such models from effectively predicting the pore pressure distribution patterns across the study area. Therefore, we introduce the Skempton’s poroelastic relaxation and NHF model proposed by Engelder and Behr (Reference Engelder and Behr2021) to further analyse the pore pressure evolution during uplift. Taking Wells WB and ZA as examples, although they experienced similar maximum burial depths (approximately 7000 m), the stress–burial depth–pore pressure model reveals significant differences in the depth intervals at which NHF occurred during uplift (Figure 12).
Burial–exhumation history of stress and pore pressure for the Sub-member 2 of the Qiongzhusi Formation in the Weiyuan and Ziyang areas. (a, b) Evolution of minimum horizontal stress (S hmin, red), total vertical stress (Sᵥ, black), and pore pressure (P p, blue) with depth for the Sub-member 2 of the Qiongzhusi Formation in (a) Weiyuan (P max = 100 MPa) and (b) Ziyang (P max = 117 MPa). Blue dashed lines represent the burial-stage pore pressure derived from the BPSM. Grey arrows indicate the present-day burial depth of the Sub-member 2 of the Qiongzhusi Formation base in respective wells. Red dashed lines denote the S hmin plus a tensile strength (TS) of 4 MPa. Model Parameters: The modelling used an average undrained Poisson’s ratio of 0.27 (range: 0.22–0.30) and values from Engelder and Behr (Reference Engelder and Behr2021) for the coefficient of earth pressure at rest (k c = 0.53), Skempton’s B coefficient (0.95) and thermal expansion coefficient (α t = 0.000012°C–1). The average Young’s modulus (E) for Sub-member 2 of the Qiongzhusi Formation is 25.4 GPa (Xiao et al. Reference Xiao, Hu, Han, Shen and Li2022). The shaded grey areas illustrate the influence of parameter fluctuations on the P p and S hmin evolution curves. Pre-exhumation pore pressures and formation densities at maximum burial were derived from the geological model. The initial phase of exhumation shows a lower rate of decrease in P p and S hmin, accelerating as lower-density rocks were removed. The P p and S hmin curves intersect at 3250 m in well WB and at 4100 m in well ZA. The present-day burial depth of well WA lies above the Natural Hydraulic Fracturing (NHF) depth for TS = 4 MPa. Well WB is above the NHF depth for TS = 0 MPa, although well ZA is below it.

Figure 12. Long description
Two line graphs depict the evolution of minimum horizontal stress, total vertical stress, and pore pressure with depth for the Sub-member 2 of the Qiongzhusi Formation in Weiyuan and Ziyang areas. Panel A shows data for Weiyuan with a maximum pressure of 100 MPa, while Panel B shows data for Ziyang with a maximum pressure of 117 MPa. Each graph has depth in meters on the vertical axis and pressure or stress in MPa on the horizontal axis. The red lines represent the minimum horizontal stress, the black lines represent the total vertical stress, and the blue lines represent the pore pressure. Blue dashed lines indicate the burial-stage pore pressure derived from the BPSM. Grey arrows point to the present-day burial depth of the Sub-member 2 of the Qiongzhusi Formation base in respective wells. Red dashed lines denote the minimum horizontal stress plus a tensile strength of 4 MPa. Shaded grey areas illustrate the influence of parameter fluctuations on the pore pressure and minimum horizontal stress evolution curves. The graphs show that the pore pressure and minimum horizontal stress curves intersect at different depths in the two wells, with well WB intersecting at 3250 meters and well ZA intersecting at 4100 meters. The present-day burial depth of well WA lies above the Natural Hydraulic Fracturing depth for a tensile strength of 4 MPa, while well WB is above the NHF depth for a tensile strength of 0 MPa, and well ZA is below it.
During the uplift phase, the initial pore pressure in the Sub-member 2 of the Qiongzhusi Fm. was 117 MPa in the Ziyang area. As uplift progressed to a depth of 4100 m, the pore pressure exceeded the minimum horizontal stress (S hmin). Given the tensile strength of the Sub-member 2 of the Qiongzhusi Fm. ranging 0.1∼4 MPa, NHF is estimated to have initiated at a depth of approximately 3700 m. In contrast, the Weiyuan area started with a lower initial pore pressure of 100 MPa in the Sub-member 2 of the Qiongzhusi Fm. Here, the pore pressure surpassed the S hmin at a depth of 3250 m during uplift, with NHF likely occurring around 2800 m after accounting for tensile strength (Figure 12a). Present-day conditions reflect this differential preservation: in Well ZA, the base of the Sub-member 2 of the Qiongzhusi Fm. is at 4620 m – still below the NHF threshold of 4100 m (Figure 12b) – and it maintains a high pressure coefficient of 2.0. Well WB, with the formation base at 3140 m, is near its fracturing depth (3250 m) and exhibits a pressure coefficient of 1.49. Well WA, whose target interval is shallower at 2704 m (above the critical fracturing depth), shows a significantly depleted pressure coefficient of only 1.01.
The integration of 2D petroleum system modelling with the SPRM effectively explains these preservation differences. In the Ziyang area, located within an intracratonic sag, the Qiongzhusi Fm. is capped by well-preserved top and bottom seals and contains a greater thickness of high-quality source rocks (Yong et al. Reference Yong, Wu, Wu, Yang, Xu, Luo, Liu, He, Zhong, Li, Zhu and Chen2024). Modelling indicates that overpressure began developing in the Middle Triassic due to hydrocarbon generation, self-sealing and differential compaction. By the onset of uplift, the formation already possessed relatively high pore pressure, with modelling predicting that NHF and pressure release would occur upon uplift to 4400 m. The Weiyuan area started with lower initial pore pressure and a correspondingly shallower hydraulic fracturing depth of ∼3250 m. However, this region experienced significantly greater uplift magnitude than Ziyang, which ultimately led to the widespread destruction of preservation condition.
5.d. SPRM parameter sensitivity analysis
The SPRM model is highly sensitive to petrophysical properties, primarily rock density, Poisson’s ratio, the thermal expansion coefficient (α t), the coefficient of earth pressure at rest (k c), and Skempton’s coefficient (B). During the exhumation process, these parameters collectively influence the evolution of the S hmin and pore pressure (P p), thereby determining the predicted depth for the onset of NHF (Engelder and Gross, Reference Engelder and Gross2018; Engelder and Behr, Reference Engelder and Behr2021).
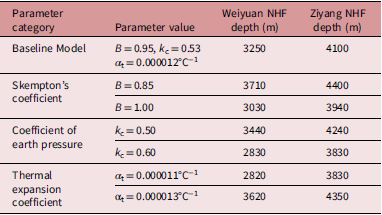
In the models shown in Figure 12, rock density, Young’s modulus (E) and Poisson’s ratio were constrained by field-acquired geological data from the Weiyuan and Ziyang areas. Conversely, due to limited localized constraints, B, k c and α t were adopted from established values for organic-rich shales (Engelder and Behr, Reference Engelder and Behr2021). To evaluate the robustness of the model, a sensitivity analysis was performed by varying these parameters by approximately ±10%. The variation ranges and the resulting NHF onset depths are summarized in Table 2, although the shaded grey areas shown in Figure 12 illustrate the influence of these parameter fluctuations on the P p and S hmin evolution curves.
Sensitivity analysis of SPRM parameters on the predicted NHF onset depths

Table 2. Long description
A table comparing the sensitivity analysis of SPRM parameters on predicted NHF onset depths. The table has four rows and three columns. The columns are labeled Parameter category, Parameter value, Weiyuan NHF depth (m), and Ziyang NHF depth (m). The rows are labeled Baseline Model, Skemptonʼs coefficient, Coefficient of earth pressure, and Thermal expansion coefficient. The table presents the parameter values and the corresponding NHF depths for Weiyuan and Ziyang. Row 1: Baseline Model, B = 0.95, kc = 0.53, α = 0.000012°C⁻¹, Weiyuan NHF depth = 3250 m, Ziyang NHF depth = 4100 m. Row 2: Skemptonʼs coefficient, B = 0.85, Weiyuan NHF depth = 3710 m, Ziyang NHF depth = 4400 m. Row 3: Skemptonʼs coefficient, B = 1.00, Weiyuan NHF depth = 3030 m, Ziyang NHF depth = 3940 m. Row 4: Coefficient of earth pressure, kc = 0.50, Weiyuan NHF depth = 3440 m, Ziyang NHF depth = 4240 m. Row 5: Coefficient of earth pressure, kc = 0.60, Weiyuan NHF depth = 2830 m, Ziyang NHF depth = 3830 m. Row 6: Thermal expansion coefficient, α = 0.000011°C⁻¹, Weiyuan NHF depth = 2820 m, Ziyang NHF depth = 3830 m. Row 7: Thermal expansion coefficient, α = 0.000013°C⁻¹, Weiyuan NHF depth = 3620 m, Ziyang NHF depth = 4350 m.
Skempton’s coefficient (B) is the primary driver of pore pressure evolution. According to poroelastic theory, the magnitude of pore pressure reduction during unloading is directly proportional to the B value. When B decreases from 0.95 to 0.85, the rate of pore pressure reduction during exhumation slows down significantly, allowing the formation to maintain a higher residual pore pressure. This causes the intersection of the P p and S hmin curves to shift downwards (e.g. in Well ZA, the NHF onset depth increases from 4100 m to 4400 m). Coefficient of earth pressure at rest (k c) describes the ratio of horizontal to vertical stress increment during the burial stage. For ancient shales like the Qiongzhusi Fm., long-term compaction typically results in k c values between 0.5 and 0.6 (Karig and Hou, Reference Karig and Hou1992; Stump and Flemings, Reference Stump, Flemings, Huffman and Bowers2001). Our analysis shows that a lower k c (0.50) reduces the initial horizontal stress at maximum burial, causing the intersection depth of P p and S hmin curves to increase. Conversely, a higher k c (0.60) shifts the NHF onset depth towards the surface. Sensitivity analysis indicates that a 10% fluctuation in αt results in a displacement of approximately 400 m in the predicted NHF depth.
Although parameter variations cause shifts in the NHF onset depths, the fundamental spatial pattern remains unchanged across sensitivity scenarios; Well ZA in the Ziyang area (present burial ∼4620 m) consistently remains below the NHF window, although Well WA (present burial ∼2704 m) in the Weiyuan area remains within the fractured zone.
6. Conclusion
This article provides data on well low-temperature thermochronology, VR, and residual stratum thickness in SSCB. A comparison with surface AFT data provides evidence for the exhumation history and tectonic evolution of SSCB. Using this as the constraint, the thermal maturity and pore pressure evolution history of the Qiongzhusi Fm. in the Weiyuan and Ziyang areas were further elucidated, leading to the following conclusions:
-
(1) The exhumation process of SSCB since the maximum burial depth stage can be divided into four stages: slow uplift in the Early Cretaceous (Stage Ⅰ), rapid uplift from the Early Cretaceous to the Late Cretaceous (Stage Ⅱ), slow uplift from the Late Cretaceous to the Early Cenozoic (Stage Ⅲ) and rapid uplift from the Early Cenozoic to the present (Stage IV). Among them, Stages Ⅰ and Ⅱ were active in the southeastern margin of the SCB. During Stage Ⅲ, the influence range expanded northwestwards into the basin, first causing the area south of the HMF to uplift, and then gradually expanding to the entire SSCB. During Stage IV, the entire SCB underwent rapid uplift and exhumation.
-
(2) The calculated exhumation amount in the HMF belt is generally 3000–4000 m, and that in the Ziyang-Gaoshi area is 2000–2500 m. Based on the residual stratal thickness trends, the exhumation amount in the core of the Weiyuan Anticline reaches 4000 m, and the exhumation amount around the basin margin all exceeds 3000 m.
-
(3) The Caledonian differential exhumation is an important controlling factor for the north-low and south-high maturity of the Lower Paleozoic shales in SSCB. During the Early Cretaceous, the latest uplift in the southeastern SCB region led to the termination of thermal evolution, resulting in the highest thermal evolution intensity observed in the Chongqing-Luzhou-Changning area. During Stage III, the area south of the HMF was uplifted, and its thermal evolution halted. The maturity of the Sub-member 2 of the Qiongzhusi Fm. ranges from 3.2% to 4.0%, and areas within the Weiyuan-Ziyang region at present-day burial depths of less than 5500 m are favourable (VR < 3.6%).
-
(4) During the initial uplift stage, the Sub-member 2 of the Qiongzhusi Fm. in both Weiyuan and Ziyang areas shared similar maximum burial depths (approximately 7000 m). Due to its higher initial pore pressure, the Ziyang area reached the critical depth for NHF at 4100 m during uplift, significantly earlier than the 3250 m calculated in Weiyuan. These critical depths represent the upper preservation limits for maintaining intact overpressure conditions in the Sub-member 2 of the Qiongzhusi Fm. of each respective area.
Supplementary material
The supplementary material for this article can be found at https://doi.org/10.1017/S0016756826100879.
Data availability statement
The data underlying this article will be shared on reasonable request to the corresponding author.
Acknowledgements
This study was supported by the Natural Science Foundation of Sichuan Province [No. 2025ZNSFSC0310].






 Open access

