Implications
The present study measured free glucose and glucose-6-phosphate (G6P) in 3000 composite cow milk samples. We showed that free glucose is altered by breed and parity, whereas G6P is not. Free glucose increases and G6P decreases during the first 21 weeks of lactation. Future studies are needed to examine their use as in-line measurements for physiological conditions and risk of disease during lactation.
Introduction
Mammary epithelial cells (MEC) do not synthesize glucose because of the lack of the enzyme glucose-6-phosphatase (G6P; Scott et al., Reference Scott, Bauman and Clark1976). Therefore, glucose in milk is dependent upon the quantity of glucose absorbed from blood to the mammary gland. Metabolism of intracellular glucose in MEC has many fates. Around 80% of the absorbed glucose has been shown to be used for lactose synthesis (Annison, Reference Annison1983). Lactose is a disaccharide composed of the monosaccharides d-glucose and d-galactose, joined in a β-1,4-glycosidic linkage. Lactose production regulates milk secretion because of high osmolarity and it is highly correlated to milk volume.
Glucose may not be the sole carbon source for lactose synthesis, but it is estimated that 80% to 85% of lactose carbon is of glucose origin (Bickerstaffe et al., Reference Bickerstaffe, Annison and Linzell1974; Faulkner and Peaker, Reference Faulkner and Peaker1987). Other metabolic fates of blood glucose in the mammary gland include (1) conversion to G6P for generation of UDP-galactose, (2) entrance to the pentose phosphate pathway for generation of reducing equivalents in the form of NADPH2, (3) complete oxidation for energy via the citric acid cycle or (4) conversion to glycerol for synthesis of triglycerides (Bauman et al., Reference Bauman, Brown and Davis1970; Scott et al., Reference Scott, Bauman and Clark1976). G6P is both an intermediate compound during lactose synthesis and the first step in both glycolysis and the pentose phosphate pathway. Furthermore, uptake of glucose in the MEC is known to be mediated by facilitative glucose transporters (GLUTs; Zhao et al., Reference Zhao, Dixon and Kennely1996 and Reference Zhao, Miller, Wall, Zheng, Dong, Neville and McFadden2004), and this mechanism is further known to be coupled to glucokinase enzymes, which transform glucose to G6P. This ‘pull effect’ on glucose entrance to the cell is dependent upon the blood glucose concentration and is facilitated by the GLUTs and glucokinases (hexokinases, Zhao et al., Reference Zhao, Liu, Wang, Zhoy and Liu2011) and may alter the ratio between glucose and G6P inside the cell.
The presence of free glucose and G6P in secreted milk is not clear. One assumption could be that free glucose and G6P represent the intracellular level at the time of secretion from MEC (Kuhn and White, Reference Kuhn and White1975), that is, the difference between the rate of glucose transport into the cell and the rate of intracellular utilization of the metabolites. This view is supported by most authors (e.g. Faulkner et al., Reference Faulkner, Chaitabutr, Peaker, Carrick and Kuhn1981; Mepham, Reference Mepham1993). Two lines of evidence support this theory, that is, the equivalence of concentrations of glucose in isolated mammary cells and in milk, and the rapid equilibration of glucose across the apical cell membrane in experiments performed in vivo (see Faulkner and Peaker, Reference Faulkner and Peaker1987). Furthermore, one could speculate that free glucose content in milk may be a product of oligosaccharide hydrolysis post secretion.
Therefore, it is important to determine if the actual concentrations of glucose and G6P, or ratios between these metabolites in milk, are reflecting different physiological states. Our objectives are to describe the variations in free glucose and G6P throughout lactation and how these parameters are altered based on parity, stage of lactation, time since last milking and breed when compared with other components in milk. Characterizing these changes may provide a better understanding of the role of free glucose and G6P in milk and their potential use as indicators of physiological conditions for cows during lactation.
Material and methods
The association between milk glucose, milking data and other milk variables
A total of 3233 composite milk samples were collected from 112 Holstein cows and 63 Jerseys. In all, 43 Holstein cows were primiparous, 69 cows were multiparous (2 to 5); corresponding figures for Jerseys were 20 primiparous and 43 multiparous (2 to 5). In total, 782 samples were from primiparous cows and 2451 were from multiparous cows.
Cows were fed a standard grass silage-based total mixed ration ad libitum throughout lactation. Three feed units of concentrates were additionally supplied in the milking robot per day.
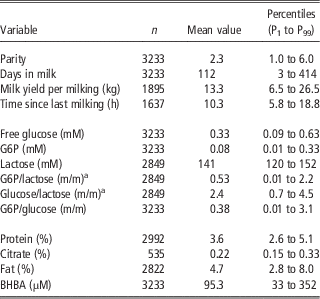
Milk samples were collected from a local herd (Danish Cattle Research Centre). The milking system is a voluntary robotic milking system, where representative milk samples are taken in a 10 ml tube, pre-dosed with the preservative Bronopol® (Myacide, Pharma BP; BASF Limited, Nottingham, UK) to obtain 100 mg/kg sample. Cows were on average milked 2.3 times per 24 h (time since last milking; Table 1), on average 18.5 samples were analysed per cow. The samples were stored at 4oC and brought to the laboratory every morning. The milk samples were analysed immediately upon arrival for a period of several months.
Means and percentiles for cow variables and milk components throughout lactation (0 to 70 weeks in milk)

G6P=glucose-6-phosphate; BHBA=β-hydroxybutyrate.
a mol/mol×103.
Milk citrate, lactose, fat and protein were determined by IR spectroscopy (CombiFoss 4000; Foss Electric Ltd, Hillerød, Denmark), somatic cell count (SCC) were performed on Fossomatic cell counter (EN ISO 13366-3; Foss Electric Ltd). β-hydroxybutyrate (BHBA) was determined by an endpoint fluorometric method according to Larsen and Nielsen (Reference Larsen and Nielsen2005).
For analysis of free glucose and G6P, the analytical method is described elsewhere (Larsen, Reference Larsen2014). In summary: G6P was determined separately by enzymatic oxidation by G6P dehydrogenase using NADP+ dependent enzyme from Saccharomyces sp. (EC 1.1.1.49; Roche 10 127 655 001). The sum of free glucose and G6P was determined by enzymatic oxidation by hexokinase (EC 2.7.1.1; Roche 11 426 362 001) and G6P dehydrogenase from Leuconostoc sp. (cofactor NAD+ and NADP+; EC 1.1.1.49; Roche 10 165 875 001). Free glucose was consequently estimated as the difference between the two results. The enzymatic-fluorometric method of total glucose (free glucose+G6P) determination is a three step enzymatic procedure to obtain the fluorescent product equivalent to the glucose content. The two first steps are identical to the widely used hexokinase and G6P-mediated conversion of glucose to gluconate-6-phosphatase and NAD(P)H2. The last step is an enzymatic coupling of the reducing equivalents from NAD(P)H2 to the non-fluorescent compound resazurin mediated by the enzyme diaphorase (EC 1.6.99.1). Resazurin is reduced by NAD(P)H2 and the highly fluorescent substance resorufin is developed and measured fluorometrically (Larsen and Nielsen, Reference Larsen and Nielsen2005). Reducing equivalents (NADPH2) from the separate G6P oxidation is in the same way coupled to resazurin in order to quantify G6P fluorometrically. Figure 1 shows the analytical steps. Standards and control samples were prepared (independently) from glucose monohydrate (MW 198.2) and G6P (MW 304.2), respectively, and glucose and G6P-free milk (Larsen, Reference Larsen2014). The latter initiative secures standards and controls with the same chemical matrix as ordinary milk samples. The intraassay precisions for the glucose analyses were 2.6; 2.0; 2.1; and 2.9 CV%, respectively, for the 0.50; 1.00; 1.50; 2.00 mmol/l control samples (n=30). The corresponding figures for the interassay precision were 5.9; 3.3; 4.0; and 4.0 CV% (n=30). Bias were equivalently −6.7; −3.7; −0.5; and +4.8% (n=30).
The enzymatic conversion of glucose and glucose-6-phosphate, which is used in the present study is a three or two step procedure, respectively. Step 1 to 3 is used in the determination of total glucose (glucose and glucose-6-phosphate); step 2 to 3 is used in the determination of glucose-6-phosphate only. Step 1 is mediated by hexokinase (EC 2.7.1.1); step 2 is mediated by glucose-6-phosphate dehydrogenase (EC 1.1.1.49) and step 3 is mediated by diaphorase (EC 1.6.99.1). The terminal product resorufin is the fluorescent compound produced in equimolar amounts to glucose and/or glucose-6-phosphate.

The intraassay precisions were for the G6P analyses 2.3; 2.3; 2.7; and 2.6 CV%, respectively, for the 0.15; 0.30; 0.45; 0.75 mmol/l controls (n=30). The corresponding figures for the interassay precision were 6.2; 5.1; 4.7; and 4.9 CV% (n=30). Bias were equivalently +4.6; +4.7; +4.7; and +7.2% (n=30).
Traditional analyses for glucose and G6P (e.g. Faulkner, Reference Faulkner1980) are based on spectrophotometry, which implies that the opaque matrix needs to be clarified, that is, fat has to be centrifuged from the sample, protein has to be precipitated by perchloric acid and the sample subsequently centrifuged and neutralized before the analyses for the metabolite. The present method is useful in opaque matrices like milk and works without pre-treatment of the sample. We are able to analyse hundreds of samples per day.
Statistical analysis
Before statistical analysis, cows in parity 1 were grouped as primiparous and cows in parity ⩾2 were grouped as multiparous. For each cow, week in milk was generated from days in milk. Week in milk was then grouped into the following periods: period 1=weeks 1 to 3; period 2=weeks 4 to 6; period 3=weeks 7 to 9; period 4=weeks 10 to 15; period 5=weeks 16 to 21; period 6=weeks 22 to 27; period 7=weeks 28 to 33; period 8=weeks 34 to 39; period 9=weeks >39. Lactose was given in percent of weight from the commercial laboratory (standard IR spectrometry); we re-calculated to mM (MW 342.3) and molar ratios between G6P : free glucose, G6P : lactose and free glucose : lactose were then generated. Data were analysed via a GLM model using the MIXED procedure of SAS, version 9.2 (2008) with the repeated measure of period. The class variables included cow, parity, period and breed. The model included the fixed effects of breed, parity, period, breed×parity, breed×period and period×parity. Degrees of freedom were estimated with the Kenward–Roger specification in the model statements. Data are presented as least-squares mean (LSM) and standard errors of the mean (s.e.m.). Separation of LSM for significant effects was accomplished using the Tukey’s option within the MIXED procedure of SAS. Statistical differences were declared as significant and highly significant at P<0.05 and P<0.01, respectively. PROC CORR was used to generate correlations between milk variables, time intervals between milkings (h) and ratios throughout lactation.
Results
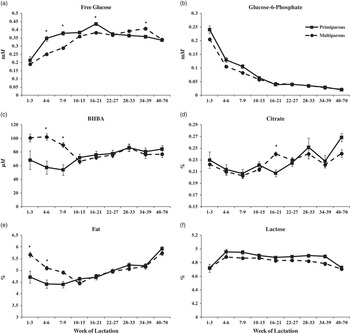
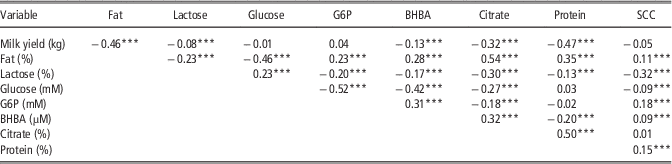
Descriptive statistics for milking data and measured variables are given in Table 1. Time intervals between milking were recorded (n=1637). On average, there was 10.3 h between individual milkings (P1 to P99 interpercentile=5.8 to 18.8 h). The lactose content was on average 4.83% (P1 to P99 interpercentile=4.1% to 5.2%; n=2849), corresponding to 141 mM (MW 342.3, density 1.0). Table 2 shows the Pearson’s correlations between milk yield, fat, lactose, protein, SCC, glucose, G6P, BHBA and citrate throughout lactation. Both G6P and free glucose were negatively correlated to time intervals between milking (r=−0.16 and −0.10, respectively; n=1637; P<0.001), whereas G6P and free glucose were not correlated with milk yield (Table 2). The molar content of G6P was negatively correlated to the molar content of lactose (r=−0.20; P<0.001), whereas the molar content of free glucose was positively correlated to the molar content of lactose (r=0.23; P<0.001). Both free glucose and G6P were not correlated to protein. Free glucose was negatively correlated to BHBA (r=−0.42; P<0.001), whereas G6P positively correlated to BHBA (r=0.31; P<0.001). Both free glucose and G6P were negatively correlated to milk citrate (r=−0.27 and r=−0.18, respectively). Figure 2 shows the LSM and s.e.m. for the effect of parity on concentrations of milk components throughout lactation. Free glucose in milk increased markedly during the first 21 weeks of lactation, just as G6P decreased markedly in the same period. Milk yield was greater (P<0.001) for multiparous (13.5±0.13) than primiparous cows (10.7±0.20). Primiparous cows had a significantly greater content of free glucose than multiparous cows (Figure 2a), whereas parity did not alter concentrations of G6P. As expected, multiparous cows had greater milk BHBA and milk fat than primiparous cows during the first 9 weeks in milk (Figure 2c and e, respectively).
The effect of parity on concentrations of free glucose (a), glucose-6-phosphate (b), β-hydroxybutyrate (BHBA) (c), citrate (d), fat (e) and lactose (f) in milk from Holstein and Jersey cows throughout lactation. *Indicates differences (P<0.05) between primiparous and multiparous (i.e. >1 parity) cows at any given time point.

Pearson’s correlations (r) between milk yield (kg/milking) and fat, lactose, glucose, SCC, G6P, β-hydroxybutyrate, citrate and protein in milk throughout lactation (i.e. 0 to 70 weeks in milk)

SCC=somatic cell count; G6P=glucose-6-phosphate; BHBA=β-hydroxybutyrate.
***P<0.001; **P<0.01; *P<0.05.
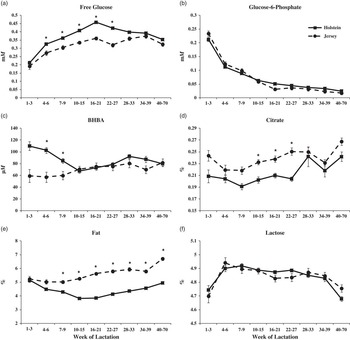
Generally, Holstein cows had greater concentrations of free glucose (Figure 3a) and BHBA (Figure 3c; first 9 weeks only) when compared with Jerseys. Milk yield was greater (P<0.001) for Holstein (14.6±0.14) than Jersey cows (9.73±0.19). Breed did not affect concentrations of G6P or lactose throughout lactation. Jersey cows had greater concentrations of citrate (Figure 3d) and fat (Figure 3e) throughout lactation.
The effect of breed on concentrations of free glucose (a), glucose-6-phosphate (b), β-hydroxybutyrate (BHBA) (c), citrate (d), fat (e) and lactose (f) in milk from Holstein (n=191) and Jersey (n=63) cows throughout lactation. *Indicates differences (P<0.05) between breeds at any given time point.

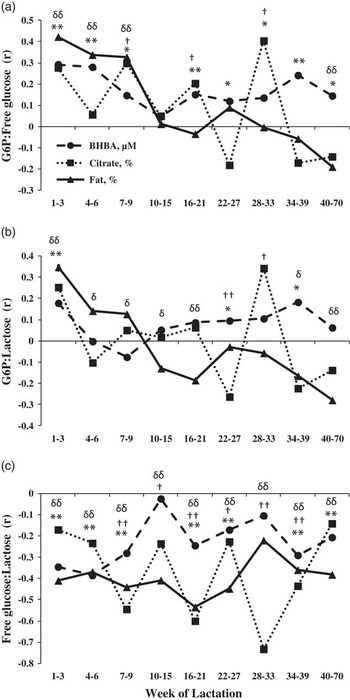
Correlations throughout lactation between the ratios of monosaccharides and lactose (G6P : free glucose, G6P : lactose and free glucose : lactose) and concentrations of BHBA, citrate and fat during lactation are given in Figure 4. Throughout lactation, the G6P : free glucose is positively correlated to BHBA, whereas the free glucose : lactose ratio is negatively correlated with BHBA. Correlations between free glucose : lactose and fat and BHBA are negatively correlated throughout lactation; and free glucose : lactose is negatively correlated to citrate as lactation progresses.
Pearson’s correlations (r) between glucose-6-phosphate (G6P) : free glucose ratio (a), G6P : lactose (b), and free glucose : lactose (c) and β-hydroxybutyrate (BHBA), citrate and fat in milk throughout lactation. Significant (P<0.05; single symbol) and highly significant (P<0.01; double symbol) correlations at any given time point are denoted for BHBA (*), citrate (†) and fat (δ).

Discussion
The free glucose level in milk obtained in the present study, that is, mean 331 µM, P1 to P99 interpercentile=90 to 630 µM (n=3233), is in accordance to previous reports. Marschke and Kitchen (Reference Marschke and Kitchen1984) found from 20 to 570 µM (mean 220 µM; n=188) glucose after centrifugation and precipitation of samples. Lemosquet et al. (Reference Lemosquet, Rigout, Bach, Rulquin and Blum2004) found on average 480 to 580 µM; Rigout et al. (Reference Rigout, Lemosquet, van Eys, Blum and Rulquin2002) 430 to 570 µM; Hurtaud et al. (Reference Hurtaud, Rulquin and Verite1998 and Reference Hurtaud, Lemosquet and Rulquin2000) reported 720 to 830 µM and 510 to 650 µM, respectively; and Faulkner and Pollack (Reference Faulkner and Pollack1989) 350 to 580 µM. Most of these studies are based on a relatively limited number of analyses and animals. All of the studies use both centrifugation and precipitation as pre-treatment before analyses (enzymatic determination of glucose, colorimetry). Most studies use the ‘hexokinase method’ for determination of glucose, this method includes both glucose and G6P. However, in some instances it is difficult to tell if the G6P fraction of the total glucose has been considered separately where the ‘hexokinase assay’ has been used. If not, the stated levels are the sum of glucose and G6P.
Former estimations of G6P in milk are based on fat-free milk where protein is precipitated (perchloric acid precipitation) and subsequent detection is colorimetric; and most studies find a concentration between 20 and 140 µM (e.g. Faulkner, Reference Faulkner1980; Faulkner and Pollack, Reference Faulkner and Pollack1989; Hurtaud et al., Reference Hurtaud, Rulquin and Verite1998 and Reference Hurtaud, Lemosquet and Rulquin2000; Rigout et al., Reference Rigout, Lemosquet, van Eys, Blum and Rulquin2002 and Reference Rigout, Hurtaud, Lemosquet, Bach and Rulquin2003); in fairly good agreement with the present enzymatic-fluorometric determination, that is, mean 81 µM (P1 to P99 interpercentile=5 to 330 µM, n=3233).
The fact that milk yield was not correlated to free glucose and G6P, whereas hours since last milking was negatively correlated, is from an analytical and physiological point of view very important. If free glucose in milk was a consequence of hydrolysis of lactose post secretion, longer deposition in the mammary alveoli would encourage more hydrolysis and thereby higher concentrations of free glucose. That is not the case, indicating that the concentration of free glucose in milk is a manifestation of the situation in the secreting cell pre-secretion. This was first suggested by Kuhn and White in 1975. The intracellular glucose concentration represents the difference between the rate of glucose transport into the cell and the rate of its intracellular utilization. The situation is most likely parallel for G6P bearing in mind that this metabolite is synthesized inside the cell. The concentration of glucose, G6P and lactose in the secreted milk is so to say a ‘snapshot’ of the situation in MECs at the moment of secretion. The interrelationship between the three sugars, that is, the ratios thereby reflect energy metabolism in the cell, which, in turn, indicates the energy status of the animal, that is, in blood. In support of this, Faulkner et al. (Reference Faulkner, Chaitabutr, Peaker, Carrick and Kuhn1981) demonstrated that starvation of goats for 2 days decreased glucose concentration of milk considerably in parallel with a decreased rate of lactose production. Chaiyabutr et al. (Reference Chaiyabutr, Faulkner and Peaker1981) further demonstrated significantly reduced glucose uptake in the lactating mammary gland and increased concentration of G6P and other intermediate hexose-phosphates in milk during starvation of goats. Several studies have indicated that the transport of glucose from plasma into the cell was the rate-limiting step for intracellular metabolism (Wilde and Kuhn, Reference Wilde and Kuhn1981; Threadgold and Kuhn, Reference Threadgold and Kuhn1984). This is consistent with the lack of correlation observed between glucose concentration in blood and rate of mammary uptake, although more recent studies have questioned this (Cant et al., Reference Cant, Trout, Qiao and Purdie2002).
A relatively limited number of other studies have focused on free glucose and G6P in milk in association with metabolism and health of the animal and through the impact of external factors. A number of studies have investigated the effect of glucose infusion in duodenum on milk glucose. Hurtaud et al. (Reference Hurtaud, Rulquin and Verite1998 and Reference Hurtaud, Lemosquet and Rulquin2000) in one trial found linearly increasing levels of both glucose and G6P when 0 to 1500 g glucose was infused daily. In two later trials, 0 to 2250 g glucose was infused daily, and only very marginal increase in milk glucose was obtained in one instance. Rigout et al. (Reference Rigout, Lemosquet, van Eys, Blum and Rulquin2002) infused glucose in the duodenum in lactating cows over a 14-day period, that is, 443 to 2398 g/day. Glucose and G6P content of the milk were not affected significantly (linear estimates). Similarly, Lemosquet et al. (Reference Lemosquet, Rigout, Bach, Rulquin and Blum2004) infused 600 or 1200 g glucose in the duodenum per day and found only tendencies of increased (linear) glucose in the milk. Interestingly, the above mentioned trials (five) dealing with infusion of glucose in the duodenum do not unequivocally show accordance between increase in glucose in blood and in milk. More studies are needed that examine the relationship between free glucose and G6P with changes in metabolites in blood.
The lactose concentration in milk is traditionally rather constant as shown in Table 1. In the present study, the ratio between the 99%’s percentile and the 1%’s percentile is 1.26, indicating the greatest lactose concentration is 26% greater than the lowest concentration. Greater variations are found in ranges of free glucose and G6P: for glucose, the ratio is 6.9 and for G6P it is 162. These wide ranges for the monosaccharides are also reflected in the ratio between G6P and glucose (618), and the ratios to lactose, that is, 6.3 and 146 for glucose and G6P, respectively. Clearly, the content of (intermediate metabolites) monosaccharides in milk vary much more than lactose, the product.
The present study found a moderate positive correlation between free glucose and lactose, which from this point of view reflect intracellular conditions; uptake of glucose from the circulating blood system, the utilization of glucose in lactose synthesis (various steps) and the secretion of lactose and glucose to the milk. In addition, a moderate inverse correlation between G6P and lactose was observed, and may relate to lactose synthesis as well as milk production as G6P is a precursor for lactose synthesis and also serves as an intermediate in glycolysis and the pentose phosphate cycle, which produce reducing equivalents (NADPH2) used for reductive biosynthesis of milk fat and cholesterol.
Especially during early lactation, free glucose was greater for primiparous than multiparous cows. Milk yield was greater for multiparous cows and a fraction of the free glucose may have been oxidized for energy because of the increased energy demands for milk synthesis. Concentration of free glucose was greater for Holstein when compared with Jersey cows throughout lactation. Percent fat was greater for Jersey cows and free glucose may have been converted to glycerol for the synthesis of triglycerides when compared with Holstein cows.
Blood variables (glucose, NEFA, BHBA, etc.) reflect the rate and extent of tissue mobilization and have been used to predict the energetic status of the animal (Bjerre-Harpøth et al., Reference Bjerre-Harpøth, Friggens, Thorup, Larsen, Damgaard, Ingvartsen and Moyes2012) or used to generate indices like physiological imbalance (PI; Moyes et al., Reference Moyes, Larsen and Ingvartsen2013). However, blood sampling is time-consuming and normally expensive to perform and are not optimal for use on-farm. Therefore, the use of biomarkers in milk may be used to reflect the physiological status of an animal. Milk samples can be more easily collected two or three times a day all year round in any dairy herd. Estimation of the energetic status of an animal via variations in milk components is much more ingenious, no invasive techniques for sampling are needed and no specialized personal are required. In-line surveillance systems have been recently introduced commercially (e.g. Herd NavigatorTM herd management system); however, these systems are not fully equipped yet to detect minor deviations in individual PI.
Future experiments are needed that focus on other factors affecting milk glucose and G6P that can identify the mechanisms that link these monosaccharides in milk to physiological conditions and risk of disease for cows throughout lactation. In this respect, natural changes due to parity and breed should also be taken into account. The present enzymatic-fluorometric determination of both monosaccharides, avoiding pre-treatment of samples, might facilitate future research in this area.
Acknowledgements
This work has been supported by the Danish National Advanced Technology Foundation, Lattec I/S, The Milk Levy Fund and the Danish Ministry of Food, Agriculture and Fisheries. Jens Clausen and Carsten Berthelsen are kindly acknowledged for their skilful technical assistance during the course of the work.