Introduction
The number of seeds produced by populations of polycarpic plants often fluctuates considerably from year to year (Herrera et al., Reference Herrera, Jordano, Guitian and Traveset1998), with trees constituting the best-known examples in the northern hemisphere. This high annual variation in reproductive output, often synchronized over large areas, is called ‘mast seeding’ or ‘masting’ (Kelly, Reference Kelly1994). Masting is the reproduction strategy, defined as the intermittent and synchronous production of a large number of seeds by individuals in populations of long-lived plants, particularly in woody and wind-pollinated species (Houle, Reference Houle1999; Moreira et al., Reference Moreira, Abdala-Roberts, Linhart and Mooney2014; Pearse et al., Reference Pearse, Koenig and Kelly2016). Masting affects plant population dynamics and forest properties such as tree growth, carbon stocks, regeneration dynamics, plant population recruitment, nutrient cycling, future species composition or densities of animal population, and ultimately influences ecosystem services (Ascoli et al., Reference Ascoli, Maringer, Hacket-Pain, Conedera, Drobyshev, Motta, Cirolli, Kantorowicz, Zang, Schueler, Croisé, Piussi, Berretti, Palaghianu, Westergren, Lageard, Burkart, Gehrig-Bichsel, Thomas, Beudert, Övergaard and Vacchiano2017; Vacchiano et al., Reference Vacchiano, Ascoli, Berzaghi, Lucas-Borja, Caignard, Collalti, Mairota, Palaghianu, Reyer, Sanders, Schermer, Wohlgemuth and Hacket-Pain2018).
Resource dynamics, pollination success and environmental veto are possible mechanisms driving masting (Bogdziewicz et al., Reference Bogdziewicz, Steele, Marino and Crone2018b). Compared with tree species that fruit annually, mast-fruiting species have fewer reproductive opportunities and a higher risk of death of mature individuals between reproductive events. Other costs due to masting include increased density-dependent mortality or decreased diameter growth rates, which further reduce population fitness of masting species. To compensate for these costs, mast-fruiting species need to produce more seeds per reproductive event, which exhibit a higher per capita survival chance (Visser et al., Reference Visser, Jongejans, van Breugel, Zuidema, Chen, Kassim and de Kroon2011). Furthermore, masting, even though it results in missing reproductive opportunities, is a stable reproductive strategy due to number of economies of scale, e.g. through enhanced pollination efficiency, seed predator satiation and increased seed dispersal by animals (Bogdziewicz et al., Reference Bogdziewicz, Marino, Bonal, Zwolak and Steele2018a), yet it also may result in other costs, like large mortality due to high density of seedlings following masting years.
Several climatic variables have already been identified as factors defining masting and low production years in tree species (e.g. Kelly, Reference Kelly1994; Woodward et al., Reference Woodward, Silsbee, Schreiner and Means1994; Houle, Reference Houle1999; Koenig and Knops, Reference Koenig and Knops2000; Pukkala et al., Reference Pukkala, Hokkanen and Nikkanen2010; Kelly et al., Reference Kelly, Geldenhuis, James, Holland, Plank, Brockie, Cowan, Harper, Lee, Maitland, Mark, Mills, Wilson and Byrom2013; Koenig et al., Reference Koenig, Knops, Carmen and Pearse2015; Moreira et al., Reference Moreira, Abdala-Roberts, Linhart and Mooney2015; Pearse et al., Reference Pearse, Koenig and Kelly2016; Vacchiano et al., Reference Vacchiano, Ascoli, Berzaghi, Lucas-Borja, Caignard, Collalti, Mairota, Palaghianu, Reyer, Sanders, Schermer, Wohlgemuth and Hacket-Pain2018); masting has been correlated with the period corresponding to bud formation, flower initiation, pollination, fruit maturation and the entire growing season. In some conifers, the combination of temperature and precipitation conditions during specific seasons of the maturation year, as well as one or two years before, have been shown to be associated with cone production (Woodward et al., Reference Woodward, Silsbee, Schreiner and Means1994; Houle, Reference Houle1999). In other conifers, only temperature or humidity has been correlated with reproductive variables (Kelly et al., Reference Kelly, Geldenhuis, James, Holland, Plank, Brockie, Cowan, Harper, Lee, Maitland, Mark, Mills, Wilson and Byrom2013; Davi et al., Reference Davi, Cailleret, Restoux, Amm, Pichot and Fady2016).
Natural regeneration of trees takes place within a multitude of biotic and abiotic scenarios, where various factors, acting simultaneously and interactively, lead to diverse species responses particularly towards changing resource levels. Seedling recruitment patterns vary widely, and it is frequently difficult to appraise the role of seedlings in forest dynamics. Although the natural forest regeneration success depends on events occurring during the whole tree lifespan, some stages such as seedling establishment, survival and early growth are critical, due to the vulnerability to environmental constraints during early plant life-stages (Fenner and Thompson, Reference Fenner and Thompson2005; Borja, Reference Borja2014).
Abies cephalonica belongs to the strictly Mediterranean firs (Aussenac, Reference Aussenac2002) and is endemic to Greece. It creates climax plant communities with exemplary populations distributed at (minimum 400) 900–1400 (maximum 1800) m above sea level (masl) (Dimopoulos et al., Reference Dimopoulos, Raus, Bergmeier, Constantinidis, Iatrou, Kokkini, Strid and Tzanoudakis2013) mostly in the central and southern part of Greece. These forests are threatened by natural disturbances and in particular by wildfire (Gardner and Knees, Reference Gardner and Knees2011). Several A. cephalonica forests have been designated as National Parks and are included in the NATURA 2000 European Network. In fire-free conditions, large fluctuations of A. cephalonica seedling density were attributed to mast seeding and habitat characteristics (Politi et al., Reference Politi, Arianoutsou and Stamou2009, Reference Politi, Georghiou and Arianoutsou2011) and further explained by better-quality seeds (i.e. with higher seed viability and germinability levels) produced during masting years (Daskalakou et al., Reference Daskalakou, Koutsovoulou, Mavroeidi, Tsiamitas, Kafali, Radaiou, Ganatsas and Thanos2018).
The present work aims at (a) studying the cone production of masting in conifers in a long-term perspective, (b) investigating the potential correlation between masting and climatic/microsite conditions, and (c) assessing annual seedling emergence, establishment and survival in unburned sites with different microclimatic conditions occurring after the wildfire, using A. cephalonica as the study tree species.
Materials and methods
Study tree species
Abies cephalonica is a long-lived monoecious tree, up to 30 m tall, which reaches reproductive maturity at an age of ca 30 years. Maximum seed production is observed at the age of 60–100 years; the female cones ripen yearly, early in the autumn (September) and seed dispersal is carried out in later (October–November) of the same year. Heavy cone production in A. cephalonica has been postulated to occur every 2–4 years (Panetsos, Reference Panetsos1975; Dafis, Reference Dafis1988; Politi et al. Reference Politi, Georghiou and Arianoutsou2011). Abies cephalonica is a late succession and shade-tolerant species that may live under shade for more than 60 years. Moreover, it is a non-fire-resilient species and the developing cones along with the enclosed immature seeds are usually burned during a wildfire.
Study area
Parnitha National Park (NP) hosts an A. cephalonica forest of paramount importance for the metropolitan area of greater Athens and Attica region, extending over a surface area of ca 3500 ha, in an altitudinal belt starting from 600–800 masl and upwards to the mountain summit (1413 m). In the summer of 2007, a sizeable part (around 60%) of the fir forest was burned (2180 ha), and as a result, the A. cephalonica habitat has been considerably reduced. Therefore, the post-fire regeneration of the Parnitha NP fir forest has risen to a major environmental challenge ever since (Ganatsas et al., Reference Ganatsas, Daskalakou and Paitaridou2012; Christopoulou et al., Reference Christopoulou, Kazanis, Fyllas and Arianoutsou2018).
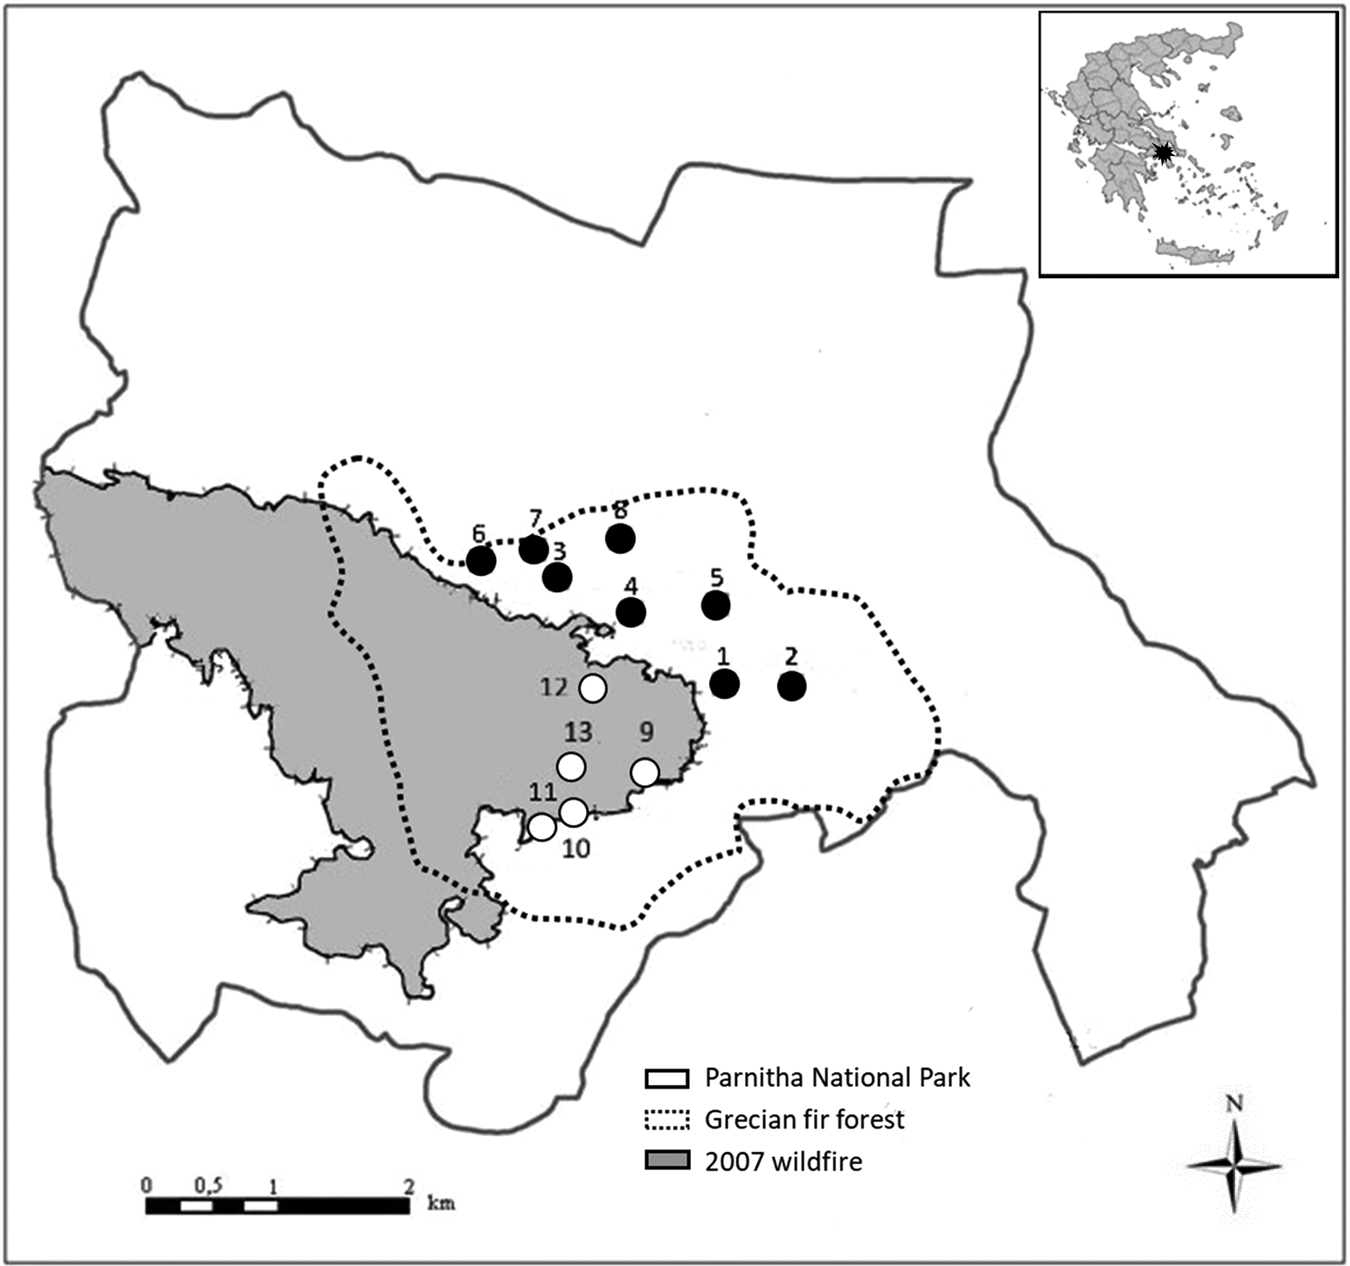
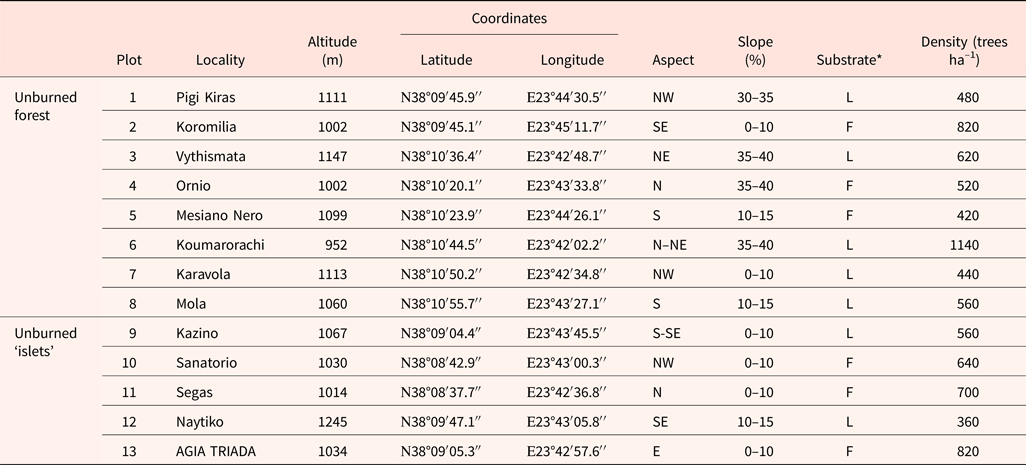
Thirteen (13) monitoring plots (20 × 25 m) were established in May 2013 in the unburned fragments of the Parnitha NP fir forest (Table 1), at randomly selected sites of varying altitudes, exposures and slopes (Fig. 1). Eight plots fall within the main part of the unburned forest; five plots are located in unburned fragments (‘islets’) which are very restricted areas within the main part of the burned forest.
Monitoring plots established (May 2013) both inside the unburned Abies cephalonica mature forest (filled circles) and within the unburned ‘islets’ (open circles).

Plot characteristics in the unburned Abies cephalonica mature forest and the unburned ‘islets’ in Parnitha NP

*L, limestone; F, flysch.
Climatic conditions
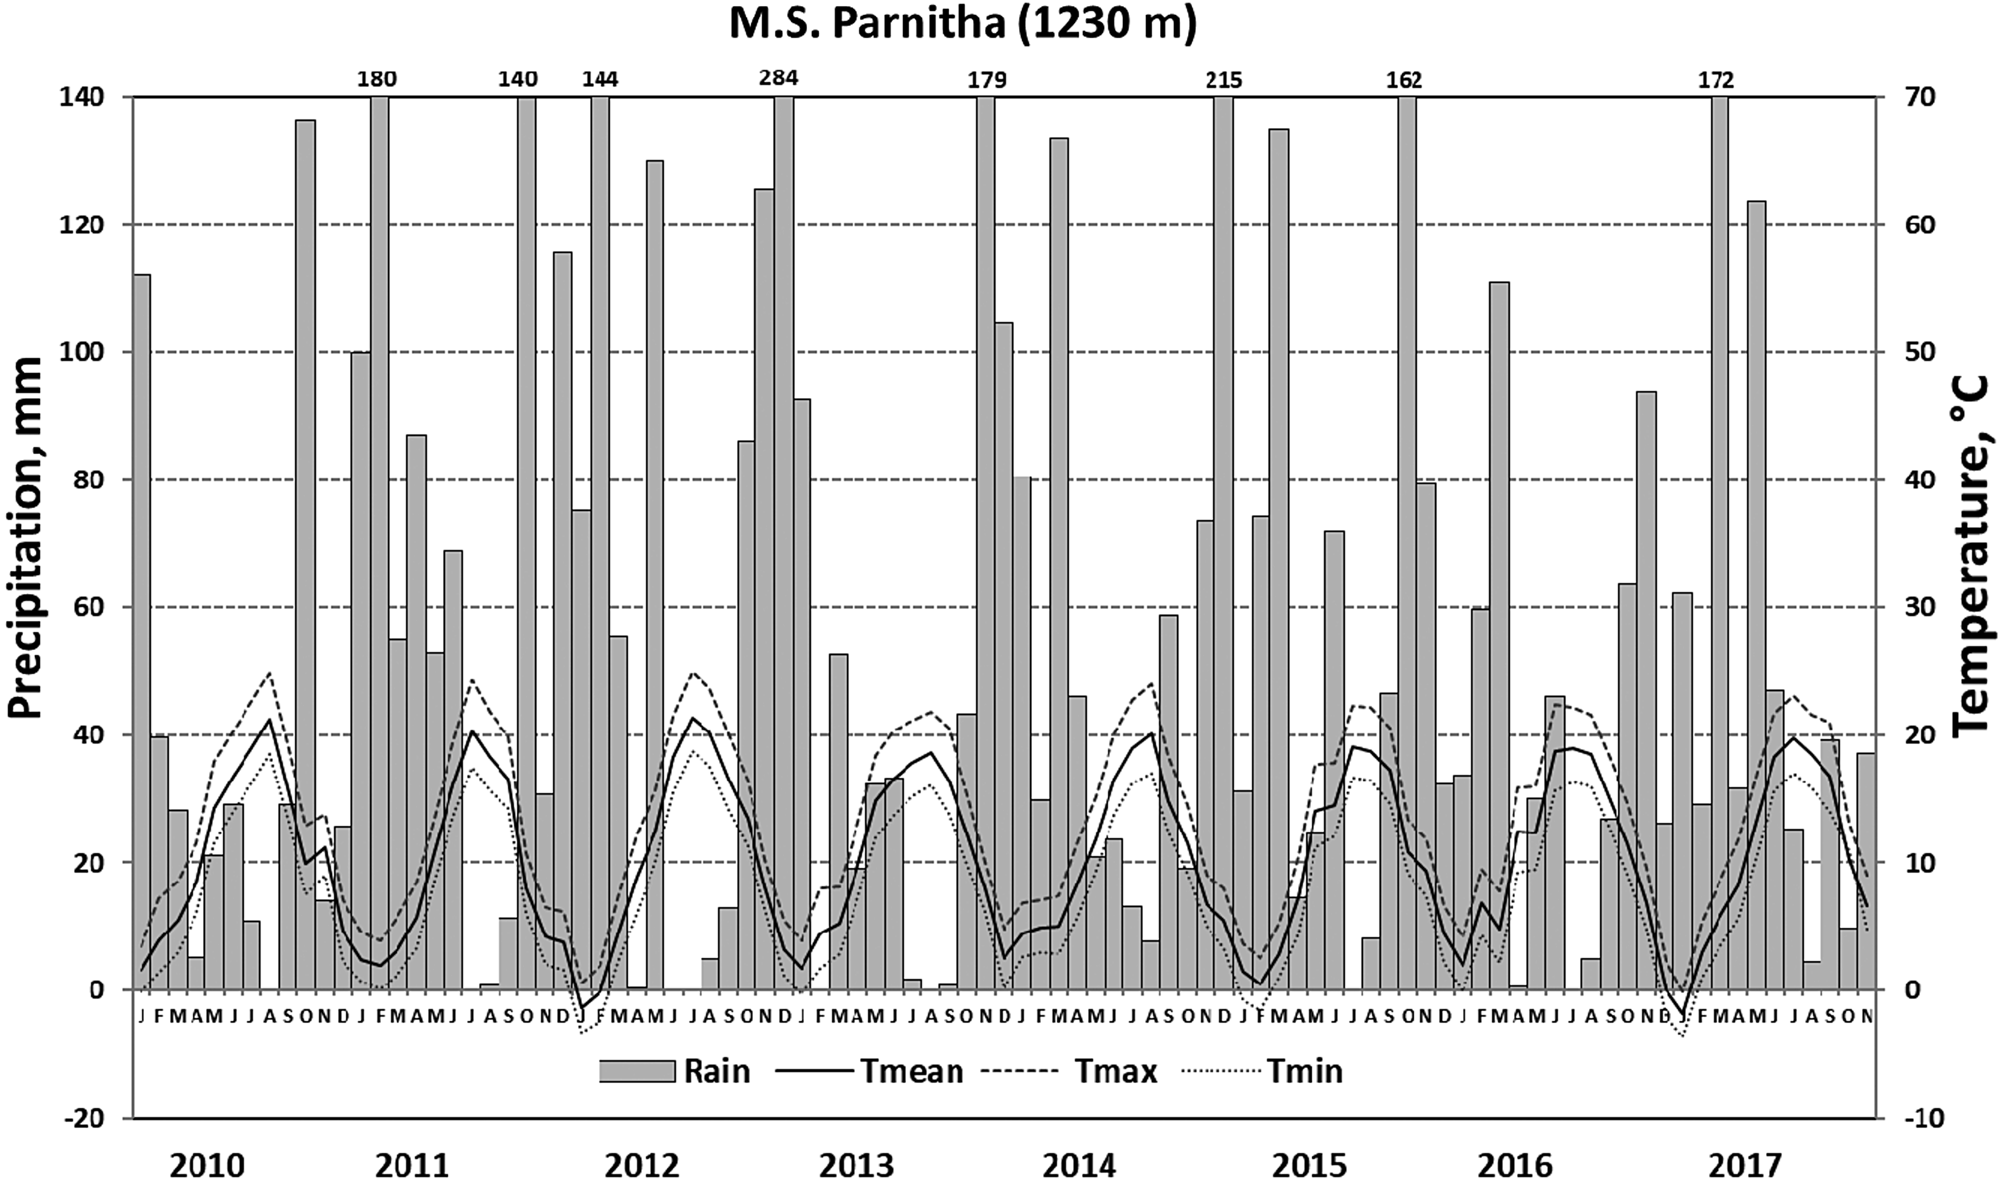
Meteorological data were obtained from the Parnitha Meteorological Station operated by the National Observatory of Athens (1230 masl; National Observatory of Athens, 2017) since December 2009 (Fig. 2). The mean annual air temperature is 10.4°C and the mean annual precipitation is 656.2 mm (2010–2017); these values are quite different at the lowest elevations of the Parnitha Mt covered by Aleppo pine forests (Thanos et al., Reference Thanos, Daskalakou and Nikolaidou1996), where the corresponding values for T max and T min were 13.4 and 8.1°C, respectively. Particularly dry conditions were recorded for 2010, 2013 and 2016 (annual precipitation lower than average: 451.4, 559.2 and 496.3 mm, respectively), while 2011 and 2012 were comparatively wet (842.3 and 917.8 mm, respectively). Furthermore, the average total yearly precipitation (2010–2016) for the hydrological year (October–September) was 703.9 mm, fluctuating between 586.8 (2015–2016) and 740.8 mm (2013–2014).
Monthly meteorological data for the period 2010–2017.

Cone-bearing trees – monitoring of masting years
Ten mature trees per monitoring plot, 130 A. cephalonica trees in total, were randomly selected and marked. Cones per tree were counted annually, in the autumn (September–October, brown cones), using binoculars (FAO, Reference Willan1985), throughout the 5-year monitoring period (2013–2017). Hereafter, each year refers to the seed ripening (maturation) year. The percentage (%) of cone-bearing trees was also calculated. Furthermore, tree breast diameter (cm) and height (m) were measured once, at the beginning of the monitoring period (May 2013); the overall mean corresponding values were 26.9 ± 0.8 cm and 8.3 ± 0.3 m.
Natural regeneration monitoring
Seedling dynamics were assessed in Parnitha NP, through the establishment of permanent transects within the centre of the 13 monitoring plots; dimensions of the transects were 10 × 2 m in the unburned forest and 20 × 2 m in the ‘islets’. In the latter case, seedling emergence, density (seedlings m–2) and survival were calculated only for the inner half of the transects (first 10 × 2 m), thus limiting edge effects. The transects in the ‘islets’ were further expanded into the burned forest for an additional 30 m (transects 30 × 2 m), thus seedling emergence and survival was assessed separately in the burned fir forest edge. A census of A. cephalonica seedling emergence, density (seedlings m–2) and survival were performed within the transects, twice per year, in late spring-early summer (May–June) and in fall (September–October) during a 4-year monitoring period (2013–2016). Seedling/sapling age was determined according to the literature instructions (Moulopoulos, Reference Moulopoulos1956; Vidakovic, Reference Vidakovic and Brekalo1991). Two major categories of A. cephalonica seedlings/saplings were recognized in the field: (a) young, recently germinated and early emerged fir seedlings, still at the cotyledon stage (<1 year of age), and (b) older saplings, i.e. older than 1 year and up to 3 years old. For each monitoring period, fir seedling and sapling survival were subsequently estimated.
Statistical analysis
In order to investigate whether certain climatic variables are related to cone production (Woodward et al., Reference Woodward, Silsbee, Schreiner and Means1994), Pearson correlation coefficients between mean (T mean), maximum (T max) and minimum (T min) monthly temperatures, monthly precipitation with cone production, respectively, both for the entirety of marked trees or only for cone-bearing ones, were estimated (Houle, Reference Houle1999). Weather variables were calculated based on the growing season of A. cephalonica (March–October) for either the cone maturation year (year t) or both year t and the previous year (t – 1) (Krebs et al., Reference Krebs, LaMontagne, Kenney and Boutin2012). The growing season was involved in the analysis because it includes crucial periods in A. cephalonica reproduction, i.e. female cone elongation and bud burst initiation (April–May), pollination (May–June), cone maturation (August–June–September) and seed dispersal (October) (Panetsos, Reference Panetsos1975; Politi et al., Reference Politi, Georghiou and Arianoutsou2011).
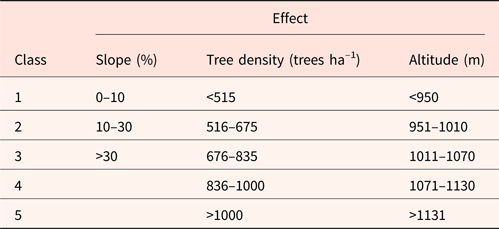
Reproductive (cone-bearing) tree variability among monitoring plots was also assessed. We applied several general mixed models, using SPSS (Norusis, Reference Norusis1997) version 20 software for Windows (IBM SPSS Statistics 2011, IBM Corp.), testing the available variables: the stand (tree) density (classified in five classes: <515, 516–675, 676–835, 836–1000 and >1000 trees ha–1), the altitude (<950, 951–1010, 1011–1070, 1071–1130 and >1131 m), the soil substrate (flysch or limestone), the aspect (N, S, E, NW, NE and SE) and the slope (<10, 10–30 and >30%) of the monitoring plots, and also their interactions. We isolated the significant variables among others, which make sense from an environmental perspective (Table 2), using Pearson correlation analysis. We further performed Spearman's rank correlation analysis to evaluate the relationship between tree density and mean cone production per monitoring plot. Similar analysis, applying several general mixed models, was used in order to test factors affecting seedling density as well as seedling survival.
Parameters of the generalized mixed model explaining cone production

In addition, Pearson correlation analysis (P < 0.05) was employed to 2013 field measurements, contrasting the reproductive trees (i.e. number of cones per tree) versus their tree height and breast diameter; the latter data were log-transformed prior to analysis. The dependent variable was the number of current year cones in a given individual A. cephalonica tree.
Concerning seedling density, Pearson (two-tailed) correlation coefficient analysis (P < 0.01) was implemented contrasting the annual cone crop (number of cones m–2) per plot in monitoring years 2013, 2014 and 2015, with mean seedling density per plot (seedlings m–2) in May and October of the next year, following seed dispersal.
Finally, to assess seedling survival differences between seedling–sapling cohorts and the environmental conditions prevailing in the monitoring plots, we performed a survival analysis (Maschinski et al., Reference Maschinski, Baggs and Sacchi2004) using the Kaplan-Meier method by SPSS (Norusis, Reference Norusis1997). We compared survival curves and mean survival time of each seedling cohort growing in the two natural habitats, i.e. the unburned forest and the ‘islets’. To investigate whether different cohorts experience the same death rate over a given time period, we tested the differences in shapes of survival curves for seedlings emerging in 2013 to 2016 and saplings (older than 1, 2 or 3 years) of the previous years, by the log-rank (Mantel-Cox), Breslow (generalized Wilcoxon) and Tarone-Ware tests (Pyke and Thompson, Reference Pyke and Thompson1986).
Results
Cone production
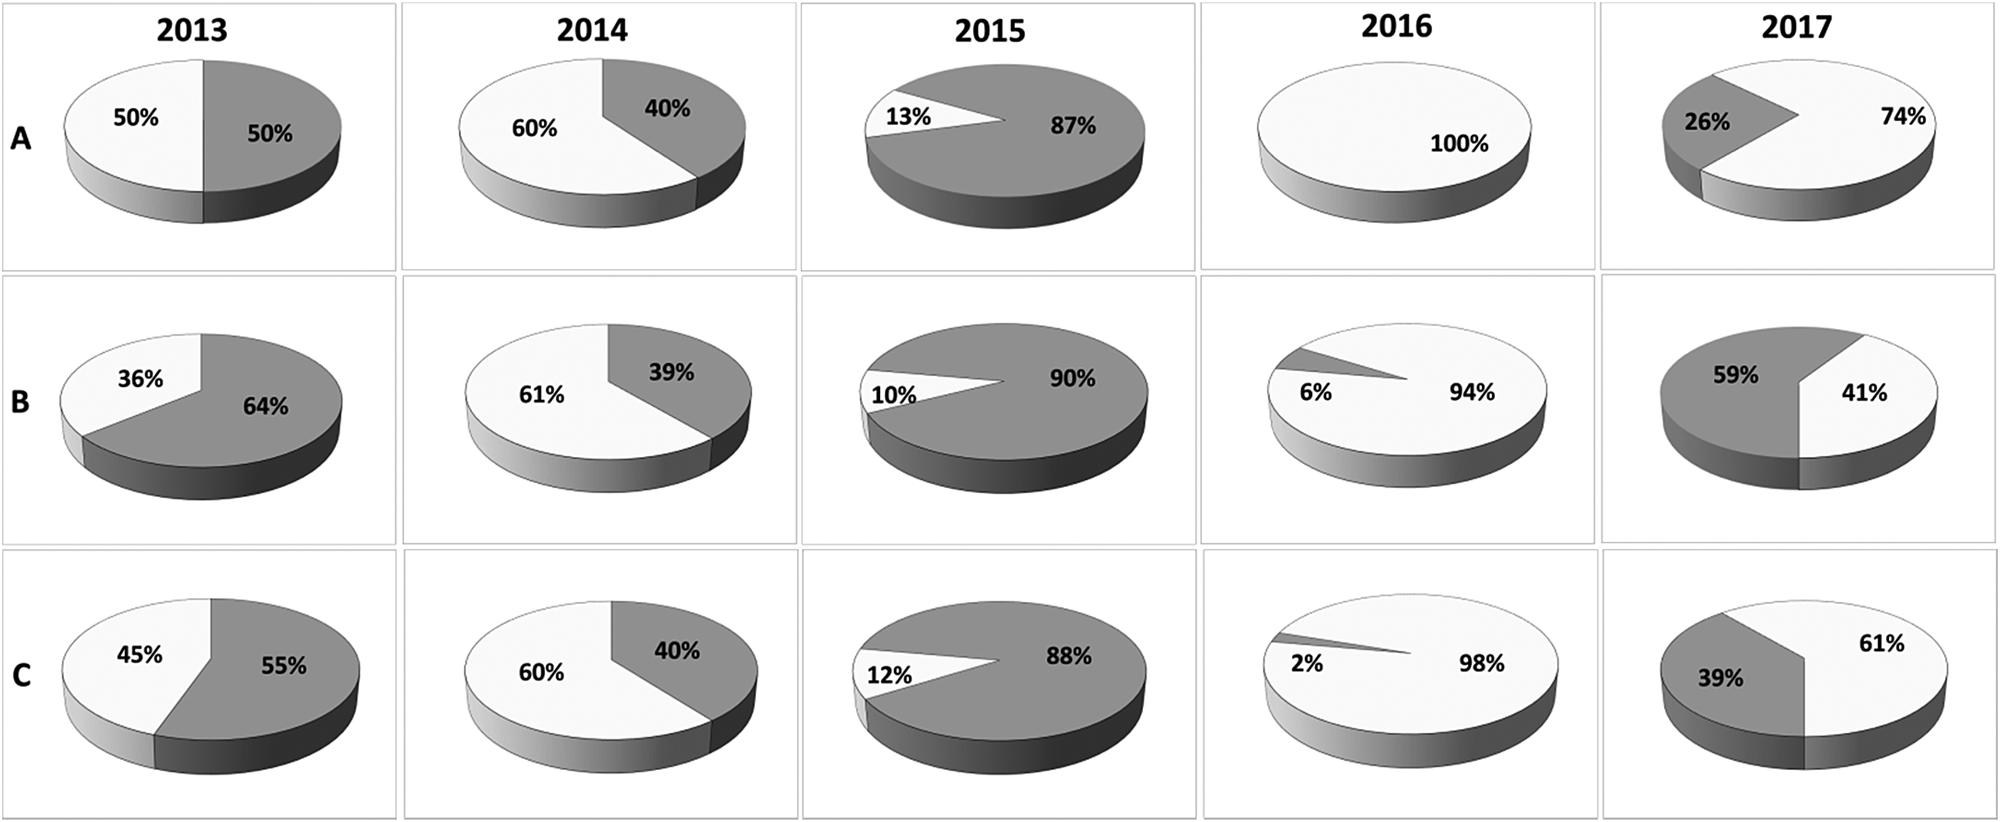
An exceptionally high percentage (88%) of cone-bearing A. cephalonica trees was recorded in 2015 (Fig. 3). For the remaining 4 years of the 5-year monitoring period, the percentage of cone-bearing trees ranged from 39% (2017) to 55% (2013), with an exception of the year 2016, with very low (2%) cone production.
Annual cone-bearing incidence of Abies cephalonica forest in Parnitha NP; percentage of cone-bearing trees (grey) and trees without cones (white). Cones were counted in autumn (September–October) in the unburned forest (A, n = 80), the unburned ‘islets’ (B, n = 50) and the accumulated, total number of monitoring plots (C, n = 130 trees).

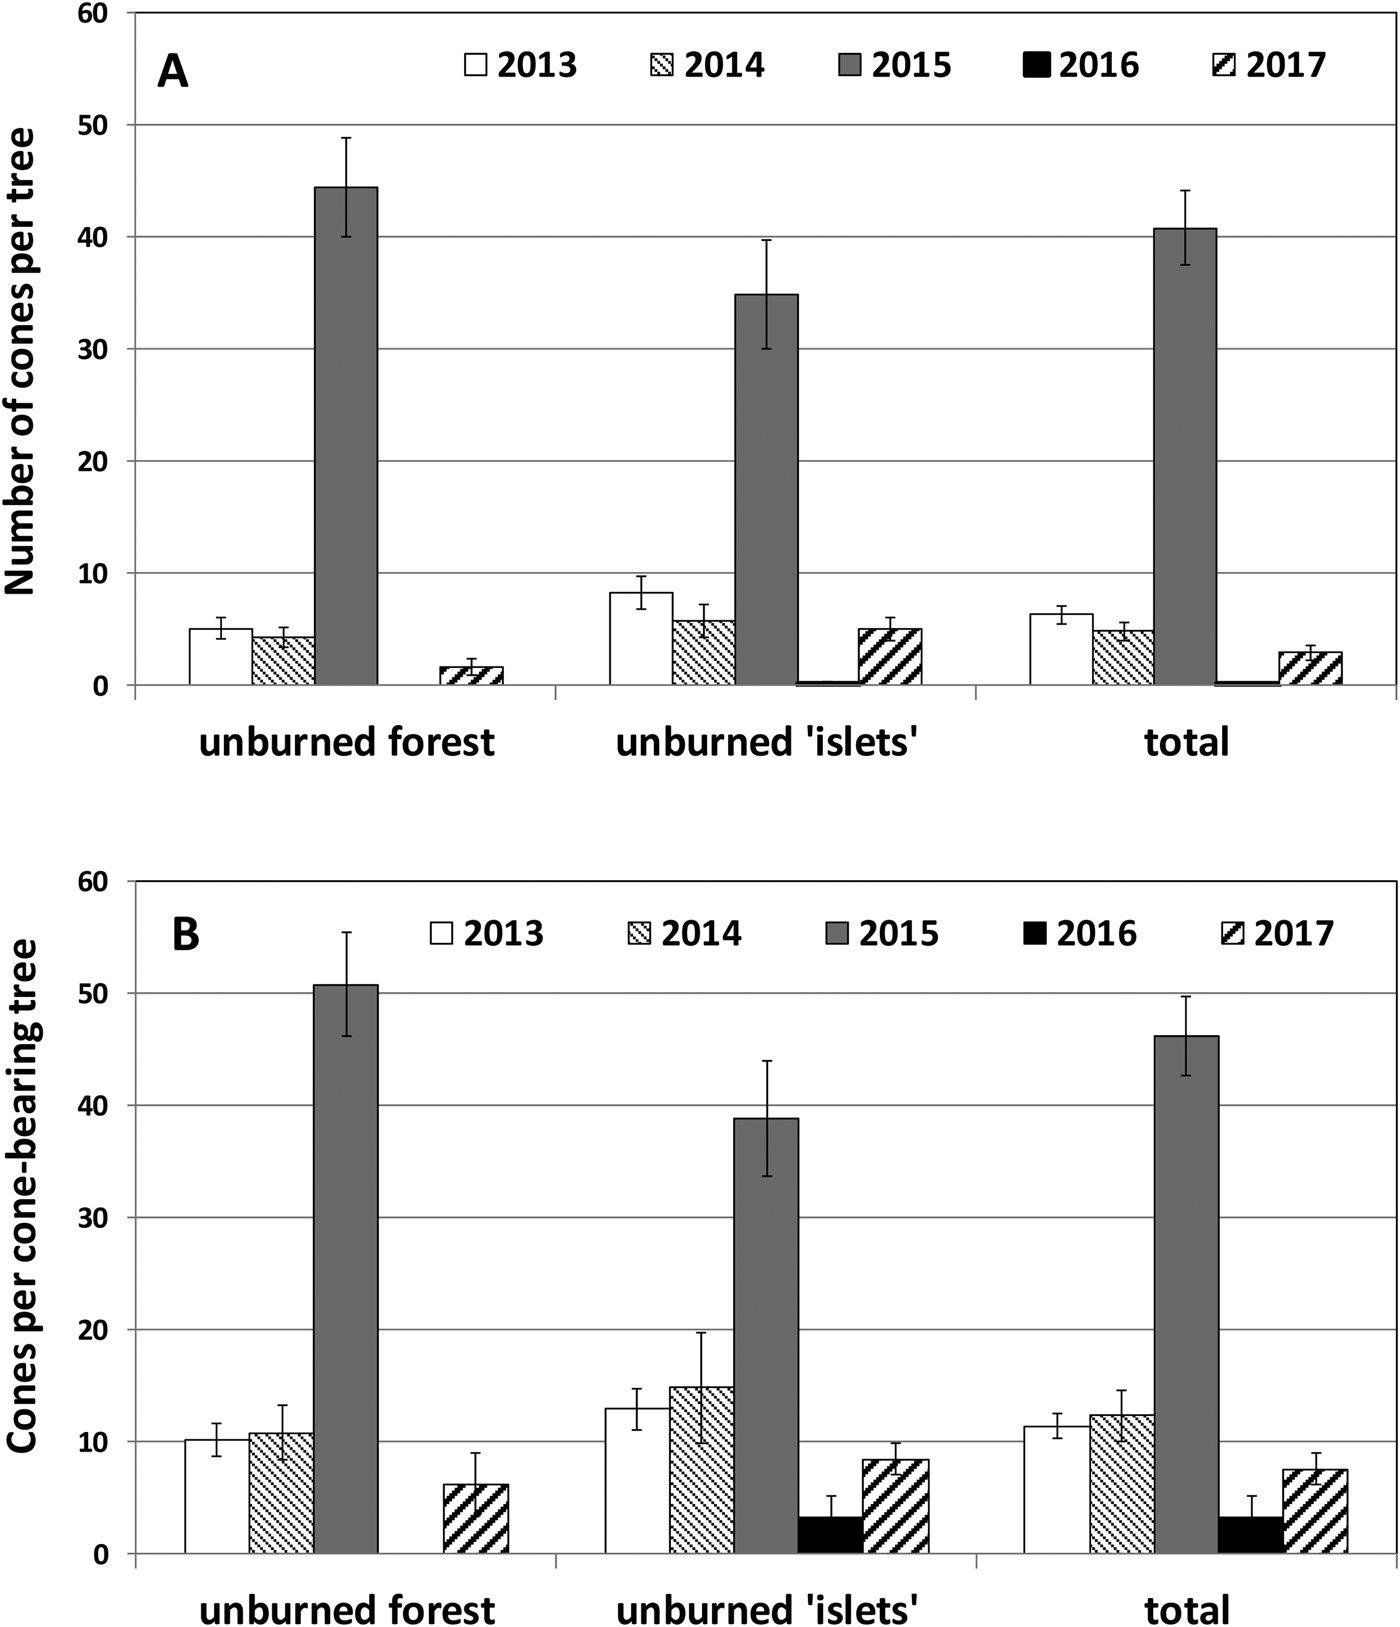
The overall average annual cone production was analysed on the basis of either all trees monitored (i.e. both reproductive trees and non-reproductive ones with zero cones; Fig. 4A) or with only the reproductive trees (i.e. only those bearing cones; Fig. 4B). The number of cones produced per tree, in all monitored trees, was 40.8 ± 3.4 (0–181, minimum–maximum) for the year 2015, which is thus considered a masting year. The above value ranged from 2.9 ± 0.6 (0–59 minimum–maximum) to 6.3 ± 0.8 cones/tree (0–40 minimum–maximum) for the intermediate production years, and 0.08 ± 0.06 (0–7 minimum–maximum) for the leanest crop year (2016), one immediately following the masting year (Fig. 4A). When including only the reproductive trees (Fig. 4B), the overall annual mean number of cones per tree is obviously higher: 46.2 ± 3.5 cones per tree (1–181 minimum–maximum) in the masting year, ranging from 7.5 ± 1.4 (1–59 minimum–maximum) to 12.3 ± 2.3 (1–98 minimum–maximum) in the intermediate years. In the leanest crop year, the overall annual average cone production recorded was only 3.3 ± 1.9 (1–7 minimum–maximum). Overall, among the 130 A. cephalonica trees included in the five monitoring periods, one tree (0.8%) died during the study period, 12 trees (9.2%) were never observed to produce cones and only two trees (1.5%) produced cones in all five monitoring years.
Number of cones per tree produced yearly, shown as an average value, for either all Abies cephalonica tagged trees (A) and only for the cone-bearing ones (B) in the unburned forest (n = 80), the unburned ‘islets’ (n = 50) and the accumulated, total number of monitoring plots (n = 130 trees).

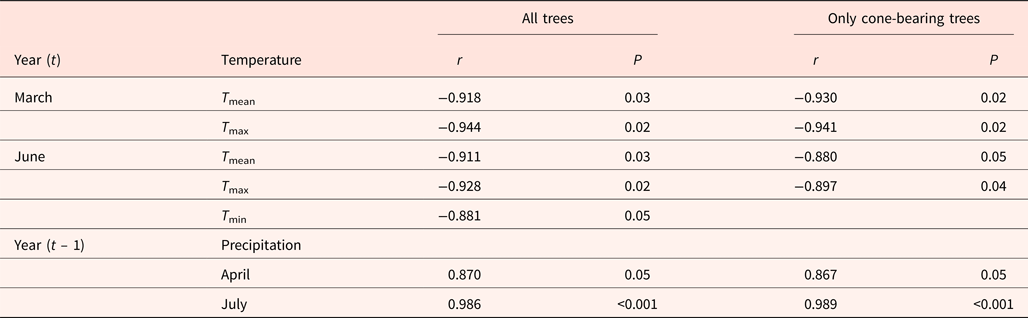
A statistical analysis was carried out in an attempt to reveal whether cone production is correlated with various temperature values of the current year (t) and/or precipitation of the previous year (t – 1). Significant Pearson correlation results for both cone- and non-cone-bearing trees with temperature and precipitation are presented in Table 5. Overall, March and June temperatures of the current year (t) show negative correlation, meaning that low spring temperatures in the maturation year favour cone production. April and July precipitation of the previous year (t – 1) show a positive correlation with cone production, meaning that spring and summer precipitation of the previous year also favour cone production.
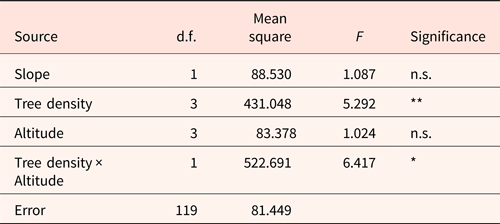
Analysis was based on individual values and was performed at a significance level of a = 0.05. The classes of the effects of slope, density and altitude are presented in Table 2. The following mixed model was used in the analysis:
 $$Cp_{ijmk} = \mu + s_i + d_i + a_m + d_j{^\ast}a_m + \; e_{ijmk}$$
where Cp ijmk is field measurement of the number of cones per tree of the k th tree, i th slope, j th density and m th altitude class, as dependent variable, μ is the fixed population mean cones per tree of all individuals, s i is the random effect of the i th slope, d j is the random effect of j th density, the random effect of m th altitude, d j*a m is the interaction between j th density and m th altitude and e ijmk is the random residual error of k th tree, j th density and m th altitude. All effects were considered random. The final model includes the d j*a m interaction which isolated among the others using Pearson correlation and makes sense from an environmental perspective.
The dependent variable of cone production can be explained by stand (tree) density (number of trees per ha) and the interaction between tree density and altitude (Table 3) for the masting year. The rest of the variables did not significantly add to the ability of the model to explain the cone production and thus they were not included in the final model.
ANOVA table for the general mixed model

**P < 0.01, *P < 0.05; n.s., not significant.
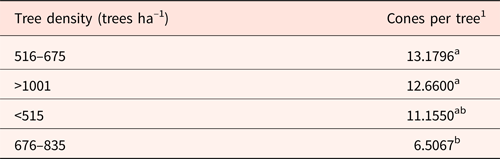
The variations among several tree density and altitude values for cone production are evident from the analysis of variance. The analysis showed that there were statistically significant differences only among tree density (P < 0.01) and the interaction tree density–altitude (P < 0.01) (Tables 2 and 4). Furthermore, the analysis showed a negative correlation between tree density and mean cone production (r s = – 0.505, P = 0.048).
Duncan's multiple comparison of stand (tree) density factors towards cone production

1Means followed by the same letter are not statistically different.
Pearson correlations results among the eight climatic variables (T mean, T max, T min and precipitation) for the current (t) and the previous year (t – 1), considered as possible drivers of Abies cephalonica cone production

The mean number of cones per tree was examined in all marked trees and in cone-bearing trees, respectively, for the growing season (March–October) of the period 2012–2017. Significance level: P < 0.05.
Regarding seedling density and survival, none of the explanatory variables (Table 2) was found statistically significant applying the mixed model. Finally, no significant correlation was found between the number of A. cephalonica cones per tree with tree height and diameter at breast height, either in absolute or in log-transformed values.
Seedling density
The absolute values of A. cephalonica seedlings in all transects were 408, 371, 156 and 2.639 for 2013, 2014, 2015 and 2016, respectively (n = 3.574 seedlings overall). The absolute values for older saplings were much lower compared with the young seedlings, e.g. in May 2013, 29, 47 and 147 saplings older than 1, 2 and 3 years of age, respectively, were counted.
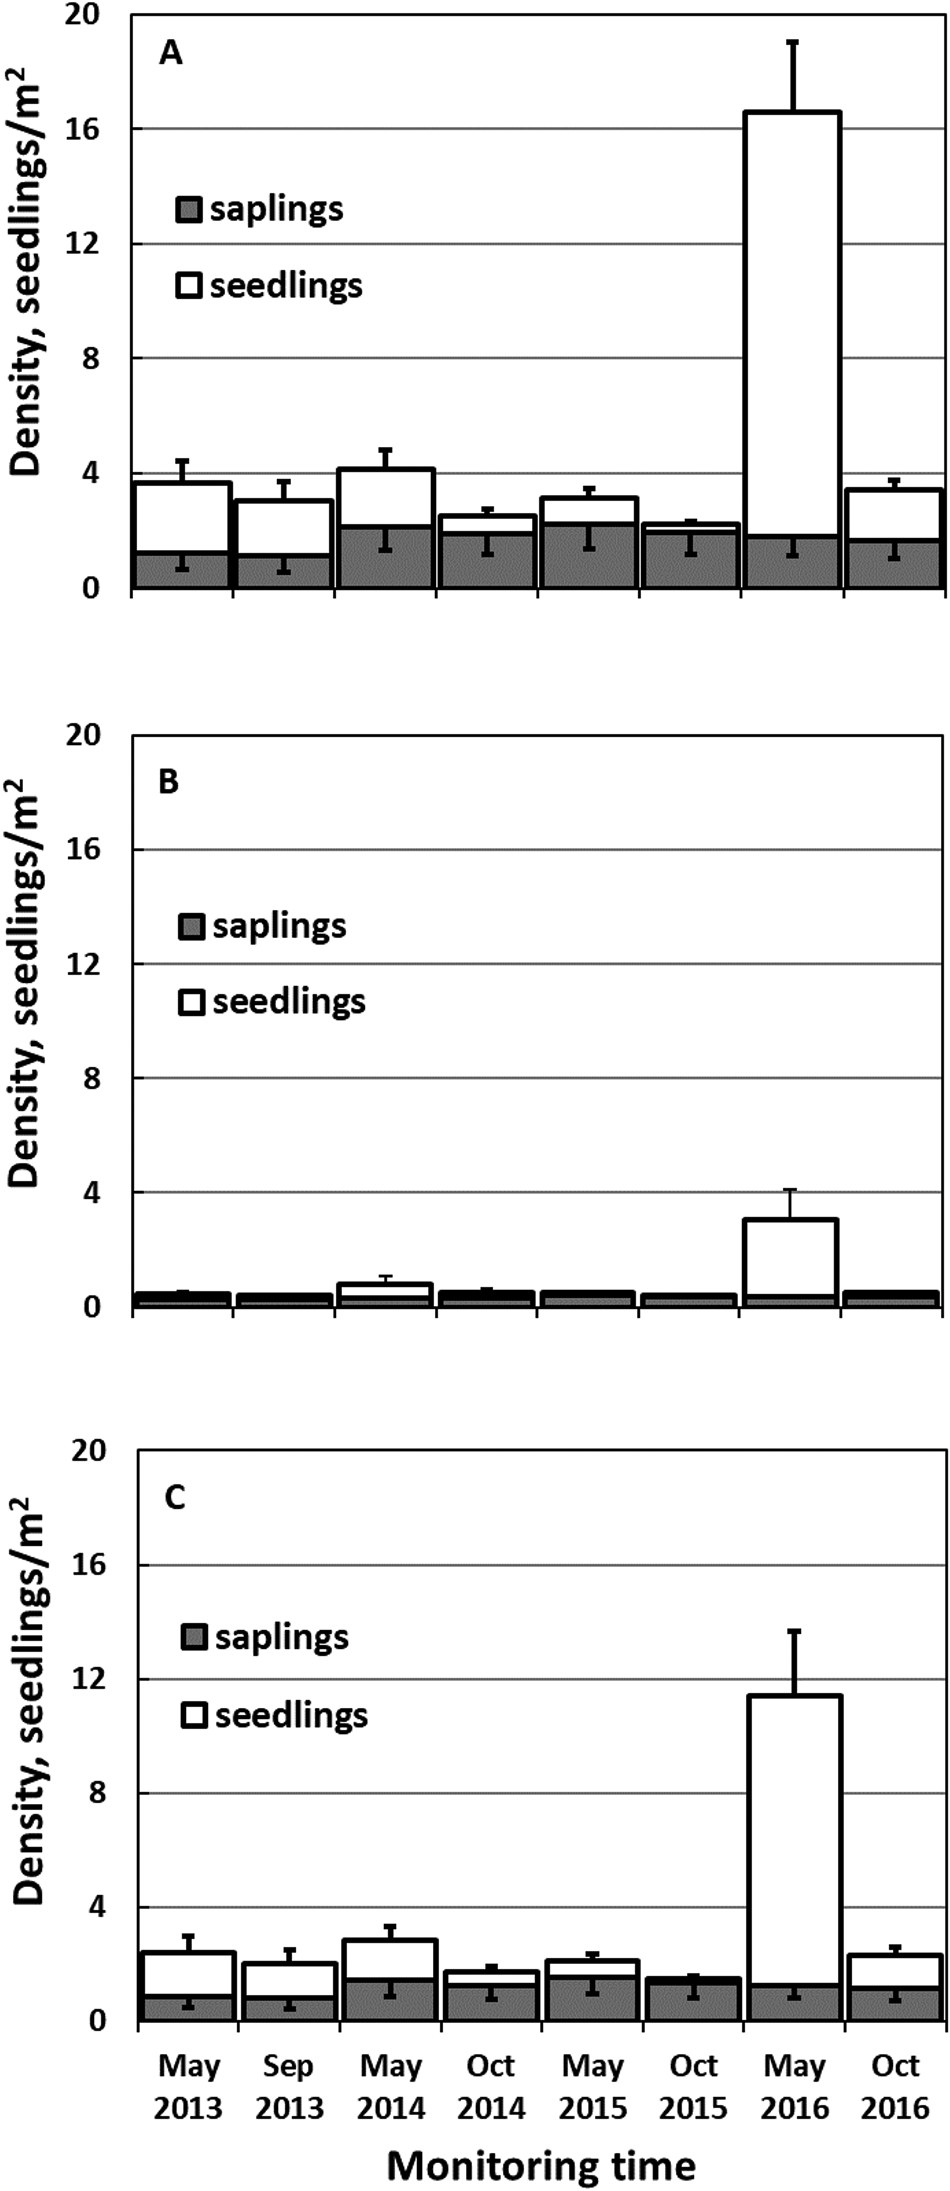
In all monitoring plots, highest seedling density values were observed during spring 2016, just following the masting year (Fig. 5). Particularly for the unburned forest (Fig. 5A), the recently emerged, young seedlings (May 2016) accounted for a significantly high mean value (14.8 ± 2.4 seedlings per m2), resulting in an overall mean A. cephalonica seedling and sapling density of 16.6 ± 2.5 per m2. In the previous monitoring years, the corresponding density values were quite low: 3.7 ± 1.1 (May 2013), 4.1 ± 1.3 (May 2014) and 3.1 ± 0.9 (May 2015) seedlings and saplings per m2. In the unburned ‘islets’, density values (Fig. 5B) were much lower than the ones reported for the unburned forest. Maximum density was also observed in the first spring after the masting year (May 2016), similarly to the unburned forest; 2.7 ± 1.1 seedlings per m2 and 3.1 ± 1.1 seedlings and saplings per m2. In addition, in the previous monitoring years, density values were significantly lower than the above values observed in the unburned forest: 0.4 ± 0.2 (May 2013), 0.8 ± 0.4 (May 2014) and 0.5 ± 0.2 (May 2015) seedlings and saplings per m2. In total, mean natural regeneration, expressed as the average seedling and sapling density per m2, amounted to 11.4 ± 2.5 in May 2016, with a remarkable seedling contribution, 10.2 ± 2.3 (Fig. 5C) during the first spring after the masting year (2015). In the previous years, the corresponding values were significantly lower, always less than 3 seedlings and saplings per m2 (2.4 ± 0.8 in May 2013, 2.9 ± 0.9 in May 2014 and 2.1 ± 0.6 in May 2015). Overall, A. cephalonica seedling and sapling density in the autumn was almost stable (approximately 2 saplings per m2), ranging between 1.5 ± 0.5 (minimum, October 2015) and 2.3 ± 0.6 (maximum, October 2016) per m2. Finally, in the fully burned forest adjacent to the unburned ‘islets’, natural regeneration was always nil, showing the inability of the species to regenerate after fire in the open.
Abies cephalonica seedling and sapling density (white and grey areas, respectively) monitored in spring (May) and autumn (September–October) in the unburned forest (A, n = 8), the unburned ‘islets’ (B, n = 5) and the accumulated, total number of monitoring plots (C, n = 13). Vertical lines represent ± SE.

The Pearson correlation coefficient analysis showed a strong, positive relationship between the mean cone density per plot (number of cones per m2) and the mean seedling density per plot (seedlings per m2), recorded in the following spring (May, r = 0.615, P < 0.001) and autumn (October, r = 0.481, P < 0.001), respectively.
Seedling survival
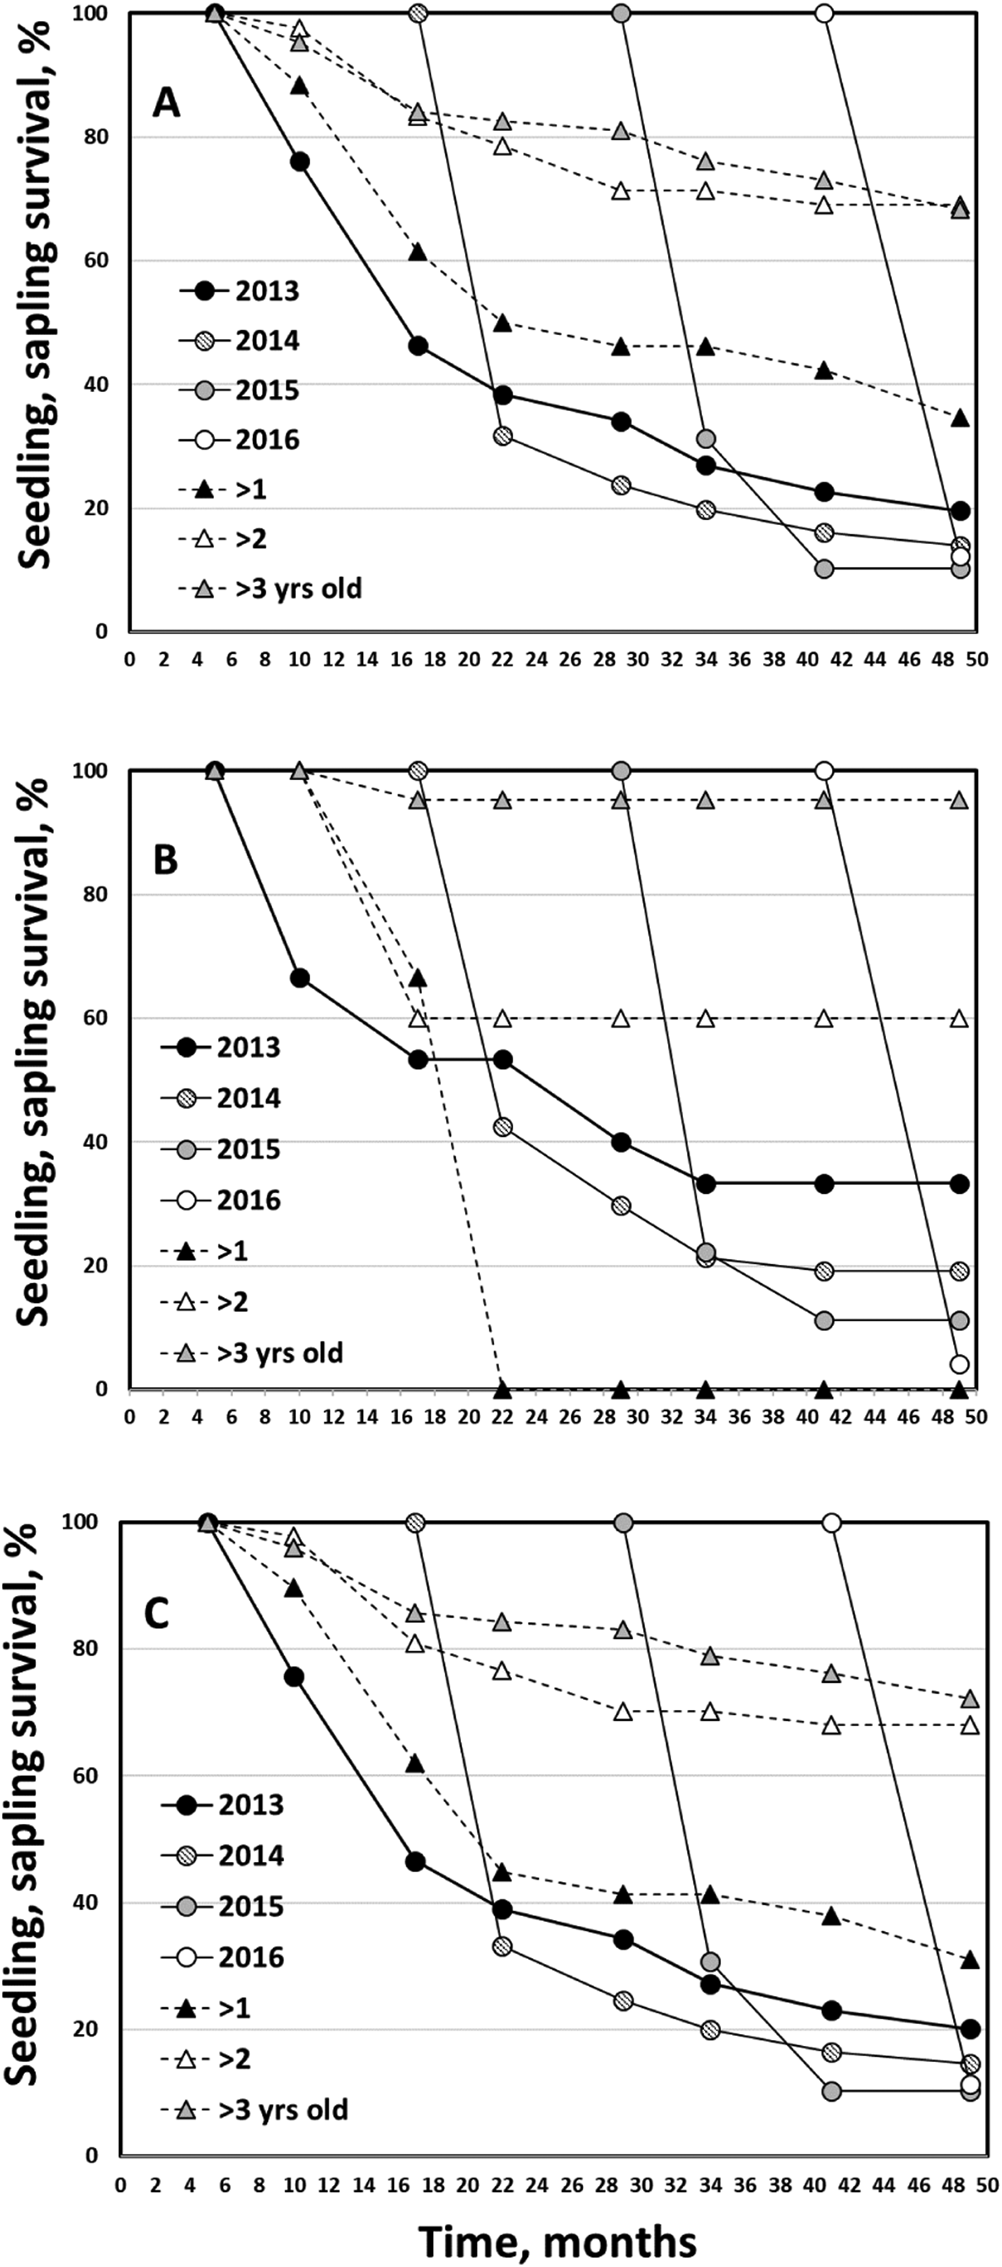
The survival (%) for each annual seedling cohort (2013, 2014, 2015 and 2016) as well as that for corresponding saplings (i.e. older than 1, 2 or 3 years of age) are presented in Fig. 6. Seedling survival in October, 5 months after seedling emergence and following the first summer period, was 75.7% (2013), 33.2% (2014), 30.8% (2015) and 11.4% (2016) for each cohort. The low survival rate of the 2016 cohort is disparate to what was expected based on the high number of seedlings. One year after seedling emergence, even fewer seedlings survived: 46.6% (2013), 24.5% (2014) and 10.3% (2015). Therefore, less than 50% of the seedlings survived the first year that is crucial for seedling establishment, both through the summer drought and the cold winter conditions. However, seedling mortality rate is not as high as in the first year of seedling life. In addition, seedlings older than 1 year of age were quite vulnerable, compared with the already established saplings (older than 2 or 3 years of age), as their final survival percentage was found to be 31.0%. The survival of the already established saplings, older than 2 and 3 years of age was comparatively high (68.1 and 72.1%, respectively), in the unburned forest (Fig. 6A) or in the ‘islets’ (Fig. 6B).
Survival (%) of Abies cephalonica seedlings (cohorts of 2013, 2014, 2015 and 2016) and saplings (older than 1, 2 and 3 years of age at time zero) in the unburned forest (A, n = 8), the unburned ‘islets’ (B, n = 5) and the accumulated, total number of monitoring plots (C, n = 13). Time zero is May 2013: monitoring took place twice annually, in spring (May) and autumn (September–October) until October 2016.

The mean sapling survival time was 36.3 ± 1.2 months (>1 year), 39.2 ± 0.5 months (>2 years) and 39.6 ± 0.3 months (>3 years) in the unburned forest (Fig. 6A). In the ‘islets’ (Fig. 6B), the mean survival time for 1-, 2- and 3-year-old saplings was 16.0 ± 1.1, 38.1 ± 1.9 and 40.8 ± 0.2 months, respectively. The survival analysis (significance level 5%) of the three sapling groups, i.e. older than 1, 2 and 3 years of age, resulted in among-group significant differences of the mean survival distributions, with an average survival time of 39.2 months (log-rank test: χ2 = 41.519, P < 0.001, Breslow: χ2 = 36.819, P < 0.001, and Tarone-Ware: χ2 = 40.227, P < 0.001, d.f. = 2, Fig. 6C). Younger saplings (1–2 years old) show lower survival levels than older ones (>2 or >3 years of age). Moreover, younger saplings in the unburned forest survive longer than the corresponding ones in the unburned ‘islets’. For seedlings in the unburned forest (Fig. 6A), the mean survival time was calculated as 33.2 ± 0.4 (2013), 18.7 ± 0.5 (2014), 9.8 ± 0.4 (2015) and 5.0 ± 0.0 months (2016). In the unburned ‘islets’ (Fig. 6B), the corresponding mean survival time was 34.8 ± 1.8, 23.8 ± 1.5, 9.3 ± 1.6 and 5.0 ± 0.0 months for the seedling cohorts of 2013, 2014, 2015 and 2016, respectively. The survival analysis (significance level 5%) of the seedlings emerged during the period 2013–2016 resulted in significant differences of the mean survival distributions with an average survival time of 17.9 months (log-rank test: χ2 = 2671.1, P < 0.001, Breslow: χ2 = 2665.6, P < 0.001 and Tarone-Ware: χ2 = 2673.4, P < 0.001, d.f. = 3).
Discussion
Masting has widespread influences on forest ecosystem dynamics, e.g. on growth trade-offs, pollen, seed production and dispersal, establishment success, species migration, effects of silvicultural treatments and ecosystem resilience to natural disturbances or climate change (Vacchiano et al., Reference Vacchiano, Ascoli, Berzaghi, Lucas-Borja, Caignard, Collalti, Mairota, Palaghianu, Reyer, Sanders, Schermer, Wohlgemuth and Hacket-Pain2018). A masting year is characterized by the significant increase of both the percentage of cone-bearing trees (ca 90% compared with 40–55% in the intermediate years) and the absolute number of cones per tree (ca 40 cones per tree compared with 3–6 cones in the intermediate years) in the study species. The leanest crop was reported for the year immediately following the masting year, with a remarkable reduction in reproduction (only 2% of cone-bearing trees, 0.08 cones per tree). These findings are further accentuated by additional reproductive traits of A. cephalonica; seed viability and germinability attain significantly higher values during masting years, while unsound and poorly germinating seeds are produced during the lean ones (Daskalakou et al., Reference Daskalakou, Koutsovoulou, Mavroeidi, Tsiamitas, Kafali, Radaiou, Ganatsas and Thanos2018). Similar results regarding cone production have been reported for A. alba Mill., the closest European relative to A. cephalonica, with an average percentage of trees without cones below 2.5% in a high production year and above 81.5% in the year of lowest production (Davi et al., Reference Davi, Cailleret, Restoux, Amm, Pichot and Fady2016). Moreover, in agreement with our results, cone crops in A. lasiocarpa were at least 50% smaller in the particular years preceded by a heavy cone crop (Woodward et al., Reference Woodward, Silsbee, Schreiner and Means1994).
Disentangling the exogenous and endogenous factors that affect cone production remains very challenging (Davi et al., Reference Davi, Cailleret, Restoux, Amm, Pichot and Fady2016). Regarding the correlation of tree size and masting there have been contradictory results in various conifer species (Chalupka, Reference Chalupka, Tjoelker, Boratynski and Bugala2007; Haymes and Fox Reference Haymes and Fox2012; Davi et al., Reference Davi, Cailleret, Restoux, Amm, Pichot and Fady2016; Nygren et al., Reference Nygren, Rissanen, Eerikäinen, Saksa and Valkonen2017), while in the present study, cone production was not found to be correlated to tree size. In deciduous oaks, tree age, diameter at breast height and crown area may be linked to acorn production, but these factors cannot predict acorn production capacity (Brooke et al., Reference Brooke, Basinger, Birckhead, Lashley, McCord, Nanney and Harper2019).
By taking into account exogenous factors affecting cone production, competition with neighbouring trees has been an important factor in generating reproductive heterogeneity (Haymes and Fox, Reference Haymes and Fox2012; Rossi et al., Reference Rossi, Morin, Laprise and Gionest2012). In agreement with literature (Pallardy, Reference Pallardy2008), the results of this study showed that lower tree density (trees per ha) of A. cephalonica seems to result in a higher cone production per tree and hectare, which might be attributed to the reduced canopy size and/or an increased access to resources. Moreover, stand density and light availability to the crown may influence acorn production potential of oak individuals; therefore management practices that increase the amount of sunlight reaching the tree crown are proposed (Brooke et al., Reference Brooke, Basinger, Birckhead, Lashley, McCord, Nanney and Harper2019). However, other abiotic variables tested, e.g. soil substrate, altitude, slope and aspect did not seem to significantly affect the annual mean cone production.
Although the role of climate cannot be accurately assessed with short-term data, e.g. less than 5 years (Davi et al., Reference Davi, Cailleret, Restoux, Amm, Pichot and Fady2016), in the present study the attempted correlation has provided indications that regional climatic conditions influence the A. cephalonica reproduction process. High air temperatures during March and June (mean and maximum) of the maturation year (t) resulted in lower cone production. This period of the cone maturation year coincides with the pollination of the study species (Politi et al., Reference Politi, Georghiou and Arianoutsou2011), thus it could be possible that spring air temperatures are crucial for pollination facilitation and cone/seed production. In addition, monthly precipitation of April and July, 1 year before cone maturation (t – 1), indicate that water supply has a positive correlation with further cone production. Therefore, there is an indication that water availability during early bud burst in April and in July, a crucial period for growth of Abies (Aussenac, Reference Aussenac2002), may lead to the manifestation of a masting year. Taking into account both the monitoring of the reproductive traits in consecutive years, as well as the analysis of the environmental and climatic conditions, it is most probable that both environmental (climate, tree density) and endogenous factors (preceding or following a masting year) define cone production in A. cephalonica, in accordance with previous work (e.g. Davi et al., Reference Davi, Cailleret, Restoux, Amm, Pichot and Fady2016). Further research based on long-term monitoring data is suggested for the interpretation of masting, weather influence (e.g. Moreira et al., Reference Moreira, Abdala-Roberts, Linhart and Mooney2014, 2015; Ascoli et al., Reference Ascoli, Maringer, Hacket-Pain, Conedera, Drobyshev, Motta, Cirolli, Kantorowicz, Zang, Schueler, Croisé, Piussi, Berretti, Palaghianu, Westergren, Lageard, Burkart, Gehrig-Bichsel, Thomas, Beudert, Övergaard and Vacchiano2017) and regeneration dynamics.
Densities of A. cephalonica saplings (older than 1 year of age) also fluctuated in time, but the range of those changes was much lower than in the case of 1-year-old seedlings. Seedling and sapling density values were lower than 2.5 individuals per m2, similar to the results presented for A. alba (Szewczyk and Szwagrzyk, Reference Szewczyk and Szwagrzyk2010). Even though density fluctuations in the spring, particularly attributed to the new seedlings after a masting year, seedling and sapling density was overall almost stable in the autumn (approximately 2 seedlings and saplings per m2) throughout the monitoring period of the present study. Comparable seedling density fluctuations were recorded in the spring within the unburned ‘islets’. Despite the fact that A. cephalonica seedling and sapling density values are quite lower in the ‘islets’ (approximately 0.5 seedlings and saplings per m2 during the autumn), their contribution to the forest preservation and regeneration may be substantial.
Several factors affect seedling emergence and mortality in Abies spp., e.g. the understory light environment, canopy openings, drought, summer temperatures and past forest management (Sneyers et al., Reference Sneyers, Van Miegroet and Dafis1986; De Andrés et al., Reference De Andrés, Camarero, Martínez and Coll2014; Paluch et al., Reference Paluch, Kołodziej, Skrzyszewski, Bartkowicz and Gruba2016). A reproductive plasticity was described in Ainos NP, as manifested in both the size of annual A. cephalonica seedling cohorts and the fraction of the surviving ones with respect to the habitat characteristics (Politi et al., Reference Politi, Arianoutsou and Stamou2009). In the present study, the effect of light was indirectly assessed, by correlating the stand tree density (trees per ha) with the cone production in the monitoring plots. It was found that mean cone density per plot (number of cones per m2) positively affects seedling density. Other abiotic factors such as elevation, aspect, slope steepness and ground cover type could not significantly explain any variability in the A. cephalonica regeneration density.
Νatural regeneration, i.e. established seedlings, in the open, post-fire conditions was always nil (transects within the fully burned forest) in the autumn, whereas in spring only a few seedlings (less than 0.02 per m2 in each monitoring year) were counted, in agreement with Ganatsas et al. (Reference Ganatsas, Daskalakou and Paitaridou2012). In addition, the distance from the unburned patches, slope and cover of woody species significantly affected A. cephalonica seedling emergence in spring and early summer vegetation records (Christopoulou et al., Reference Christopoulou, Kazanis, Fyllas and Arianoutsou2018). However, in the north limits of the species distribution in Greece, where a more humid and cold climate is prevalent, the post-fire A. cephalonica regeneration density decreased abruptly with distance from the remnant living stands (Raftoyannis and Spanos, Reference Raftoyannis and Spanos2015).
The initial stages of the plant life cycle (germination, seedling emergence and recruitment) are critical for regeneration dynamics and the newly germinated seedlings are at a great disadvantage compared with already established plants, with intense competition for light, water and nutrients (Fenner and Thompson, Reference Fenner and Thompson2005). Seedling mortality during the first year after emergence is widely known to be particularly high, often amounting to 90%, in many tree species (Kozlowski, Reference Kozlowski2002). In the present study, seedling mortality during the first post-emergence summer period varied considerably among years and plots, ranging between 24 and 89%. The highest seedling mortality percentage was observed in the year following masting, as was expected given of the high absolute numbers of emerged seedlings, in line with the findings of Politi et al. (Reference Politi, Arianoutsou and Stamou2009). The lowest seedling mortality observed might be attributed to the comparatively wetter than average conditions that prevailed in the two previous years (2011 and 2012), in the study site. This is also supported by the fact that the optimal species occurrence is associated with a sub-humid climate with average precipitation between 700 and 800 mm, the latter being considered a requirement for the effective conservation of A. cephalonica (Aussenac, Reference Aussenac2002).
In the last part of our study, the survival analysis resulted in statistically significant differences in seedling survival among years and plots, both in the unburned mature vs the unburned ‘islets’. Each sapling group and seedling cohort seems to follow different survival dynamics. However, seedlings surviving after the first year of their life cycle, similarly to the older, already established ones, show a significantly higher (ca 70%) survival percentage in all monitoring plots that may contribute substantially to the forest regeneration. Furthermore, the survival analysis of the saplings has demonstrated that those saplings that persist for more than 2 years have a significantly higher probability of survival, pointing to a duration of 2 years as the decisive time period of seedling/sapling regeneration. In addition, the survival of saplings has been lower in the unburned ‘islets’ compared with the unburned forest, indicating that microclimatic conditions could affect survival. Finally, negative factors of seedling mortality like the disturbance by red deer (Cervus elaphus L., Cervidae) and also the human impact, are affecting the unburned ‘islets’ more.
Conclusions
This study addressed the masting and regeneration dynamics in conifers, using Abies cephalonica as a study species. A masting year is characterized by the significant increase of both the percentage of cone-bearing trees and the absolute number of cones per tree. The leanest crop year following the masting year, is characterized by a remarkable reduction in cone production. Tree density and regional climatic conditions affect the reproduction process, in particular temperature during spring of the maturation year and precipitation during spring and summer of the previous year. Each seedling cohort and sapling group seem to follow different survival dynamics. However, seedling survival was stabilized to a representative level of 10 to 20% after 3 years of monitoring. Thus, although the highest density of seedlings occurs the first spring following masting, seedling mortality during the first post-emergence summer period, was significantly higher compared with non-mast years. The low recruitment of the study species appears not to be due to a limitation in seed or young-seedling supply, but rather by factors operating at the established-seedling stage. Given the fact that natural tree regeneration in forests is a key process ensuring forest sustainable management against climate change effects and wildfires, further research enhanced by long-term data is necessary in order to clarify the implications of masting.
Acknowledgements
The authors are grateful to Dr Vassiliki Gouma, Dr Asimina Skouteri, Dr Despina Paitaridou, Victoria Menteli and Panagiota-Effrosyni Radaiou for contribution to field work and overall support in the implementation of the project. We also thank the local Forest Department of Parnitha (Region of Attica) and the Management Body of Parnitha NP for their general assistance. We acknowledge the two anonymous reviewers whose comments/suggestions helped improve and clarify this manuscript.
Financial support
This work partially received funding in the framework of the national research project ‘Contribution to the post-fire management of Parnitha National Park’, assigned by the Hellenic Ministry of Environment and Energy, General Directorate of Development and Forest Protection and Agroenvironment and funded by the Green Fund (2013–2015).