
I. INTRODUCTION
Nanoporous gold (np-Au) is a widely studied model nanostructured material.Reference Biener, Hodge, Hamza, Hsiung and Satcher1–Reference Mameka, Markmann and Weissmüller3 This material exhibits several unique behaviors due to the high surface-to-volume ratio and bicontinuous structure of its interconnected Au ligaments and intervening void space as well as the distinctive properties arising from the nanoscale dimensions of the ligaments. In particular, significant experimental effort has been devoted to understanding its mechanical properties,Reference Mameka, Wang, Markmann, Lilleodden and Weissmüller4–Reference Roschning and Huber7 which include ductility in compression,Reference Hodge, Hayes, Caro, Biener and Hamza8 a “smaller is stronger” size effect for nanoscale ligament diameters,Reference Volkert and Lilleodden9,Reference Volkert, Lilleodden, Kramer and Weissmuller10 and pronounced strain hardening in compression due to densification.Reference Ruestes, Farkas, Caro and Bringa11 We present atomistic simulations of the response of np-Au to nanoscale spherical indentation, providing a point of comparison to previous experimental studies as well as insights into the fundamental mechanisms governing the mechanical properties of this material.
The mechanical behavior of np-Au has been studied using a variety of approaches, including nanoindentation as well and other techniques.Reference Mameka, Wang, Markmann, Lilleodden and Weissmüller4,Reference Balk, Eberl, Sun, Hemker and Gianola12–Reference Mangipudi, Epler and Volkert22 These investigations demonstrate that the standard Gibson–Ashby (G–A) scaling relationReference Gibson and Ashby23,Reference Gibson and Ashby24 describes the yield stress, σ, of np-Au remarkably well, provided that the yield stress of the ligaments, σl, is written as a function of ligament diameter, d, to account the size effect in ligament plasticity.Reference Wu, Heidelberg and Boland25–Reference Diao, Gall and Dunn30 Indeed, the yield strength of Au nanopillars may reach several GPa, as opposed to the 200–300 MPa yield stresses found in fully dense Au.Reference Hyde, Espinosa and Farkas31 This relation may therefore be written as
 $${\sigma \over {{\sigma _{\rm{l}}}\left( d \right)}} \approx 0.3\rho _{{\rm{rel}}}^{3{\rm{/}}2}\quad ,$$
where the relative density, ρrel = ρ/ρl, compares the average density, ρ, of np-Au to the density ρl of individual ligaments.
The G–A relation was originally developed for foams of much lower relative density than np-Au. The fact that it nevertheless represents the behavior np-Au well indicates that, to an excellent approximation, np-Au may be viewed as a connected network of independently deforming ligaments. However, there is growing recognition that as the relative density of np-Au approaches unity, its deformation behavior must increasingly come to resemble that of fully dense, polycrystalline Au.Reference Rodriguez-Nieva, Ruestes, Tang and Bringa32 One of the goals of the work presented here is to shed light on this transition.
Atomistic simulations are well-suited for investigating the nanoscale processes responsible for plastic deformation. Indeed, several such studies using molecular dynamics (MD) have been reported for nanoporous materials with relative densities larger than 0.5.Reference Ruestes, Farkas, Caro and Bringa11,Reference Crowson, Farkas and Corcoran33–Reference Ngô, Stukowski, Mameka, Markmann, Albe and Weissmüller37 However, while many experimental studies report investigations of np-Au using nanoindentation,Reference Biener, Hodge, Hamza, Hsiung and Satcher1,Reference Hodge, Biener, Hayes, Bythrow, Volkert and Hamza14,Reference Biener, Hodge, Hayes, Volkert, Zepeda-Ruiz, Hamza and Abraham38 corresponding atomistic simulations have not been performed until now. We report such simulations in this paper, focusing on the analysis of a densified layer that appears just under the indenter. In particular, we assess changes in deformation mechanisms during densification via analysis of shape change, shrinkage, and eventual collapse of pores in np-Au. We report results on the overall mechanical response to indentation in terms of the force versus indentation depth response, as well as the observed hardness as a function of indentation depth. We compare this response with that obtained from virtual compression tests and show that the behavior is qualitatively similar, controlled by densification of the material. We report the detailed evolution of the densified layer under the indenter and specifically address the mechanism of pore collapse that occurs in this layer.
II. MODELING TECHNIQUES
Similar to previous work,Reference Crowson, Farkas and Corcoran33,Reference Crowson, Farkas and Corcoran34,Reference Farkas, Caro, Bringa and Crowson39 we constructed an atomistic model of np-Au using a template generated by a phase field simulation. In this technique, spinodal decomposition is modeled using the Cahn–Hilliard equationReference Cahn and Hilliard40 under periodic boundaries in all three directions and the resulting order parameter distribution is used to guide the arrangement of atoms in the model. Although np-Au is usually synthesized through de-alloyingReference Erlebacher, Aziz, Karma, Dimitrov and Sieradzki41 and not through spinodal decomposition, the morphologies generated by these two processes have been shown to be comparable.Reference Crowson, Farkas and Corcoran33 The particular model used in this study is a single crystal with a relative density of 0.67 and ligament diameter just under 2 nm. The model is periodic in the [100] and [010] crystal directions and terminates with free surfaces normal to the [001] direction. Its dimensions are 107 × 107 nm in the former (periodic) directions and 21 nm in the latter direction. It contains approximately 10 million atoms.
Atomistic simulations were performed using the LAMMPS software.Reference Plimpton42 An embedded atom methodReference Daw and Baskes43 potential was used to describe interatomic bonding in Au.Reference Foiles, Baskes and Daw44 The structures were equilibrated at T = 1 K for 500 ps. During indentation, the temperature was maintained constant at 1 K to avoid any thermal effects. The pressure was kept at zero independently in the [100] and [010] directions using a Nosé–Hoover thermostat and barostat. After relaxation, a nondeformable spherical indenter of 30 nm radius was lowered onto the sample surface in the [001] direction. To prevent the model from simply translating downward under the applied load, the positions of atoms within an approximately 1-nm-thick layer on the surface opposite from the indenter were kept fixed. The technique for indentation is detailed in Ref. Reference Farkas45 and involves representing the indenter by the force it exerts on atoms in the np-Au model. The indentation process was carried out to a maximum penetration depth of 15 nm in 1.5 ns with an MD time step of 1 fs. Thus, our indentation speeds are much faster than those in experiments, as dictated by the available computing resources and the limitations of the MD technique.
Model structure visualization and crystal defect identification were performed using the OVITO software.Reference Stukowski46 Dislocations were analyzed using the Dislocation Extraction Aalgorithm (DXA).Reference Stukowski and Albe47 This technique involves constructing a closed path around a dislocation defect and mapping it to a perfect crystal lattice to compute the Burgers vector. The procedure is independent of the structural details of the dislocation core, it always yields the true Burgers vector of a dislocation, and no previous knowledge of possible dislocation types is required. Because surfaces can have great impact on, and, at the same time, are influenced by the deformation of such materials, monitoring the surface area and porosity are important analysis tools, and were also performed with the OVITO package.
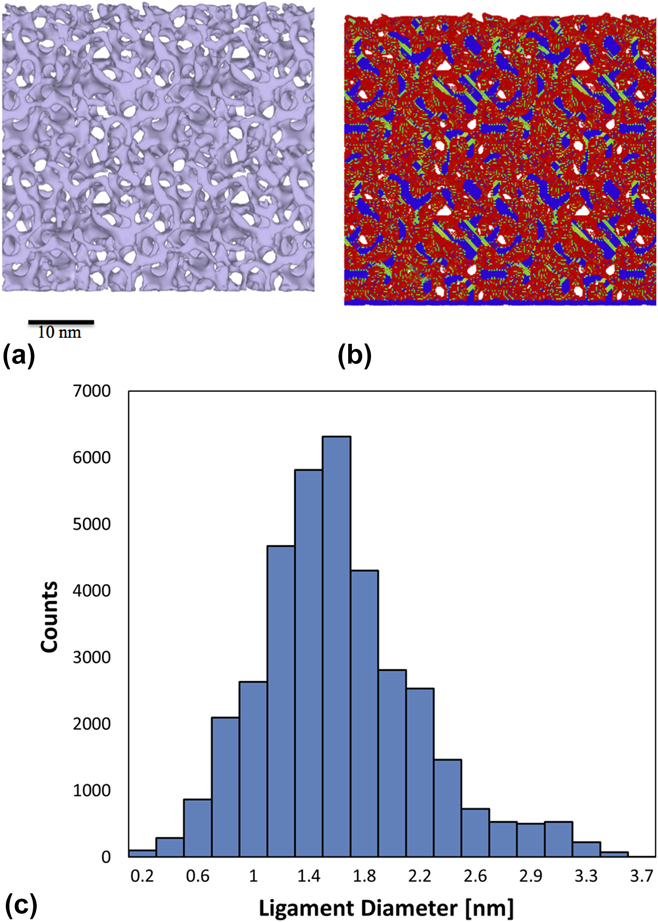
Figure 1 shows the structure of the model in its as-constructed state. The image at left [Fig. 1(a)] was obtained using a surface mesh created around the ligaments, whereas the image at right [Fig. 1(b)] shows atoms colored by the centrosymmetry parameter.Reference Kelchner, Plimpton and Hamilton48 The relaxed structure contains stacking faults that formed during relaxation. The average ligament diameter was determined to be ∼1.76 nm using the AQUAMI software, which was specifically developed for analyzing porous microstructures.Reference Stuckner, Frei, McCue, Demkowicz and Murayama49 The complete distribution of ligament sizes in the model is shown in Fig. 1(c). This non-Gaussian distribution is similar to that reported recently for the distribution of ligament sizes in experimental studies.Reference Badwe, Chen and Sieradzki50 In particular, it is important to note that the ratio of the distribution width to the average ligament size that we find in our digital samples (approximately 1/3) is consistent with those found in the experiments.
(a) 5-nm-thick cross section parallel to the free surface showing the relaxed structure of the as-constructed np-Au model: (a) surface mesh illustrating the ligament morphology; (b) atoms colored by the centrosymmetry parameter, showing free surfaces in red and stacking faults in green. (c) Distribution of ligament diameters determined using AQUAMI.

To understand the specifics of the densification process, the evolution of pore shapes and dimensions was also characterized using AQUAMI.Reference Stuckner, Frei, McCue, Demkowicz and Murayama49 Sequences of cross-section images representing successive stages in the compression simulation were rendered using OVITO. Each image was created from the 3D sample using a 2-nm slice cut parallel to the indentation direction and centered under the indenter tip. A connected components algorithm was used to uniquely label each pore. Individual pores were tracked and consistently labeled in all cross-sections with care taken to identify the coalescence, splitting, and collapse of pores. The area of each pore was determined from the number of pixels representing the pore in each image. Pore height and width were determined by the number of pixels spanning the pore parallel and perpendicular to the compression direction, respectively. The orientation and aspect ratio of individual pores were also determined from the covariance matrix of an ellipse fitted to each pore.
III. RESULTS
A. Mechanical response
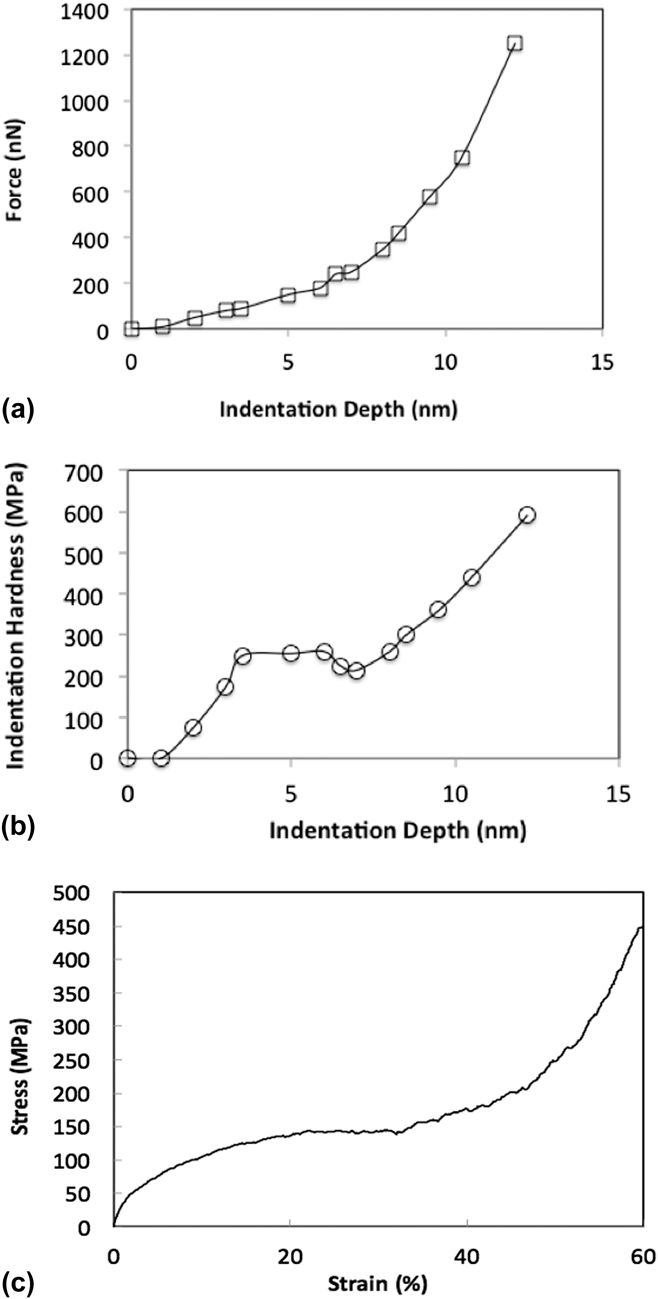
Figure 2(a) shows the total indenter force as a function of indenter displacement during our simulation. Young’s modulus E of the model is extracted by comparing the low-displacement part of this curve to the elastic Hertzian solution
 $$F = {{4 / {3Er}}^{1{\rm{/}}2}}{d^{3{\rm{/}}2}}\quad .$$
Here, F is the indenter force, E is the elastic modulus, r is the indenter radius (30 nm), and d is the indentation depth. This comparison indicates E ≈ 2.2 GPa, in agreement with the 2–8 GPA modulus range reported by Hodge et al. for foams of comparable relative density.Reference Hodge, Hayes, Caro, Biener and Hamza8,Reference Hodge, Biener, Hayes, Bythrow, Volkert and Hamza14
(a) Force versus indentation depth. (b) Hardness versus indentation depth. (c) Stress–strain curve from an atomistic simulation of uniaxial compression of the same np-Au model as the one investigated here.

Hardness—calculated by dividing the indenter force by the area of indentation—is plotted as a function of indentation depth in Fig. 2(b). For comparison, we also show in Fig. 2(c) a stress–strain curve obtained from an atomistic simulation of uniaxial compression of np-Au, described in Ref. Reference Ruestes, Farkas, Caro and Bringa11. The foams in the compression tests were generated in the same way and with the same ligament diameters as the foams used in the present indentation study. Both the hardness–depth and stress–strain curves exhibit qualitatively similar mechanical response, with an initial elastic region followed by a perfect-plastic plateau and finally hardening due to densification. The ability to capture qualitative features of uniaxial compression is an advantage of spherical indentation.Reference Field and Swain51,Reference Herbert, Pharr, Oliver, Lucas and Hay52 Our indentation results show a small valley before the hardening regime, which could be the result of the heterogeneity of the porous structure.
The value obtained for the elastic modulus from the compression tests is around 3.7 GPA, i.e., of the same order of magnitude as the value obtained from the indentation curve. This value is also of the same order of magnitude, but somewhat lower than expected from the Gibson–AshbyReference Hodge, Biener, Hayes, Bythrow, Volkert and Hamza14,Reference Gibson and Ashby23,Reference Gibson and Ashby24 scaling for the elastic modulus
 $${E \over {{E_{\rm{l}}}}} = \rho _{{\rm{rel}}}^2\quad ,$$
where E l is the elastic modulus of the ligaments. This scaling equation gives an elastic modulus of around 8 GPa. This value is similar to what has been reported in previous work for foams with ∼0.3 relative density, consistent with the fact that values obtained for the elastic modulus are generally lower, but of the same order of magnitude as predicted by the Gibson–Ashby scaling.Reference Hodge, Biener, Hayes, Bythrow, Volkert and Hamza14
The values of the plateau observed in the indentation hardness (about 300 MPa) are also of the same order of magnitude as those obtained in the compression tests (150 MPa). In the region where the material densifies, the indentation tests reach about 600 MPa, again of the same order of magnitude as the 450 MPa reached in the compression tests. As observed in previous investigations, these values are not in agreement with the Gibson–Ashby scaling for the yield stress if the values of the yield stress of bulk Au are used. This scaling predicts that
 $$\sigma = 0.3{\sigma _{{\rm{bulk}}}}{\varphi ^{3{\rm{/}}2}}\quad .$$
The values obtained in both experiments and simulations are significantly lower than this prediction based on bulk Au properties.Reference Hodge, Biener, Hayes, Bythrow, Volkert and Hamza14,Reference Farkas45 This has been interpreted as a consequence of the ligaments of nanometer-range diameters being much stronger than bulk Au. Agreement with Gibson–Ashby scaling is recovered in both our indentation tests and the compression tests if the strength of the ligaments is assumed to be in the range of several GPa.
As the indentation proceeds, we observed that the hardness values in the densification region approach values that are typical of the yield stress of bulk Au. This is also true in the densification region observed in the compression tests. We also found that the densified layer presents a high dislocation density that is the result of the densification process. This is analyzed in detail in Sec. III.B.
B. Morphological evolution
As indentation proceeds, the morphology of the np-Au material under the indenter changes.
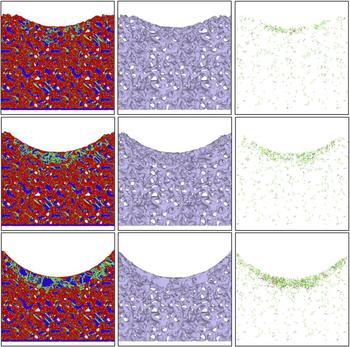
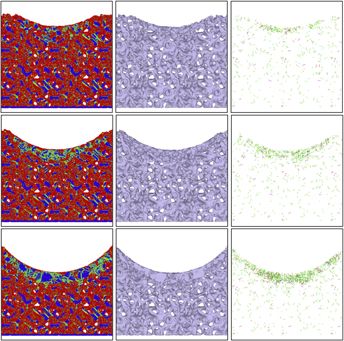
Figure 3 illustrates this morphological evolution using 2-nm-thick cross-sections of the model extracted from the region under the indenter at three different indentation depths. The cross-sections are analyzed using the central symmetry parameter to find crystal defects, free-surface identification to visualize ligament morphology, and DXA to quantify dislocation content.
Morphologies of the indented sample for indentation depths of 6.5, 10.5, and 14.5 nm. Left column: visualization according to the centrosymmetry parameter; center column: surface reconstruction; right column: dislocation density obtained using DXA.

Figure 3 demonstrates the formation of a densified region under the indenter. The densification is due to pore collapse in the immediate vicinity of the indenter while relative density in the material further from the indenter surface is not altered significantly. This finding is in agreement with experimental indentation results, which also report deformation confined to the material near the contact area.Reference Hodge, Biener, Hayes, Bythrow, Volkert and Hamza14 Also consistent with experiments, our simulation shows no pile-up or sink-in on the free surface adjacent to the indenter. Moreover, we observe an elevated density of dislocations in the densified region. Dislocations accumulated under the indenter have also been observed experimentally by Jin and coworkers.Reference Jin, Kramer, Ivanisenko and Weissmuller15,Reference Jin, Kurmanaeva, Schmauch, Rosner, Ivanisenko and Weissmuller53
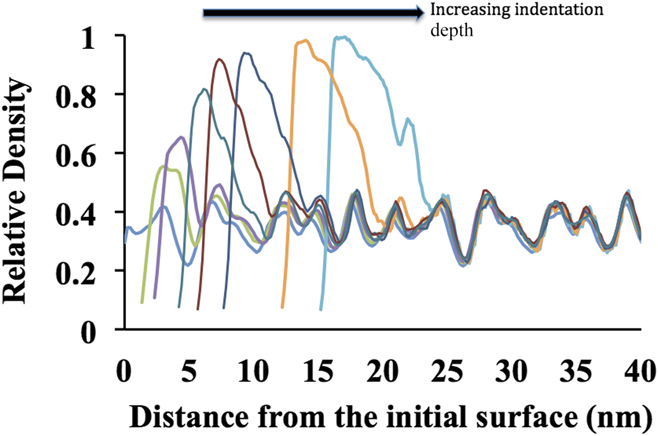
Figure 4 shows the evolution of the density depth profile under the indenter for several indentation depths, computed along the indentation direction. Both the density and the thickness of the densified layer increase as indentation proceeds. Moreover, the density profile beneath the densified layer remains nearly unaltered, as expected based on inspection of the microstructures in Fig. 3.
Density of the foam as a function of distance from the surface just under the indenter for various indentation depths. The fluctuations in the density are the result of the porous structure of the sample. The curves clearly show densification as the indentation depth increases.

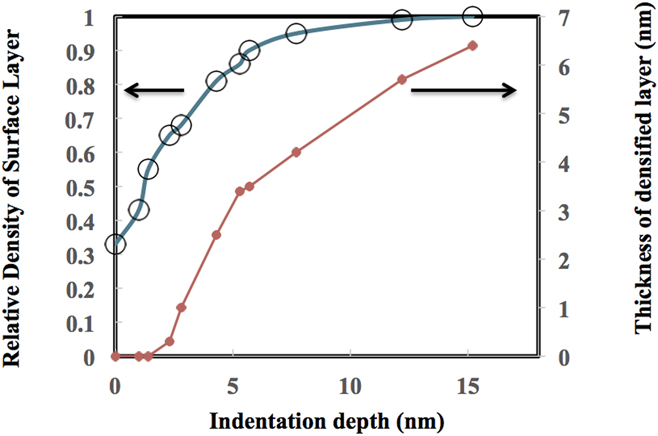
Figure 5 plots the thickness and density of the densified layer as functions of indentation depth.
Evolution of the densified layer as a function of indentation depth. As the indentation depth is increased, the density of the layer under the indenter increases to almost full density. During this process, the thickness of the densified layer increases to about one half of the indentation depth.

The density of the densified layer was obtained from the peak densities in Fig. 4. The thickness of the densified layer was determined as the distance between the surface and the point below the indenter where the difference between the local density and the as-constructed sample density falls to half the value found at the peak density point. A comparison of Figs. 5 to 2 reveals that the onset of hardening behavior coincides with a rise in relative density above ∼0.9 in the densified layer, indicating that the material in the layer is approaching full density. Moreover, as illustrated in Fig. 3, dislocations are accumulated in the densified layer as indentation proceeds. Thus, the mechanism of hardening in the layer is not dislocation starvation, as proposed in nanowires and nanopillars.Reference Nix54 Rather, it is due to interaction and lock formation among forest dislocations, similar to fully dense crystals.Reference Kocks and Mecking55
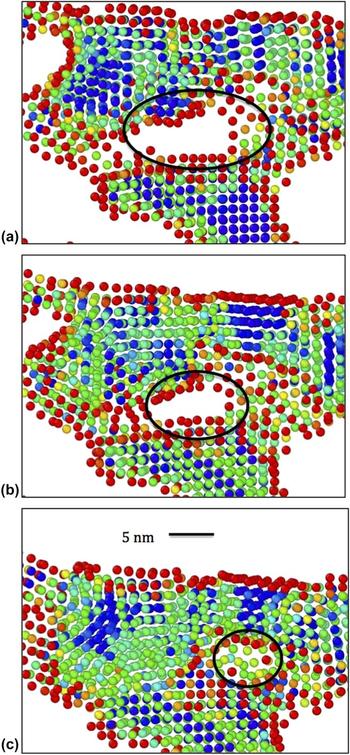
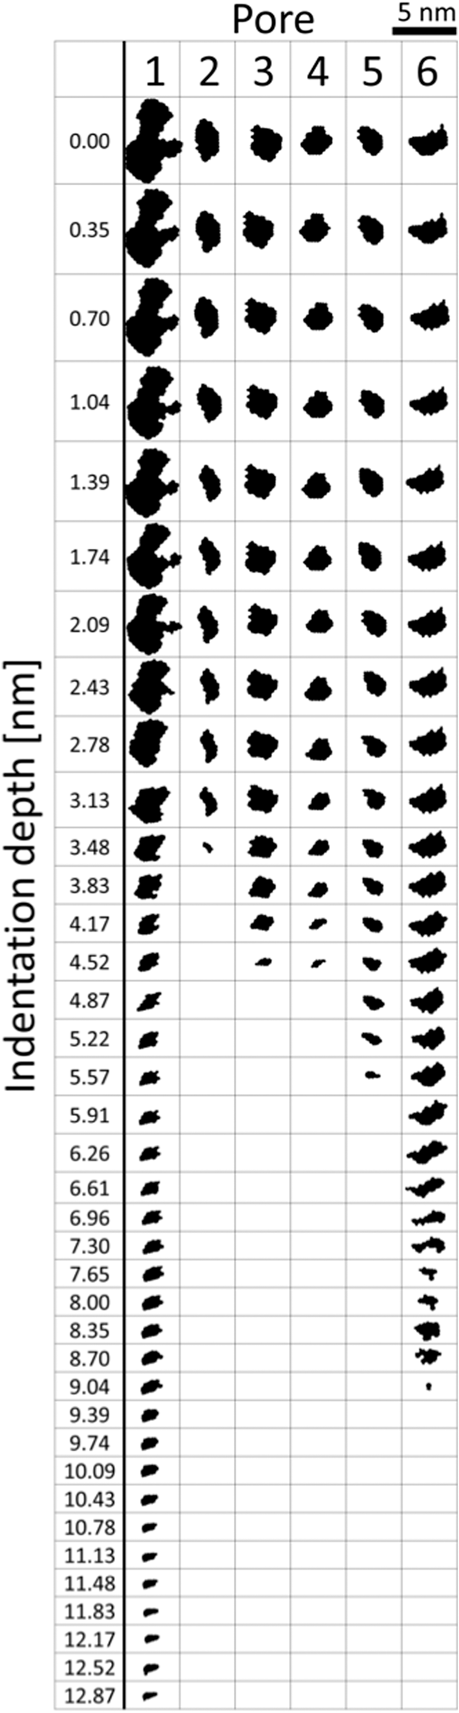
Densification under the indenter proceeds via the deformation-induced collapse of adjacent ligaments onto each other, leading to the removal of the intervening pores, as shown in Fig. 6. Such a pore collapse process has also been observed in previous simulations of uniform straining in np-Au.Reference Ruestes, Farkas, Caro and Bringa11,Reference Kolluri and Demkowicz35 To gain further insight into the mechanisms governing it, we investigated the change in shape of individual pores at successive stages of indentation by analyzing model cross-sections using AQUAMI.Reference Stuckner, Frei, McCue, Demkowicz and Murayama49 Figure 7 shows several examples of pore shape histories thereby obtained. All the pores in this figure shrink continuously during indentation and are completely removed prior to the onset of hardening behavior.
Example of the evolution of a pore located just under the indenter as the indentation proceeds. Atoms are colored according to the centrosymmetry parameter. The frames (a) through (c) correspond to indentation depths of 1, 3, and 5 nm, respectively.

Evolution of the size and shape of several characteristic pores as indentation proceeds. All pores are oriented such that the indentation direction is downwards.

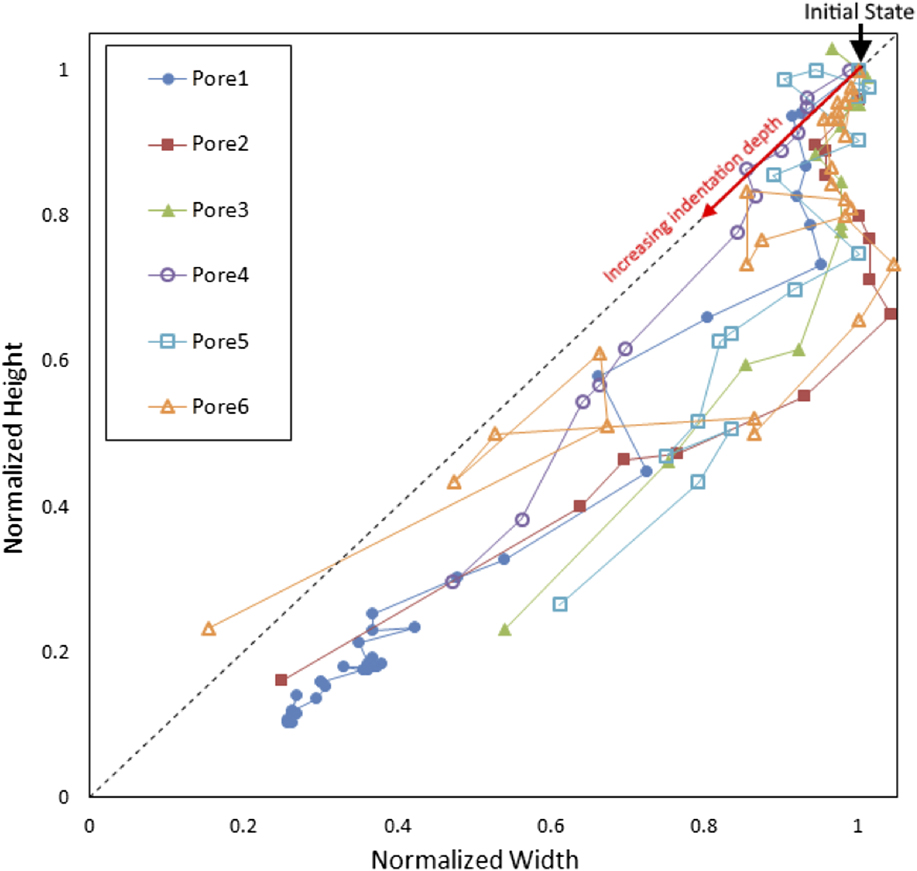
We performed quantitative analysis of several aspects of pore geometry evolution, including changes of pore cross-section area, pore orientation, and pore dimensions. This investigation led us to uncover a transition in the way pore shape changes during indentation. Figure 8 plots the height of each pore shown in Fig. 7 as a function of its width. To ease comparison of pores of differing initial size, both quantities are normalized by their initial values prior to indentation. The figure shows that the initial stages of pore collapse are characterized by a reduction of pore height while pore width remains nearly unchanged, indicating that the pores shrink uniaxially. By contrast, in the later stages of deformation, both the height and the width of the pores decrease at comparable rates, consistent with equitriaxial pore collapse. Voids in single crystals undergoing uniaxial compression are expected to collapse triaxiallyReference Carroll and Holt56 while the collapse of pores in low relative density np-Au is approximately uniaxial.Reference Kolluri and Demkowicz35
Evolution of pore aspect ratio as indentation proceeds.

IV. DISCUSSION AND CONCLUSIONS
We have investigated the response of np-Au to spherical indentation using atomistic modeling. Our simulations indicate a ductile, plastic behavior of nanoporous Au under compressive stress. Our results also show clear localized densification in the region under the indenter. We find that the densified region starts to form at indentation depths of about 10 nm for our model, representing an indentation depth of about five times the ligament diameter of the foam. The thickness of this densified region increases with indentation depth, and in our simulations, it is equal to about half the indentation depth. The indentation simulations show no strong long-range effects in the region below the densified layer. This suggests that the effects of the indentation are mostly collapse of the pores immediately below the indenter with no long stress fields. No crack formation was observed nor were any other phenomena that may suggest brittle behavior under compression, evidencing the intrinsic ductile behavior of nanoporous Au under compression. Our observations are in general agreement with experimental results.Reference Hakamada and Mabuchi13,Reference Biener, Hodge, Hayes, Volkert, Zepeda-Ruiz, Hamza and Abraham38
Our work yields hardness–indentation curves exhibiting qualitatively similar features to those observed during uniaxial compression.Reference Ruestes, Farkas, Caro and Bringa11,Reference Rodriguez-Nieva, Ruestes, Tang and Bringa32 For both types of simulations, the observed Young’s modulus is of the same magnitude as the value predicted by scaling laws, and the experimentally determined values.Reference Biener, Hodge, Hamza, Hsiung and Satcher1 The hardness values that were observed in the present work are also in agreement with previous studies, suggesting that the yield strength of the individual ligaments in nanoporous Au approaches the intrinsic yield strength of Au. The onset of hardening is correlated with the emergence of a densified layer under the indenter with relative density approaching unity. This layer forms by the collapse of pores within the indented volume, first by uniaxial compression and later by triaxial shrinking.
Rodriguez-Nieva proposes that the qualitative features of mechanical response in porous materials may be distinguished based on relative density.Reference Rodriguez-Nieva, Ruestes, Tang and Bringa32 They state that “low density” materials, such as np-Au, behave like networks of nanowires. In their view, the deformation of such solids ultimately proceeds by similar mechanisms to those observed in isolated nanowires, including elastic straining to high limit stresses due to dislocation starvation,Reference Rodriguez-Nieva, Ruestes, Tang and Bringa32 deformation by shearing along individual slip planes, and lack of hardening. By contrast, they expect materials with relative density above ∼0.9 to behave like a composite of a fully dense matrix and individual voids. Since the spacing between the voids is small by comparison to their radii, the plastically deforming regions surrounding them are expected to overlap and interact, giving rise to hardening via the usual mechanisms of crystal plasticity.Reference Kocks and Mecking55
Our observations are broadly in accordance with the view of Rodriguez-Nieva et al.Reference Rodriguez-Nieva, Ruestes, Tang and Bringa32 We see no hardening in the initial indentation response of np-Au with an initial relative density of 0.67. However, once the relative density in a layer of material below the indenter exceeds ∼0.9, hardening is observed. The densified layer contains numerous dislocations, consistent with forest hardening. Moreover, we see that the mechanism of pore collapse changes from uniaxial to triaxial with continued densification. Triaxial collapse is consistent with the behavior of voids embedded in otherwise fully dense crystals under uniaxial external loading.Reference Carroll and Holt56 This triaxial shrinkage is due to the emission of dislocations on multiple slip planes intersecting the void.Reference Davila, Erhart, Bringa, Meyers, Lubarda, Schneider, Becker and Kumar57–Reference Bulatov, Wolfer and Kumar59 The multiplicity of active slip planes is thought to be one of the factors contributing to hardening during collapse of isolated voids.Reference Ruestes, Farkas, Caro and Bringa11,Reference Davila, Erhart, Bringa, Meyers, Lubarda, Schneider, Becker and Kumar57,Reference Tang, Bringa, Remington and Meyers58
A quantitative analysis of the connectivity of the void space within the nanoporous structure is beyond the scope of the current work. Nevertheless, we do expect that a change in the connectivity of void space accompanies the densification of the material under the indenter. As a first approximation, the threshold density at which this transition occurs may be estimated using percolation theory. The precise density at which percolation occurs depends on the details of the percolation model. In 3D, many models exhibit percolation thresholds at 10–20% density of the percolating entity.Reference Torquato60 Thus, we estimate that when the relative density of our nanoporous structure rises above 80–90% (i.e., when the void fraction drops below 10–20%), the interconnected void space breaks up into isolated, nonpercolating pores.
The foregoing discussion suggests that the onset of hardening in np-Au under compression is related to the commencement of forest hardening. To test this conclusion, it would be interesting to investigate the compression response of nanoporous solids composed of amorphous materials. Unlike crystalline solids, amorphous materials do not harden upon plastic deformation. Rather, they undergo shear banding.Reference Schuh, Hufnagel and Ramamurty61,Reference Maaß and Löffler62 Therefore, we expect that a nanoporous amorphous metal would also exhibit a propensity toward flow location as well as no hardening, even when its relative density exceeds ∼0.9.
ACKNOWLEDGMENT
This work was funded by the National Science Foundation, Division of Materials Research, DMREF program Grant No. 1533969.