1. Introduction: from far-field light microscopy to nanoscopy
Biophysical studies strongly rely on microscopy, since it can directly deliver images of the distributions of specific molecules in the living cell. Among all the different microscopes, optical fluorescence microscopes have been established as key instruments in the life sciences. This stems from the fact that the use of light allows least-invasive access to the interior of living cells and organisms and, when combined with fluorescence readout, offers the specific and highly sensitive detection of cellular constituents. To keep these advantages, optical microscopy of the living cell is usually applied in the far-field: a lens-based system allows the excitation and detection of fluorescent molecules micrometers to millimeters away from any optical element, preserving the non-invasiveness and the ability to image deep inside living cells or tissue. However, the concomitant focusing of light introduces the most prominent limit of this technique: due to the diffraction of light, details far below the wavelength of light λ, i.e. in the range of below 200–300 nm, cannot be directly resolved in an image and remain hidden to the observer (Abbe, Reference Abbe1873). This diffraction barrier has major implications for biophysical studies of the cell, since a complete understanding of cellular structure and function requires observations at the molecular level, i.e. with molecular-scale resolution. Until not very long ago, obtaining a spatial resolution on the nanometer scale with a far-field fluorescence microscope was considered impossible (Alberts et al. Reference Alberts, Johnson, Lewis, Raff, Roberts and Walter2002).
Several ideas had been put forward to improve the resolution, including special illumination patterns and mathematical approaches (Bertero et al. Reference Bertero, Boccacci, Brakenhoff, Malfanti and Van Der Voort1990; Toraldo di Francia, Reference Toraldo Di Francia1952). One of them is structured illumination microscopy (SIM) (Ash & Nicholls, Reference Ash and Nicholls1972; Bailey et al. Reference Bailey, Farkas, Taylor and Lanni1993; Frohn et al. Reference Frohn, Knapp and Stemmer2000; Gustafsson, Reference Gustafsson2000; Gustafsson et al. Reference Gustafsson, Shao, Carlton, Wang, Golubovskaya, Cande, Agard and Sedat2008; Lukosz, Reference Lukosz1966; Schermelleh et al. Reference Schermelleh, Carlton, Haase, Shao, Winoto, Kner, Burke, Cardoso, Agard, Gustafsson, Leonhardt and Sedat2008). SIM allows (three-dimensional (3D) live-cell) imaging with a two-fold increase in spatial resolution over the conventional diffraction limit, i.e. ~100 nm. Similarly, 4-Pi or I5M microscopy significantly improve the axial resolution of far-field microscopy (Gustafsson et al. Reference Gustafsson, Agard and Sedat1995, Reference Gustafsson, Agard, Sedat, Cogswell, Kino and Wilson1996, Reference Gustafsson, Agard and Sedat1999; Hell, Reference Hell1992; Hell et al. Reference Hell, Lindek, Cremer and Stelzer1994; Hell & Stelzer, Reference Hell and Stelzer1992). Unfortunately, these techniques are rather complex with respect to both instrumentation and image processing, and they do not break the diffraction barrier, because they are still limited by diffraction; they only push diffraction to its very limits.
It was not until the early 1990s that viable concepts emerged to truly break the physical barrier given by diffraction. It was realized that this could be achieved using basic molecular transitions (Hell, Reference Hell1994; Hell & Kroug, Reference Hell and Kroug1995; Hell & Wichmann, Reference Hell and Wichmann1994). By exploiting a transition between states of different emission properties of the fluorescent molecules, such as between a dark and a bright state, it would become possible to control the fluorescence emission in such a way that adjacent molecules emit sequentially in time (Hell, Reference Hell2004; Hell et al. Reference Hell, Jakobs and Kastrup2003). This has led to far-field imaging of fluorescently tagged objects with unprecedented spatial resolving power and heralded the move from microscopy to ‘super-resolution’ microscopy or ‘nanoscopy’. For further reviews see, for example, (Bates et al. Reference Bates, Huang and Zhuang2008; Chi, Reference Chi2009; Clausen et al. Reference Clausen, Galiani, Bernardino De La Serna, Fritzsche, Chojnacki, Gehmlich, Lagerholm and Eggeling2013; Dedecker et al. Reference Dedecker, Hofkens and Hotta2008; Dempsey et al. Reference Dempsey, Vaughan, Chen, Bates and Zhuang2011; Eggeling et al. Reference Eggeling, Willig and Barrantes2013; Evanko, Reference Evanko2009; Fernandez-Suarez & Ting, Reference Fernandez-Suarez and Ting2008; Heilemann et al. Reference Heilemann, Dedecker, Hofkens and Sauer2009a; Heintzmann & Ficz, Reference Heintzmann and Ficz2007; Heintzmann & Gustafsson, Reference Heintzmann and Gustafsson2009; Hell, Reference Hell2003, Reference Hell2007, Reference Hell, Gräslund, Rigler and Widengren2009a, Reference Hellb; Hell et al. Reference Hell, Dyba and Jakobs2004; Huang, Reference Huang2010; Huang et al. Reference Huang, Bates and Zhuang2009, Reference Huang, Babcock and Zhuang2010; Lippincott-Schwartz & Manley, Reference Lippincott-Schwartz and Manley2009; Moerner, Reference Moerner2006; Muller et al. Reference Muller, Schumann and Kraegeloh2012; Patterson et al. Reference Patterson, Davidson, Manley and Lippincott-Schwartz2010; Rice, Reference Rice2007; Tinnefeld et al. Reference Tinnefeld, Eggeling and Hell2015). Two major concepts have evolved so far: (1) the coordinate-targeted approach, as realized in a stimulated emission depletion (STED) (Hell & Wichmann, Reference Hell and Wichmann1994), ground state depletion (GSD) (Hell & Kroug, Reference Hell and Kroug1995) or reversible saturable/switchable optical linear (fluorescence) transition (RESOLFT) (Hell, Reference Hell2003, Reference Hell2004; Hell et al. Reference Hell, Jakobs and Kastrup2003) nanoscope, reversibly inhibits the occupation of a molecular state (such as the bright, emissive state) everywhere but at specific points in space such that a detected signal (such as the spontaneous fluorescence) is only allowed in coordinate regions of sub-diffraction size. Scanning of these points realizes a super-resolved image. (2) The coordinate-stochastic approach such as realized in fluorescence photoactivated localization microcopy ((F)PALM) (Betzig et al. Reference Betzig, Patterson, Sougrat, Lindwasser, Olenych, Bonifacino, Davidson, Lippincott-Schwartz and Hess2006; Hess et al. Reference Hess, Girirajan and Mason2006) or stochastic optical reconstruction microscopy (STORM) (Rust et al. Reference Rust, Bates and Zhuang2006) inhibits the population of a molecular state (the bright, emissive state) everywhere but from single molecules per region of diffraction (i.e. the spatial extent in which the diffraction limit applies), whose spatial position can then be determined with sub-diffraction precision. Subsequent stochastic state transitions of all (individual) molecules and the determination of their positions allow the reconstruction of a super-resolved image.
In this review we will describe the fundamentals of far-field microscopy and its diffraction barrier, outline the details of breaking this barrier using different fluorophore transitions and detail the basics and different modalities of the current far-field nanoscopes. We will however not review every work in this field. By outlining the basic concepts of the various super-resolution microscopy or nanoscopy approaches, we rather aim at presenting the prospects and any current limitations of these nanoscopes for their use in biophysical and biomedical studies.
1.1 The diffraction limit
Far-field fluorescence microscopy (or far-field optical light microscopy in general) employs focused light. A lens system (the objective lens) is used to excite and collect fluorescence in the sample and to image it onto a photon detector. This is usually realized in a wide-field mode, where a large area is excited at once and imaged onto a camera, or in a point-scanning approach (e.g. the confocal microscope), where only a small spot (volume) is excited, its fluorescence detected by a point detector, and the final image formed by scanning the spot over the sample (Fig. 1a, b). The lens causes the focused propagating light to interfere constructively at a certain point in space, called the focal point. Diffraction, however, results in a light intensity pattern which features a central maximum and a width whose full-width-at-half-maximum (FWHM) is d ≈ λ/(2n sin α) along the lateral and Δz ≈ λ/(n sin2α) along the optic axis, governed by the wavelength λ of the light and the focusing strength of the lens (given by its semi-aperture angle α and the refractive index n of the object medium, NA = n sinα is referred to as the numerical aperture of the objective lens) (Born & Wolf, Reference Born and Wolf2002). This finite-width point-spread-function (PSF) of the lens rules both the fluorescence excitation and collection process, and for both the wide-field and single-point scanning variant precludes the discerning of simultaneously emitting molecules which lie within this PSF. For visible light (λ ≈ 500 nm) structural details below approximately 200 nm thus appear blurred and indiscernible in the final image (Box in Fig. 1).
Diffraction-limited far-field fluorescence microscopy. An object is illuminated with excitation light (blue) and its fluorescence (green) imaged onto a detector using a lens system, whereby the object is placed >μm away from any optics. (a) In a wide-field microscope a large area of the object is illuminated at once and signal imaged onto a camera. (b) In a point-scanning confocal microscope a diffraction-limited volume is illuminated, signal detected on a point-detector through a pinhole, and the final image formed by scanning the spot over the object. The size of the focused and observed spot is governed by the focusing strength of the objective lens (given by the angle α), the wavelength λ of the applied light, and the refractive index n of the object medium. Box: Due to the focusing of light one cannot image point-like objects to dimensions smaller than approximately 200 nm in the lateral (x,y) and 600 nm in the axial (z) directions for visible light. This finite-sized, diffraction-limited point spread function (PSF) precludes the discerning of alike objects closer together than these 200 nm and results in blurred images at these spatial scales. Different versions of far-field microscopy have been implemented with the goal to push the diffraction barrier to its limits. (c) A two-fold increase in spatial resolution has been realized by SIM using, for example, a standing wave pattern in a wide-field mode with the pattern maxima separated by more than the 200 nm. (d) Using two opposing objective lenses for illumination and/or detection, the axial resolution of a wide-field or point-scanning/confocal microscope can be enhanced multi-fold, denoted I5M or 4Pi, respectively. (Here, red: excitation, and green: fluorescence)

Several strategies have been thought of to push this resolution barrier. A straightforward way is to reduce the wavelength λ of the light. Ultraviolet (UV) light is however known to introduce photostress on the sample, stronger photobleaching of the fluorescent molecules under study, significant autofluorescence (especially in the cellular environment), and a demand for UV-specific optics, thus making it rather impractical for live-cell studies. An increase of the numerical aperture is ultimately limited by the technical feasibilities of manufacturing objective lenses, currently delivering maximum NA in the range of 1·4–1·5.
A logical consequence of the limits brought about by using focused light was to give up the use of the far-field objective lenses and confine the light by means of a sub-diffraction-sized aperture or tip (Ash & Nicholls, Reference Ash and Nicholls1972; Synge, Reference Synge1928). The light evolves out of the tip as an evanescent field, meaning that it fades out exponentially within a distance of ~λ/2. Keeping the tip within a distance of ≅<<λ/2 (i.e. a few nm) and scanning it across the sample allows the recording of images with a spatial resolution far better than the diffraction limit, given approximately by the size of the tip itself (Lewis et al. Reference Lewis, Isaacson, Harootunian and Murray1984; Pohl et al. Reference Pohl, Denk and Lanz1984). Such near-field scanning optical microscopy (NSOM) has been applied in many areas (Novotny & Hecht, Reference Novotny and Hecht2006), including biological imaging (Betzig et al. Reference Betzig, Chichester, Lanni and Taylor1993; Kirsch et al. Reference Kirsch, Meyer, Jovin, Kohen and Hirschberg1996). For example, with spatial resolutions of down to 80 nm, NSOM has given insights into the nanoscale organization of proteins on the plasma membrane of (living) cells (de Bakker et al. Reference De Bakker, De Lange, Cambi, Korterik, Van Dijk, Van Hulst, Figdor and Garcia-Parajo2007; van Zanten et al. Reference Van Zanten, Gomez, Manzo, Cambi, Bucet, Reigad and Garcia-Parajo2010). Unfortunately, the requirement of keeping the tip very close to the sample comes at a high cost: on one hand, an elaborate feedback mechanism has to be applied to keep the sample-tip distance constant (especially for dynamic living cells) (Koopman et al. Reference Koopman, Cambi, De Bakker, Josten, Figdor, Van Hulst and Garcia-Parajo2004). On the other hand, one is bound to imaging surfaces, and this precludes the use of NSOM to explore the (3D) nanoscopic interior of the living cell. With this drawback, the applicability of NSOM will remain limited, which may be a reason why most biophyiscal observations keep on relying on far-field optics.
Total-internal-reflection fluorescence (TIRF) microscopy relies on evanescent fields as well. Here the evanescent field is created at the microscope's cover glass–sample interface by illuminating with (laser) light that is totally internally reflected at the glass–water interface (Axelrod, Reference Axelrod1981). With a finite penetration depth of the evanescent excitation field of typically <100 nm, TIRF microscopy only detects the fluorescence emitted from near the cover glass–sample interface. Consequently, TIRF microscopy is not a far-field optical technique, but virtually a two-dimensional (2D) microscopy technique that is not really applicable to explore the interior of a cell. Nevertheless, TIRF efficiently suppresses the background from out-of-focus structures, and it is therefore well suited to explore the cellular boundaries, such as the plasma membrane and ligand–receptor interactions (see, e.g. Lieto et al. Reference Lieto, Cush and Thompson2003).
Starting in 2000, the idea was put forward to use negative refractive index metamaterials (Pendry, Reference Pendry2000) for imaging with sub-diffraction resolution in the far-field. Introduced as a hyperlens (Liu et al. Reference Liu, Lee, Xiong, Sun and Zhang2007; Smolyaninov et al. Reference Smolyaninov, Hung and Davis2007), evanescent waves were converted into propagating waves forming a magnified image of the sample on a distant screen. Considered as a far-field image projection, the use of negative refractive index metamaterials (the hyperlens) also relies on collecting an evanescent wave, i.e. it requires the placing of the sample into very close proximity to the hyperlens – more specifically into its near-field. Hence, although it introduces a very interesting approach of employing evanescent waves, the hyperlens in its current state cannot be regarded as a far-field imaging device capable of observing inner-cellular structures (Podolskiy & Narimanov, Reference Podolskiy and Narimanov2005).
1.2 Pushing the limits of the diffraction barrier
It is due to the above limits of other techniques why most biophysical and biomedical applications still relied on the use of far-field optics, and several ideas have been put forth to address the resolution problem. These ideas included the use of special illumination patterns, like first suggested in 1952 by Toraldo di Francia (Reference Toraldo Di Francia1952) or later on followed by Cremer and Cremer (Reference Cremer and Cremer1978). The use of these concepts was rendered impractical by either strong side lobes of the focused light (Toraldo di Francia, Reference Toraldo Di Francia1952), or the fact that it is impossible to achieve light convergence to a sub-diffraction focal spot (in the absence of relayed near-field components) (Cremer & Cremer, Reference Cremer and Cremer1978). Purely mathematical processing of the imaging data has also been suggested several times to overcome the diffraction barrier (Bertero & Boccacci, Reference Bertero and Boccacci1998; Bertero et al. Reference Bertero, Boccacci, Brakenhoff, Malfanti and Van Der Voort1990; Conchello & McNally, Reference Conchello and Mcnally1996). Such computational methods usually required a priori knowledge of parameters of the imaging system (e.g. the PSF) and/or of the imaged object. Due to a potential lack of accurate a priori information, these approaches were however prone to artifacts and rarely exceeded a two-fold increase in spatial resolution. These limitations might be partially mitigated through additional a priori constraints such as the objects featuring different absorption or emission spectra (Burns et al. Reference Burns, Callis, Christian and Davidson1985), but marking all features in the sample with different labels – and hence achieving a general imaging strategy for the sub-diffraction interrogation of arbitrary structures – becomes itself difficult, if not impossible.
In a spot-scanning confocal microscope the sample is illuminated with a diffraction-limited focused spot and the fluorescence emission confocally detected with a symmetrically arranged point detector, which is usually realized by inserting a detection pinhole (Fig. 1b). The confocal detection does, however, not really provide a higher resolution. Theoretically, the width of the effective focal spot or PSF is reduced by a factor of  $\sqrt 2 $ (Minsky, Reference Minsky1961; Pawley, Reference Pawley2006; Wilson & Sheppard, Reference Wilson and Sheppard1984). This improved spatial information is however usually heavily damped and thus lost in noise. The biggest benefit of detecting through a pinhole is a superb background rejection, which significantly improves 3D-imaging and which is the reason why the confocal laser scanning microscope can be considered as the workhorse of fluorescence 3D-microscopy (Pawley, Reference Pawley2006; Wilson & Sheppard, Reference Wilson and Sheppard1984).
Another approach that has often been connected with resolution improvement is the use of two-photon excitation. Here, the simultaneous absorption of two photons results in excitation of the fluorophore. The wavelength of the excitation light is thereby usually chosen to be double the wavelength λ that would be used for conventional one-photon excitation (Bloembergen, Reference Bloembergen1965; Denk et al. Reference Denk, Strickler and Webb1990; Sheppard & Kompfner, Reference Sheppard and Kompfner1978). The resulting non-linear squared dependence of the fluorescence emission on the excitation intensity establishes a clear reduction of the width of the effective focal spot or PSF by a factor of  $\sqrt 2 $. Unfortunately, doubling the wavelength (2λ) comes with a doubling of the size of the diffraction spot (Denk et al. Reference Denk, Strickler and Webb1990), i.e. in total the spatial resolution of a two-photon microscope is usually slightly poorer than its one-photon counterpart (Schönle et al. Reference Schönle, Hanninen and Hell1999). The same arguments are valid for m-photon absorption processes, because they usually require an even longer wavelength mλ. The advantage of a multi-photon microscope lies in other factors such as a deep penetration depth, low scattering and the restriction of photobleaching to the focal spot.
Several approaches have suggested the use of structured illumination for increasing the spatial resolution of a far-field fluorescence microscope (e.g. Ash & Nicholls, Reference Ash and Nicholls1972; Bailey et al. Reference Bailey, Farkas, Taylor and Lanni1993; Lukosz, Reference Lukosz1966). Structured Illumination Microscopy (SIM) by a standing wave pattern (Fig. 1c) is nowadays a well-established microscopy technique allowing the far-field imaging of living cells with a two-fold improvement in the lateral and axial resolution (Frohn et al. Reference Frohn, Knapp and Stemmer2000; Gustafsson, Reference Gustafsson2000; Gustafsson et al. Reference Gustafsson, Shao, Carlton, Wang, Golubovskaya, Cande, Agard and Sedat2008; Schermelleh et al. Reference Schermelleh, Carlton, Haase, Shao, Winoto, Kner, Burke, Cardoso, Agard, Gustafsson, Leonhardt and Sedat2008). Similarly, SIM has also been realized based on a software-based confocal CCD detection approach using scanning single- (Muller & Enderlein, Reference Muller and Enderlein2010) or multi-spot (York et al. Reference York, Parekh, Nogare, Fischer, Temprine, Mione, Chitnis, Combs and Shroff2012) illumination, or it has been combined with TIRF (Fiolka et al. Reference Fiolka, Beck and Stemmer2008). The use of two opposing objectives in either a spot-scanning 4Pi (Hell, Reference Hell1992; Hell & Stelzer, Reference Hell and Stelzer1992; Hell et al. Reference Hell, Lindek, Cremer and Stelzer1994) or a widefield I5M (Gustafsson et al. Reference Gustafsson, Agard and Sedat1995, Reference Gustafsson, Agard, Sedat, Cogswell, Kino and Wilson1996, Reference Gustafsson, Agard and Sedat1999) microscope realized an improvement of the axial resolution of a far-field microscope from 400–800 nm down to 70–150 nm (Fig. 1d). The latter approaches are often of special interest to microscope users since the axial resolution of any standard far-field light microscope is at least 3-times poorer than the lateral resolution in the focal plane. This particularly limits the 3D imaging of transparent objects such as cells. Both SIM and 4Pi microscopes are nowadays commercially available systems, and the enhanced resolution of both techniques has allowed the observation of live cellular structures with larger detail, giving a significantly improved insight into cellular functions (Bewersdorf et al. Reference Bewersdorf, Bennett and Knight2006; Egner & Hell, Reference Egner and Hell2005; Egner et al. Reference Egner, Jakobs and Hell2002, Reference Egner, Verrier, Goroshkov, Soling and Hell2004; Gugel et al. Reference Gugel, Bewersdorf, Jakobs, Engelhardt, Storz and Hell2004; Gustafsson et al. Reference Gustafsson, Shao, Carlton, Wang, Golubovskaya, Cande, Agard and Sedat2008; Schermelleh et al. Reference Schermelleh, Carlton, Haase, Shao, Winoto, Kner, Burke, Cardoso, Agard, Gustafsson, Leonhardt and Sedat2008; Weil et al. Reference Weil, Parton, Herpers, Soetaert, Xanthakis, Dobbie, Halstead, Hayashi, Rabouille and Davis2012). However, the spatial resolution of these microscopes is still limited, i.e. they do not break the diffraction barrier, but they rather push diffraction to its limits.
1.3 Breaking the diffraction barrier
While the rationales of all previously mentioned methods such as SIM or 4Pi/I5M, or NSOM, are based on modifying the propagation of light in one way or another, a real breakthrough for the surpassing of the diffraction barrier was the insight that the properties of the fluorophore itself can be used to attain in principle unlimited (actually molecular-size) spatial resolution in the far-field (Hell, Reference Hell1994; Hell & Kroug, Reference Hell and Kroug1995; Hell & Wichmann, Reference Hell and Wichmann1994). It was realized that one can take advantage of the transitions between different states (ground, excited and dark states) of the fluorescent label, i.e. its spectroscopic properties, to modify the fluorescence emission in such a way as to neutralize the limiting role of diffraction (Hell, Reference Hell1994). Until then, fluorophores were primarily regarded as indicators of molecular species or environmental conditions (such as pH, ion concentrations). That they should also hold the key to nanoscale resolution in a far-field microscope was thus a major change in the perception of the fluorophores’ role and capability in microscopy. The implementation of this idea started with STED (Hell & Wichmann, Reference Hell and Wichmann1994; Klar & Hell, Reference Klar and Hell1999; Klar et al. Reference Klar, Jakobs, Dyba, Egner and Hell2000), GSD (Bretschneider et al. Reference Bretschneider, Eggeling and Hell2007; Hell & Kroug, Reference Hell and Kroug1995) and RESOLFT (Hell, Reference Hell2004; Hell et al. Reference Hell, Jakobs and Kastrup2003; Hofmann et al. Reference Hofmann, Eggeling, Jakobs and Hell2005) microscopy, which thus emerged as the first concrete and viable physical concepts to overcome the limiting role of diffraction in a lens-based optical microscope. While these approaches reversibly inhibit the occupation of a molecular state (usually the emissive state) at defined spatial coordinates using deterministic scanning, subsequent developments such as (F)PALM (Betzig et al. Reference Betzig, Patterson, Sougrat, Lindwasser, Olenych, Bonifacino, Davidson, Lippincott-Schwartz and Hess2006; Hess et al. Reference Hess, Girirajan and Mason2006) or STORM (Rust et al. Reference Rust, Bates and Zhuang2006) transfer the fluorophores to their emissive state stochastically in space and utilize the spatial localization of single isolated molecules based on the emitted fluorescence pattern of the individual molecules, to assemble the final image. Still, the basic requirement remains the same: the preparation of at least two transient states of the fluorescent labels with discernible emission properties. The most prominent example is a pair of a bright (fluorescent) ON- and a dark (non-fluorescent) OFF-state, where at least one transition such as the ON-to-OFF transition is driven by light. The molecular states involved do not necessarily have to be dark and bright states. They can also differ in other fluorescence properties such as absorption cross-section, emission wavelength, fluorescence lifetime or another property, i.e. their detected signal has to be discernible. For simplicity, we keep to the notation of ON- and OFF-states and denote the light driving the OFF–ON and ON–OFF transition by ‘turn-on’ and ‘turn-off’ light.
The prospects of these super-resolution microscopes or nanoscopes to image the living cell with conceptually unlimited (presently ~10–50 nm) spatial resolution is revolutionizing modern microscopy and has a major impact on biophysical and biomedical research.
2. The coordinate-targeted approach
The initially developed coordinate-targeted approaches STED, GSD or RESOLFT utilize an illumination pattern. Specifically, an intensity distribution of either the turn-on or turn-off laser is created that features at least one intensity zero to transiently confine the occupation of usually the ON-state, i.e. the fluorescence emission, to sub-diffraction sized areas or volumes (Fig. 2). Increasing the intensity of this modified laser above a certain threshold basically then turns off the detected fluorescence emission (Fig. 2a). The restriction of the occupation of ON-states and thus (detected) fluorescence emission to sub-diffraction dimensions is ensured by (1) an overlay of the turn-off laser with the fluorescence excitation (or turn-on) laser, and (2) an intensity of the turn-off laser above the mentioned threshold.
Sub-diffraction imaging by the coordinate-targeted (deterministic) approach (STED/RESOLFT): driving molecular transitions in space. (a) Sub-diffraction imaging is based on reversibly inducing transitions between molecular states of different fluorescence emission properties (such as a bright ON- and a dark OFF-state), where at least one of the transitions such as the ON-to-OFF transition is driven by light (left). Increasing the intensity of the turn-off light above a certain threshold turns off the fluorescence emission (right). (b) In its single-spot scanning version the diffraction-limited spot of the fluorescence excitation or turn-on laser (green) is overlaid with an additional turn-off laser which features a central intensity zero (red). Increasing the intensity I of the turn-off laser far above a threshold value (I S) confines the volume in which fluorescence emission is allowed to sub-diffraction dimensions, i.e. it creates an observation spot with diameter d << 200 nm (orange). Insets: respective focal intensity distributions. Lower right: Diameter of the observation spot versus intensity of the turn-off laser (example data for STED). With the spatial coordinates known, scanning of this spot realizes imaging with sub-diffraction resolution, and thus the discerning of alike objects closer together than 200 nm (upper panel). (c) In a multi-spot realization, the added turn-off light features several intensity zeros, such as realized for a wide-field microscope by a standing-wave pattern or many doughnuts with the pattern maxima or doughnut minima separated by more than the 200 nm. Increasing I >> I S restricts fluorescence emission to multiple spots or lines of sub-diffraction dimension, and scanning of these spots or lines over the sample realizes images with sub-diffraction resolution.
A unique feature of this principle is that the size of the effective observation area/volume and thus the spatial resolution of the microscope is tuned by the intensity of the turn-off laser. More specifically, it has been shown that, for example, the lateral resolution as given by the diameter (or FWHM) of the observation area  $d \approx \lambda /(NA\sqrt {(1 + I/I_S )} )$ approximately scales with the inverse square-root of the intensity I of the turn-off laser (Harke et al. Reference Harke, Keller, Ullal, Westphal, Schoenle and Hell2008a; Hell, Reference Hell2004; Hell et al. Reference Hell, Jakobs and Kastrup2003). Here, I S is the above-mentioned threshold intensity (often denoted saturation intensity), which is a characteristic of the fluorophore (involving the light absorption cross-section of the ON–OFF transition and the lifetime of the involved states) and of the steepness of the edges of the intensity zeros. Driving the intensity I further and further up thus creates continuously smaller observation areas down to the size of a single molecule.
In usual practice, the wavefront of the turn-off laser is modified by the insertion of a phase plate or grating in such a way that the focusing creates one or multiple intensity zeros. In the case of the single-point scanning microscope usually a doughnut-like intensity distribution with a central intensity zero is preferred (Fig. 2b) (Keller, Reference Keller2006; Willig et al. Reference Willig, Keller, Bossi and Hell2006a). Scanning of the reduced-size observation spot then renders a direct image of the distribution of fluorescently marked molecules with nanoscale spatial resolution. However, as will be discussed later on, other intensity distributions have been realized as well, for example confining the fluorescence along the axial z-direction (Klar et al. Reference Klar, Jakobs, Dyba, Egner and Hell2000) or even along all spatial directions, creating an almost isotropic spot (Harke, Reference Harke2008; Harke et al. Reference Harke, Keller, Ullal, Westphal, Schoenle and Hell2008a, Reference Harke, Ullal, Keller and Hellb; Schmidt et al. Reference Schmidt, Wurm, Jakobs, Engelhardt, Egner and Hell2008). In the case of the wide-field microscope, usually a standing-wave-like pattern with multiple zero-intensity lines such as in SIM is created. The camera images recorded for multiple scanning positions of the zeros are then post-processed to reconstruct the final image (Gustafsson, Reference Gustafsson2005; Heintzmann et al. Reference Heintzmann, Jovin and Cremer2002; Rego et al. Reference Rego, Shao, Macklin, Winoto, Johansson, Kamps-Hughes, Davidson and Gustafsson2012; Schwentker et al. Reference Schwentker, Bock, Hofmann, Jakobs, Bewersdorf, Eggeling and Hell2007). As shown recently, a preferred mode is to scan multiple points or doughnuts instead of rotating entire lines (Chmyrov et al. Reference Chmyrov, Keller, Grotjohann, Ratz, D'Este, Jakobs, Eggeling and Hell2013). In any case, for I ≫ I S alike features closer together than the diffraction-limited 200 nm are now distinguishable, since they are switched on and thus detected separately in time. For the wide-field approach, this requires neighboring intensity zeros to be separated by more than the diffraction-limited 200 nm.
It is obvious that the increased image resolution comes along with a reduction of the scanning step size; the molecules that were ‘off’ initially have to be turned ‘on’ later, etc. Therefore, an accurate acquisition of nanoscale details requires an increased number of scanning steps and consequently longer acquisition times. Nevertheless, this coordinate-targeted approach offers all features of a conventional microscope from multicolor and 3D image acquisition over single-molecule detection to deep-tissue or in-vivo imaging. In the following, we will present these capabilities of coordinate-targeted scanning nanoscopy, starting with the so far most developed technique, STED nanoscopy.
2.1 STED nanoscopy
In STED nanoscopy, the pair of molecular states are the fluorophore's ground (dark OFF) state S 0 and the excited (fluorescent ON) state S 1, respectively. Being initially in the S 0 OFF-state, excitation to the S 1 ON-state and thus fluorescence emission is driven by the excitation laser, while switching back to S 0 is realized by stimulated emission using a second laser, the STED laser. The wavelength of the STED laser is usually chosen in the far red part of the fluorophore's emission spectrum to ensure for the STED light (1) a sufficiently large cross-section for stimulated S 1 to S 0 de-excitation, (2) a close-to-zero probability for S 0 to S 1 excitation and (3) a straightforward way to block the stimulated emission and STED light from the detection of the spontaneous fluorescence emission. Above a certain threshold intensity the STED light causes a more efficient stimulated than spontaneous S 1 to S 0 de-excitation, i.e. an inhibition of the detected (spontaneous) emission. The threshold or saturation intensity I S = (τ σ STED)−1 of the STED light is defined by the photon cross-section σ STED of stimulated emission at the wavelength λ STED of the STED laser and the lifetime τ of the excited S 1 state. With lifetimes in the range of 1–4 ns and stimulated emission cross-sections in the range of 10−17 cm2 (i.e. photon cross-sections σ STED ≈ 25–30 cm2/J) STED intensities of usually I S ≫ 1–10 MW/cm2 have to be applied to realize a sufficiently large fluorescence inhibition. Therefore, a preferred implementation of the STED concept is the use of pulsed excitation and STED lasers, where the concomitant high pulse peak intensities and the optimized timing (with the STED laser swiftly following the excitation pulse) result in very efficient stimulated emission (Donnert et al. Reference Donnert, Eggeling and Hell2009; Klar et al. Reference Klar, Jakobs, Dyba, Egner and Hell2000) (compare chapter 2.1.6).
One of the first biologically relevant experiments in STED imaging related to the observation of synaptic vesicles (Willig et al. Reference Willig, Rizzoli, Westphal, Jahn and Hell2006c). Synaptic transmission is mediated by neurotransmitters that are stored in synaptic vesicles and released by exocytosis upon activation. The vesicular membrane is retrieved by endocytosis, and synaptic vesicles are regenerated and re-filled with neurotransmitter. While many aspects of vesicle recycling are well understood, the fate of vesicle membranes after fusion was still unclear. Do their components diffuse on the plasma membrane, or do they remain together? This question had been difficult to answer because, with a size of approximately 40 nm in diameter, synaptic vesicles are too small to be resolved by conventional diffraction-limited fluorescence microscopes. With STED microscopy, individual synaptic vesicles were visualized in the synapse at a resolution of 65 nm (Fig. 3a). It was shown that synaptotagmin I, a protein resident in the membrane, remains clustered in isolated patches on the presynaptic plasma membrane.
STED nanoscopy. (a) A reversible molecular transition is realized by stimulated emission (inset): the turn-on light excites (Exc) the fluorophores from their (dark) ground S 0 to their (bright) excited S 1 state, where de-excitation by spontaneous fluorescence emission (Flu) is overruled by the addition of the STED laser inducing stimulated emission. Example scanning STED nanoscopy image of fluorescently labeled synaptotagmin I in fixed cultured hippocampal neurons, exemplifying the superior spatial resolution over conventional confocal microscopy and revealing that this protein is clustered in isolated patches on the presynaptic plasma membrane after synaptic vesicle exocytosis (adapted from (Willig et al. Reference Willig, Rizzoli, Westphal, Jahn and Hell2006c)). Scale bar: 1 μm. (b) Confocal (upper right) and STED images of immunolabeled microtubules in fixed mammalian cells (adapted from Wurm et al. Reference Wurm, Kolmakov, Göttfert, Ta, Bossi, Schill, Berning, Jakobs, Donnert, Belov and Hell2012). Scale bar: 500 nm. (c) Multi-color STED nanoscopy determining the co-localization of different molecules with sub-diffraction resolution, as exemplified for the D1 dopamine receptor and Na1,K1-ATPase in cultured striatal neurons (lower image: confocal recording, adapted from (Blom et al. Reference Blom, Rönnlund, Scott, Spicarova, Rantanen, Widengren, Aperia and Brismar2012)). Scale bars: 1 μm (in enlarged image: 200 nm). (d) Multi-color STED and confocal (peripheral parts) recordings of immunolabeled subunits in amphibian nuclear pore complexes (NPCs) of cultured Xenopus cells with close-ups (right) of the spatial organization of the peripheral gp210 and central pore pan-FG proteins in a single NPC (adapted from Göttfert et al. Reference Göttfert, Wurm, Mueller, Berning, Cordes, Honigmann and Hell2013). Scale bar: 500 nm. (e) 3D STED nanoscopy realized by overlapping two STED beams featuring confinement along the lateral x/y and axial z direction, respectively (left: x–y (upper) and x–z (lower) projections of the intensity distributions of the two STED lasers, scale bars: 200 nm), and by the use of two opposing microscope objectives (O1 and O2, right). The resulting isotropic observation spot of diameter below 40 nm allows the recording of super-resolved 3D images, as exemplified by resolving mitochondrial christae (middle, scale bar: 1 μm, adapted from (Schmidt et al. Reference Schmidt, Wurm, Punge, Egner, Jakobs and Hell2009)). (f) RESCue STED: Reduction of photobleaching in 3D STED imaging by applying an intelligent light exposure scheme that minimizes the number of excitation/de-excitation events a fluorophore has to undergo during recording of a scanning image: conventional (upper) and RESCue (lower) 3D STED recordings of fluorescent immunostained nuclear lamina in fixed neuroblastoma cells (arrow: third dimension scanning direction (y), adapted from (Staudt et al. Reference Staudt, Engler, Rittweger, Harke, Engelhardt and Hell2011)). Length of coordinate bars: x/z 1 μm, y 0·5 μm.
Similarly, with its improved spatial resolution STED nanoscopy could uncover new details of various cellular structures, protein clusters or DNA (e.g. Blom et al. Reference Blom, Rönnlund, Scott, Spicarova, Widengren, Bondar, Aperia and Brismar2011; Dyba et al. Reference Dyba, Jakobs and Hell2003; Kellner et al. Reference Kellner, Baier, Willig, Hell and Barrantes2007; Kittel et al. Reference Kittel, Wichmann, Rasse, Fouquet, Schmidt, Schmid, Wagh, Pawlu, Kellner, Willig, Hell, Buchner, Heckmann and Sigrist2006; Lau et al. Reference Lau, Lee, Sahl, Stearns and Moerner2012; Muller et al. Reference Muller, Schumann and Kraegeloh2012; Opazo et al. Reference Opazo, Levy, Byrom, Schaefer, Geisler, Groemer, Ellington and Rizzoli2012; Persson et al. Reference Persson, Bingen, Staudt, Engelhardt, Tegenfeldt and Hell2011; Schmidt et al. Reference Schmidt, Wurm, Jakobs, Engelhardt, Egner and Hell2008, Reference Schmidt, Wurm, Punge, Egner, Jakobs and Hell2009; Sieber et al. Reference Sieber, Willig, Kutzner, Gerding-Reimers, Harke, Donnert, Rammner, Eggeling, Hell, Grubmuller and Lang2007; Wagner et al. Reference Wagner, Lauterbach, Kohl, Westphal, Williams, Steinbrecher, Streich, Korff, Tuan, Hagen, Luther, Hasenfuss, Parlitz, Jafri, Hell, Lederer and Lehnart2012), making a STED microscope a uniquely helpful tool nowadays in cell-biological laboratories (Clausen et al. Reference Clausen, Galiani, Bernardino De La Serna, Fritzsche, Chojnacki, Gehmlich, Lagerholm and Eggeling2013). Furthermore, STED has important applications outside biology, ranging from nanoscale imaging of assemblies of colloidal particles and polymeric structures (Friedemann et al. Reference Friedemann, Turshatov, Landfester and Crespy2011; Harke et al. Reference Harke, Ullal, Keller and Hell2008b; Ullal et al. Reference Ullal, Schmidt, Hell and Egner2009, Reference Ullal, Primpke, Schmidt, Böhm, Egner, Vana and Hell2011) to solid-state physics (Wildanger et al. Reference Wildanger, Maze and Hell2011). With its capabilities and simplifications steadily growing, as outlined further on, and commercial instrumentation improving (Clausen et al. Reference Clausen, Galiani, Bernardino De La Serna, Fritzsche, Chojnacki, Gehmlich, Lagerholm and Eggeling2013), STED nanoscopy may become a workhorse of imaging facilities, greatly extending the resolving power of confocal microscopes.
2.1.1 Multicolor STED nanoscopy
In most cellular applications it is desirable not only to resolve a single structure at a time, but to highlight the relative sites and proximities of different molecules. In fluorescence microscopy this is usually realized by tagging the different molecules with different fluorescent labels, whose emission is then distinguished by its specific color, lifetime or potentially other fluorescence parameters. In a preferred implementation, the wavelength of the emitted light is chosen as a delimiter, and the fluorescence emission of the different labels is excited with lasers of different wavelength and detected on separate detectors monitoring different wavelength ranges. This principle is transferable to STED microscopy, however with the requirement of supplying a multitude of additional STED lasers, strictly speaking one for each label used. While this approach has rendered two-color STED imaging (Donnert et al. Reference Donnert, Keller, Wurm, Rizzoli, Westphal, Schoenle, Jahn, Jakobs, Eggeling and Hell2007b) possible, and revealed the co-localization of different proteins and structures on the nanometer-scale (Meyer et al. Reference Meyer, Wildanger, Medda, Punge, Rizzoli, Donnert and Hell2008), it entails a rather complex setup with the correct alignment of four lasers, two excitation and two STED beams. Furthermore, the simultaneous recording of the two colors proves itself somewhat difficult, since the more blue-shifted STED laser usually leads to a strong excitation and thus massive photobleaching of the more red-emitting dye. Therefore, initial two-color STED images were recorded sequentially. This limitation has been solved by straightforward optimizations of the choices of labels and wavelengths: (1) the combination of two labels with overlapping emission spectra and with a long (Stokes) shift between the excitation and emission spectrum of one of the labels allows the recording of two-color STED images with two excitation lasers but only one STED laser (serving both labels) (Clausen et al. Reference Clausen, Galiani, Bernardino De La Serna, Fritzsche, Chojnacki, Gehmlich, Lagerholm and Eggeling2013; Dean et al. Reference Dean, Liu, Staudt, Stahlberg, Vingill, Buckers, Kamin, Engelhardt, Jackson, Hell and Chapman2012; Friedemann et al. Reference Friedemann, Turshatov, Landfester and Crespy2011; Pellett et al. Reference Pellett, Sun, Gould, Rothman, Xu, Correa and Bewersdorf2011; Schmidt et al. Reference Schmidt, Wurm, Jakobs, Engelhardt, Egner and Hell2008). (Quasi-) simultaneous recording of both colors is possible in either a line-by-line or a pulse-interleaved excitation scheme, in both cases rapidly switching between the two excitation lasers. (2) Nanoscopic co-localization studies of various different proteins have been enabled by a carefully optimized choice of two conventional Stokes-shifted fluorophores, whose spectra differ by only about 60 nm, the use of two pairs of excitation/STED lasers timed in a pulsed interleaved excitation scheme, and with an elimination of the detection cross-talk by applying linear unmixing algorithms (Fig. 3c, d) (Blom et al. Reference Blom, Rönnlund, Scott, Spicarova, Rantanen, Widengren, Aperia and Brismar2012; Dean et al. Reference Dean, Liu, Staudt, Stahlberg, Vingill, Buckers, Kamin, Engelhardt, Jackson, Hell and Chapman2012; Neumann et al. Reference Neumann, Bückers, Kastrup, Hell and Jakobs2010; Opazo et al. Reference Opazo, Punge, Bückers, Hoopmann, Kastrup, Hell and Rizzoli2010; Reisinger et al. Reference Reisinger, Bresee, Neef, Nair, Reuter, Bulankina, Nouvian, Koch, Bückers, Kastrup, Roux, Petit, Hell, Brose, Rhee, Kügler, Brigande and Moser2011; Osseforth et al. Reference Osseforth, Moffitt, Schermelleh and Michaelis2013). In this scheme, the number of distinguishable labels could be increased to four by separating the emission based on emission wavelength and lifetime (Bückers et al. Reference Bückers, Wildanger, Vicidomini, Kastrup and Hell2011). (3) Recent two-color STED imaging has been realized using two excitation and a single STED laser only, e.g. 594 and 640nm excitation in combination with a 775nm STED laser (Göttfert et al. Reference Göttfert, Wurm, Mueller, Berning, Cordes, Honigmann and Hell2013). (4) Instituting rigorous linear unmixing with a single excitation and a single STED laser were sufficient to record two-color STED images of labels such as the yellow fluorescent protein (YFP) and green fluorescent protein (GFP), whose spectra are separated by about 20 nm (Tonnesen et al. Reference Tonnesen, Nadrigny, Willig, Wedlich-Soldner and Nägerl2011). Similarly, combining two reversibly photoswitchable fluorescent proteins (RSFPs) with opposite activation properties, two-color STED images were recorded with just one pair of excitation and STED lasers, without the necessity of applying linear unmixing, but with the addition of blue-light photoswitching (Willig et al. Reference Willig, Stiel, Brakemann, Jakobs and Hell2011). With the ongoing development of fluorescent labels and lasers, the number of fluorophores and matching excitation/STED laser pairs useful for multi-color STED imaging schemes will increase further.
2.1.2 3D STED nanoscopy
So far we have presented images recorded with STED nanoscopes which confine fluorescence emission and thus improve spatial resolution along the lateral direction only (using, e.g. the previously mentioned doughnut-like intensity distribution). The combination of this modality with an evanescent wave illumination (TIRF) scheme for excitation (Gould et al. Reference Gould, Myers and Bewersdorf2011; Leutenegger et al. Reference Leutenegger, Ringemann, Lasser, Hell and Eggeling2012) is sufficient for selectively imaging membranes of flat cells with penetration depths of <100 nm, and the combination with two-photon excitation realized imaging in ~800 nm thick sections with deep penetration depths (Bethge et al. Reference Bethge, Chereau, Avignone, Marsicano and Nägerl2013; Bianchini & Diaspro, Reference Bianchini and Diaspro2012; Ding et al. Reference Ding, Takasaki and Sabatini2009; Li et al. Reference Li, Wu and Chou2009b; Moneron & Hell, Reference Moneron and Hell2009; Takasaki et al. Reference Takasaki, Ding and Sabatini2013). However, the imaging of intra-cellular structures such as the Golgi apparatus or mitochondria often requires both a deeper penetration depth and an improvement of the spatial resolution along the axial z-direction as well. Four approaches have been applied so far: (1) The use of a phase plate that, upon interference, inhibits fluorescence along z and preferentially its combination with the doughnut-shaping plate creates the desired fluorescence restriction along all spatial directions (Fig. 3e) (Harke et al. Reference Harke, Keller, Ullal, Westphal, Schoenle and Hell2008a, Reference Harke, Ullal, Keller and Hellb; Klar et al. Reference Klar, Jakobs, Dyba, Egner and Hell2000; Wildanger et al. Reference Wildanger, Medda, Kastrup and Hell2009b; Osseforth et al. Reference Osseforth, Moffitt, Schermelleh and Michaelis2013). (2) The use of the doughnut-shaped STED focus in conjunction with illumination by two opposing objectives (as for 4Pi) has realized spatial resolution along the axial direction of down to 33 nm (Dyba & Hell, Reference Dyba and Hell2002; Dyba et al. Reference Dyba, Jakobs and Hell2003), or was used to create an effective isotropic observation volume with a spatial resolution of down to 30 nm along all spatial directions (Hell et al. Reference Hell, Schmidt and Egner2009; Schmidt et al. Reference Schmidt, Wurm, Jakobs, Engelhardt, Egner and Hell2008). Such an isoSTED microscope has given new insights into mitochrondrial structure, for example for the first time resolving the mitochondrial cristae with an optical microscope (Fig. 3f) (Schmidt et al. Reference Schmidt, Wurm, Punge, Egner, Jakobs and Hell2009). (3) Recently, a combination of STED with single plane illumination microscopy (SPIM) realized an almost two-fold improvement in axial resolution along with an 1·3-fold improvement along the lateral directions compared to conventional SPIM. Applying this illumination scheme, STED-SPIM should allow penetration depths of >100 μm and thus realize imaging inside zebra fish (Friedrich et al. Reference Friedrich, Gan, Ermolayev and Harms2011). (4) Adaptive optics allows the correction of aberrations occurring predominantly when imaging in 3D deep inside tissue (Gould et al. Reference Gould, Burke, Bewersdorf and Booth2012, Reference Gould, Kromann, Burke, Booth and Bewersdorf2013).
2.1.3 Photo-physical and -chemical considerations in STED nanoscopy
The signal strength and observation time of fluorescence experiments is limited by the population of metastable dark states and the photobleaching of the fluorophore label (e.g. Eggeling et al. Reference Eggeling, Widengren, Rigler and Seidel1998, Reference Eggeling, Widengren, Rigler, Seidel, Rettig, Strehmel, Schrader and Seifert1999; Tsien et al. Reference Tsien, Ernst, Waggoner and Pawley2006). Fluorescence emission follows the excitation of the fluorophore from its ground to its excited electronic state by, for example, laser light. The frequency and number of emitted photons depend on how fast and how many times one can cycle the fluorophore between the ground and excited state, respectively. In the excited state, the fluorophore becomes more fragile as reaction pathways to non-fluorescent species (such as ionization and/or breaking of double bonds) are opened up which can result in photobleaching, an irreversible loss of the ability to fluoresce. Furthermore, in the excited state the fluorophore may cross to metastable dark states of microsecond- to second-long lifetimes (such as the triplet state or radical states for usual organic dyes or fluorescent proteins), where the fluorophore is disengaged from the fluorescence cycling process, thus reducing the number of emitted photons. These long-lived dark states are much more prone to photobleaching than the first excited singlet state. For example, the triplet state efficiently interacts with molecular oxygen, generating highly reactive singlet oxygen (for a review see e.g. Eggeling et al. Reference Eggeling, Widengren, Rigler, Seidel, Rettig, Strehmel, Schrader and Seifert1999). On the other hand, high laser irradiances as for example used in scanning confocal microscopy open up new efficient photobleaching pathways by further exciting the already excited fluorophore to higher electronic states (e.g. Eggeling et al. Reference Eggeling, Widengren, Rigler and Seidel1998, Reference Eggeling, Volkmer and Seidel2005; Widengren & Rigler, Reference Widengren and Rigler1996). In aqueous environments, these excited species couple quite efficiently with ionic states and are thus highly reactive (e.g. Anbar & Hart, Reference Anbar and Hart1964; Reuther et al. Reference Reuther, Laubereau and Nikogosyan1996), usually characterized by more than ten-fold higher photobleaching probabilities than found from the first excited electronic states (e.g. Eggeling et al. Reference Eggeling, Widengren, Rigler and Seidel1998, Reference Eggeling, Volkmer and Seidel2005). Such non-linear photobleaching mechanisms are exceedingly efficient from the dark states due to their relatively long lifetime.
The accommodation of a large number of continuous excitation/de-excitation cycles and thus the maximization of the fluorescence signal has been approached by choosing experimental conditions which minimize the reactivity of the excited states as well as the populations of dark and higher excited states. This can either be done by choosing an appropriate dye with low photobleaching probabilities, low absorption cross-sections of the excited states and low dark state populations (e.g. Dittrich & Schwille, Reference Dittrich and Schwille2001; Eggeling et al. Reference Eggeling, Widengren, Rigler, Seidel, Rettig, Strehmel, Schrader and Seifert1999, Reference Eggeling, Widengren, Brand, Schaffer, Felekyan and Seidel2006; Tsien et al. Reference Tsien, Ernst, Waggoner and Pawley2006), or by the addition of chemicals (such as radical quencher or mercapto-compounds) that result in a reduction of photobleaching probabilities (especially of the higher excited electronic states) or in a quenching of the dark states (e.g. Dave et al. Reference Dave, Terry, Munro and Blanchard2009; Dittrich & Schwille, Reference Dittrich and Schwille2001; Eggeling et al. Reference Eggeling, Widengren, Rigler, Seidel, Rettig, Strehmel, Schrader and Seifert1999, Reference Eggeling, Widengren, Brand, Schaffer, Felekyan and Seidel2006; Rasnik et al. Reference Rasnik, Mckinney and Ha2006; Vogelsang et al. Reference Vogelsang, Kasper, Steinhauer, Person, Heilemann, Sauer and Tinnefeld2008; Widengren et al. Reference Widengren, Chmyrov, Eggeling, Lofdahl and Seidel2007). Unfortunately, an appropriate fluorophore may not always exist, or the addition of (sometimes toxic) chemicals is often invasive and not live-cell compatible. The minimization of dark state populations and non-linear photobleaching processes therefrom was approached with a method termed dark- or triplet-state relaxation (D- or T-Rex) microscopy (Donnert et al. Reference Donnert, Keller, Medda, Andrei, Rizzoli, Lurmann, Jahn, Eggeling and Hell2006, Reference Donnert, Eggeling and Hell2007a). The D- or T-Rex principle makes use of low-repetition pulsed laser light (Donnert et al. Reference Donnert, Keller, Medda, Andrei, Rizzoli, Lurmann, Jahn, Eggeling and Hell2006, Reference Donnert, Eggeling and Hell2007a) or of ultra-fast scanners (Donnert et al. Reference Donnert, Eggeling and Hell2009) to allow for an efficient depopulation of any dark state population in-between excitation events, thereby minimizing dark-state build-up and non-linear photobleaching from these states. The use of fast beam-scanning microscopes, where D-/T-Rex is effectively implemented, is especially suitable for live-cell fluorescence imaging experiments (Borlinghaus, Reference Borlinghaus2006; Conchello & Lichtman, Reference Conchello and Lichtman2005; Tsien et al. Reference Tsien, Ernst, Waggoner and Pawley2006; Vukojevic et al. Reference Vukojevic, Heidkamp, Minga, Johansson, Tereniusa and Rigler2008; Webb et al. Reference Webb, Wells, Sandison, Strickler, Herman and Jacobson1990).
In STED, the fluorophores are forced to undergo numerous transitions between their ground and excited state from which photobleaching or a dark-state transition may occur (Fig. 4a) (Donnert et al. Reference Donnert, Keller, Medda, Andrei, Rizzoli, Lurmann, Jahn, Eggeling and Hell2006; Dyba & Hell, Reference Dyba and Hell2003). In addition, increasing the irradiance of the STED laser to increase the gain in spatial resolution requires an adaptation of the scanning imaging process, with smaller pixel sizes and thus a larger number of scanning steps, unfortunately increasing the number of cycles that a molecule has to undergo during the recording of an image. Therefore, a key to sub-diffraction STED (or, similarly, GSD and RESOLFT) imaging is to ensure that the marker is able to switch repeatedly between its ON and OFF states in the presence of both the switch-on and switch-off light.
STED nanoscopy: photophysics and bleaching. (a) Photobleaching pathways: excitation (Exc) elevates a fluorophore from its ground S 0 to its first excited electronic state S 1, from where it either returns to S 0 by spontaneous fluorescence emission (Flu) or by STED, or it traverses with probability Φ D to a dark state whose lifetime τ D (time before return to S 0) is much longer than that of S 1. Photobleaching may occur from S 1 and the dark state, and is most pronounced from higher excited electronic states after further absorption of excitation or STED light (higher-order photobleaching, dashed lines). Horizontal lines: electronic states (thick) and vibrational sub-states (thin). Curved lines: vibrational transitions. (b) Suppression of photobleaching rate by STED: stimulated emission shortens the lifetime of S 1 and thus the probability of photobleaching as exemplified by the percentage of signal bleached after scanning a layer of the organic dye KK114 with and without the addition of STED light (excitation at 488 nm with 9 kW/cm2 and STED at 760 nm with 0·8 GW/cm2, repetition rate 76 MHz, scanning dwell time 10 ms). (c) Higher-order photobleaching from long-lived dark states, as exemplified by subsequent scanning STED images of 40-nm sized fluorescent beads, showing a significant loss of signal due to irreversible photobleaching (upper images). D-Rex illumination, i.e. increasing the time ΔT between subsequent pairs of excitation and STED pulses (i.e. decreasing the repetition rate 1/ΔT) above the dark states lifetime τ D allows the dark states to relax before incidence of the next pulses, avoiding higher-order photobleaching (lower images). D-Rex illumination by fast beam scanning (lower panel): for a fluorophore the incidence of only a few excitation-STED pulse pairs of high repetition rate (e.g. 80 MHz) is followed by a long resting period ΔT until the scanned beam pair hits the same spot again. (d) Higher-order photobleaching from the first excited electronic state S 1, as exemplified for the organic dyes pDI and pTDI and for eGFP. Absorption spectra of S 0 (blue) and S 1 (red) and fluorescence emission spectra (green) show that excitation to higher excited states from S 1 by the STED light may be significant for pDI and for eGFP at >595 nm, but not for pTDI, and for eGFP at <595 nm, resulting in far less photobleaching for pTDI, exemplified in CW-STED images of single pDI and pTDI molecules (confocal images were taken prior to STED recordings, pTDI: STED (white circle) and confocal recording (outer region), scale bar 500 nm, adapted from (Hotta et al. Reference Hotta, Fron, Dedecker, Janssen, Li, Muellen, Harke, Bückers, Hell and Hofkens2010), and for eGFP the STED wavelength between 556 and 592 nm, exemplified in STED recordings of live Vero cells expressing eGFP in the endoplasmic reticulum (middle panel, lower left corner: confocal image, scale bar: 1 μm, adapted from (Rankin et al. Reference Rankin, Moneron, Wurm, Nelson, Walter, Schwarzer, Schroeder, Colon-Ramos and Hell2011)). (e) STED at nitrogen temperatures. (Left) The cross-section of stimulated emission is highest at wavelengths close to the fluorescence emission maximum as exemplified for the organic dye Atto532 (columns: cross-sections of stimulated emission at selected wavelengths, black line: fluorescence emission spectrum scaled to the cross-section value at 568 nm). (Middle) As a consequence, less intensity of STED light is required for 568 nm compared to 605 nm to increase the spatial resolution in STED images of 80 nm-large Atto532-labeled beads, as determined for different intensities of the STED laser. (Right) STED imaging at 568 nm is however only possible at nitrogen temperatures, since the relative fluorescence emission evoked by the STED light increases for wavelengths closer to the emission maximum, but this anti-Stokes fluorescence excitation is efficiently suppressed at nitrogen temperatures <100 K, as exemplified for the dye Atto532 in polyvinyl-alcohol (PVA) (adapted from Giske Reference Giske2007).
Stimulated emission reduces the lifetime of the excited state and therefore in principle increases the photostability of the fluorophore in comparison to action of the excitation laser only (Fig. 4b). However, unwanted excitation to the higher excited states usually antagonizes this process (Fig. 4a). As a consequence, it was the realization of D- or T-Rex (see above) STED imaging that demonstrated for the first time down to 20 nm macro-molecular spatial resolution in cells (Donnert et al. Reference Donnert, Keller, Medda, Andrei, Rizzoli, Lurmann, Jahn, Eggeling and Hell2006), and it is the implementation of fast beam-scanning that nowadays allows routine live-cell STED nanoscopy (compare Section 2.1.5) (Fig. 4c) (Moneron et al. Reference Moneron, Medda, Hein, Giske, Westphal and Hell2010). Additionally, STED nanoscopy becomes much more feasible by choosing fluorophores with a low absorption cross-section of the first excited state at the wavelength of the STED laser (Hotta et al. Reference Hotta, Fron, Dedecker, Janssen, Li, Muellen, Harke, Bückers, Hell and Hofkens2010), or by appropriately adapting the latter to minimize non-linear photobleaching (Fig. 4d) (Rankin et al. Reference Rankin, Moneron, Wurm, Nelson, Walter, Schwarzer, Schroeder, Colon-Ramos and Hell2011). This has recently allowed STED imaging in an intact living organism, namely Caenorhabditis elegans expressing eGFP (Rankin et al. Reference Rankin, Moneron, Wurm, Nelson, Walter, Schwarzer, Schroeder, Colon-Ramos and Hell2011). STED at nitrogen temperatures attempted to minimize photobleaching and to maximize the efficiency of stimulated emission (Fig. 4e) (Giske, Reference Giske2007), unfortunately making live-cell studies less feasible. The choice of other promising emitters such as the very photostable nitrogen vacancy (NV) centers in diamond has recently allowed STED imaging with a spatial resolution of down to 5 nm (see Section 2.3) (Han et al. Reference Han, Wildanger, Rittweger, Meijer, Pezzagna, Hell and Eggeling2012; Rittweger et al. Reference Rittweger, Han, Irvine, Eggeling and Hell2009a). Similarly, special quantum dots (QDs) could be used in a STED-like fashion (Irvine et al. Reference Irvine, Staudt, Rittweger, Engelhardt and Hell2008). Unfortunately, the use of most conventional QDs for STED is so far impeded by their low Stokes shift and narrow band of emission. Nevertheless, a large range of appropriate fluorophores for STED nanoscopy is now known. Still, the development of new bright and photostable dyes, often specialized for STED applications, has and continuously will enhance the applicability and flexibility of experiments using this super-resolution technique (Boyarskiy et al. Reference Boyarskiy, Belov, Medda, Hein, Bossi and Hell2008; Kolmakov et al. Reference Kolmakov, Belov, Bierwagen, Ringemann, Mueller, Eggeling and Hell2010a, Reference Kolmakov, Belov, Wurm, Harke, Leutenegger, Eggeling and Hell2010b, Reference Kolmakov, Wurm, Hennig, Rapp, Jakobs, Belov and Hell2012; Mitronova et al. Reference Mitronova, Belov, Bossi, Wurm, Meyer, Medda, Moneron, Bretschneider, Eggeling, Jakobs and Hell2010; Wurm et al. Reference Wurm, Kolmakov, Göttfert, Ta, Bossi, Schill, Berning, Jakobs, Donnert, Belov and Hell2012).
The number of cycles that a molecule has to undergo is severely increased when recording 3D images, where one plane after the other is scanned at different optical (z) axis positions. Here, an intelligent light exposure scheme was put into practice. Related to controlled light exposure microscopy – introduced for decreasing photobleaching and increasing the number of detected fluorescence photons in scanning microscopy (Hoebe et al. Reference Hoebe, Van Oven, Gadella, Dhonukshe, Van Noorden and Manders2007) – the reduction of state transition cycles (RESCue)-STED scheme uses an online feedback algorithm that rapidly switches off the excitation and STED light during a scanning step when no or only low signal is detected (Staudt et al. Reference Staudt, Engler, Rittweger, Harke, Engelhardt and Hell2011). Thereby, the cycling of nearby fluorophores is minimized and the total number of on–off cycles significantly reduced. For 3D scanning imaging, this reduces the probability of dark state transitions and photobleaching in the adjacent axial planes, consequently increasing the number of planes that can be successively recorded (Fig. 3f).
2.1.4 Cluster analysis in STED nanoscopy
Clustering of molecules is key in a lot of cellular processes. Unfortunately, these clusters can often not be characterized accurately, especially in the living cell, mainly because their sizes are usually below the diffraction barrier and thus cannot be determined with conventional light microscopy. The use of a STED nanoscope is an obvious way to overcome this limitation. STED was applied to image various molecular assemblies in different cells, tissue or membranes. To name a few, STED imaging was used to study the clustering to ~70-nm large spots of a synaptic vesicle protein after exocytosis (Fig. 3a) (Willig et al. Reference Willig, Rizzoli, Westphal, Jahn and Hell2006c), the anatomy of supra-molecular membrane protein clusters of approximately 50–60 nm in diameter (Sieber et al. Reference Sieber, Willig, Kutzner, Gerding-Reimers, Harke, Donnert, Rammner, Eggeling, Hell, Grubmuller and Lang2007), the dynamics of approximately 80-nm large synaptic vesicle movements (Westphal et al. Reference Westphal, Rizzoli, Lauterbach, Kamin, Jahn and Hell2008), or the formation of domains in phase separated membrane bilayers of down to below 40 nm in diameter (Honigmann et al. Reference Honigmann, Mueller, Hell and Eggeling2013b, Reference Lau, Lee, Sahl, Stearns and Moerner2012). These examples have in common that previously blurred structures are now revealed as a multitude of single isolated clusters. Besides the cluster size, STED imaging also gives access to further parameters such as cluster brightness (and thus an estimate of the number of molecules per cluster) and the cluster density. An advantage of the STED approach is that it gives a direct image, i.e. cluster parameters such as cluster size can directly be inferred from the recorded image without having to introduce considerable image processing. In the following we will give an example of such a cluster analysis using STED nanoscopy.
We had previously shown that syntaxin 1A, a protein of the soluable N-ethylmaleimide-sensitive factor attachment protein receptors (SNARE) family of receptors which are involved in exocytosis, forms clusters of about 50–60 nm in diameter in the plasma membrane of PC12 cells (Sieber et al. Reference Sieber, Willig, Heintzmann, Hell and Lang2006, Reference Sieber, Willig, Kutzner, Gerding-Reimers, Harke, Donnert, Rammner, Eggeling, Hell, Grubmuller and Lang2007). An important question remains how these clusters change with increasing expression levels of syntaxin. For this, we created membrane sheets of PC12 cells, after fixation added labelled antibodies against syntaxin (HPC-1 monoclonal antibody and a secondary antibody decorated with the green-emitting dye Atto 532) and imaged their distribution using a custom-built STED nanoscope, as described previously (Sieber et al. Reference Sieber, Willig, Heintzmann, Hell and Lang2006). To test the performance of our STED cluster analysis, we artificially created syntaxin clusters with a broad range of sizes and densities, as follows: (1) direct fixed: the cells were fixed directly after the membrane sheet preparation (i.e. after removing the upper part of the cell). (2) Patched 1: the sheets were incubated for 1 h at 37 °C prior to fixation (in 200 μl/CS sonication buffer with 1% BSA). (3) Patched 2: preparation as for patched 1 but with a polyclonal antibody during the 1 h incubation. For cases (2) and (3) we expect an enhanced (artificial) clustering of syntaxin, which should result in larger and brighter but less dense protein assemblies. Figure 5a shows representative STED images together with conventional confocal counterparts (circles) of these three different preparations. Clearly, the clusters can be much more accurately resolved with STED, and their density behaves as expected.
STED nanoscopy: Cluster analysis. (a) ICS, FIDA and SCA analysis of syntaxin clusters recorded by STED. Upper panels: STED and confocal (circled areas) images of membrane sheets of PC12 cells immunolabeled for syntaxin for three different preparations (directly fixed (left) and patched 1 (middle) and 2 (right)). For the latter two, clustering is reinforced and cluster density decreased, dashed rectangles: analysed area, scale bar: 500 nm. Lower panels: values of cluster density (left), brightness (middle) and size (right) determined for different cells of the different preparations (dots: direct fixed, triangles: patched 1, diamonds: patched 2); left panel: 3D data (black) and projections to different value pairs (blue, green, red) of cluster density by ICS, FIDA and SCA, showing agreeing results by the different analysis techniques. (b) Syntaxin cluster morphology is independent of its expression level. Left panel: STED and confocal (left part) image of three representative membrane sheets generated from PC12 cells expressing different levels of immunolabeled myc syntaxin 1A (cell 1 with a low (probably endogenous) level of syntaxin, and cells 2 and 3 with different overexpression levels, adapted from (Sieber et al. Reference Sieber, Willig, Heintzmann, Hell and Lang2006)). Plot of cluster brightness (upper middle), size (lower middle) and density (right) against the expression level (~average pixel brightness) determined by ICS (black) and FIDA (red) from the STED images of different cells, revealing no variation of brightness and size with expression level, and a linear increase of density with expression level.
We applied three different statistical approaches to gain accurate values of cluster size, brightness and density. (1) Single cluster analysis (SCA): using an image analysis algorithm for identifying single isolated spots, clusters were separated and their brightness, diameter and the number of clusters per area determined (Willig et al. Reference Willig, Rizzoli, Westphal, Jahn and Hell2006c). (2) Image correlation analysis (ICS) (Petersen et al. Reference Petersen, Hoddelius, Wiseman, Seger and Magnusson1986): the calculation and analysis of the autocorrelation function of the number of counts in the image pixels over space allows the determination of cluster size and density. (3) Fluorescence intensity distribution analysis (FIDA) or photon-counting-histogram (PCH) image analysis (Chen et al. Reference Chen, Muller, So and Gratton1999; Kask et al. Reference Kask, Palo, Ullmann and Gall1999): The assembly and analysis of the histogram of the number of counts in the image pixels establishes relative values of cluster brightness and density (compare Digman et al. Reference Digman, Dalal, Horwitz and Gratton2008; Sergeev et al. Reference Sergeev, Costantino and Wiseman2006). Applied to the STED images of the three different syntaxin preparations (direct fixed, patched 1 and patched 2), the three different analysis approaches (SCA, ICS and FIDA) congruently confirmed larger cluster brightness and sizes and lower densities for the patched compared to the direct fixed preparations, as expected (Fig. 5a). The advantage of ICS and FIDA over SCA is that these two analysis methods may still be applied to images with higher cluster densities, where SCA starts to fail at clearly separating single isolated spots, similar to advantages of fluorescence correlation spectroscopy (FCS) and FIDA over single fluorescence burst analysis in the study of diffusing molecules (e.g. Eggeling et al. Reference Eggeling, Schaffer, Volkmer, Seidel, Brand, Jaeger and Gall2001b).
With the cluster analysis of the STED images tested, we now studied the formation of syntaxin clusters under different levels of syntaxin expression. Figure 5b depicts a representative STED image and its confocal counterpart of the syntaxin clusters of the membrane sheets of three PC12 cells, each expressing different levels of syntaxin. The preparation and labelling of these sheets was performed as for the direct fixed case. Again, clusters can be much better resolved with STED, and their sizes, brightness and densities accurately determined from subsets of the STED images with ICS and FIDA, even for the highly expressing cell. We used the average number of counts per pixel as a relative measure of the expression level in each image subset. As a result we could recognize that the expression level only determined the density but not the size and brightness (i.e. number of molecules) of the clusters. This is an important insight into the characteristics of the protein clusters (Sieber et al. Reference Sieber, Willig, Heintzmann, Hell and Lang2006, Reference Sieber, Willig, Kutzner, Gerding-Reimers, Harke, Donnert, Rammner, Eggeling, Hell, Grubmuller and Lang2007): increasing the concentration of the protein more than ten-fold seems to increase only the number of clusters formed, but not their composition.
2.1.5 Live-cell and in-vivo STED nanoscopy
Due to the aforementioned potential phototoxic effects of the image recording schemes, STED imaging was for long believed to be non-compatible with the study of living cells. However, first images of YFP-labeled endoplasmatic reticulum (ER) and microtubular networks in PtK2 cells proved the opposite (Hein et al. Reference Hein, Willig and Hell2008). Especially the use of fast scanning units nowadays allows a straightforward use of STED nanoscopy for the study of the living cell using genetically encoded markers such as fluorescent proteins (Bethge et al. Reference Bethge, Chereau, Avignone, Marsicano and Nägerl2013; Eggeling et al. Reference Eggeling, Ringemann, Medda, Schwarzmann, Sandhoff, Polyakova, Belov, Hein, Von Middendorff, Schönle and Hell2009; Hein et al. Reference Hein, Willig and Hell2008; Li et al. Reference Li, Wu and Chou2009b; Moneron & Hell, Reference Moneron and Hell2009; Morozova et al. Reference Morozova, Piatkevich, Gould, Zhang, Bewersdorf and Verkhusha2010; Nägerl et al. Reference Nägerl, Willig, Hein, Hell and Bonhoeffer2008; Rankin et al. Reference Rankin, Moneron, Wurm, Nelson, Walter, Schwarzer, Schroeder, Colon-Ramos and Hell2011; Tonnesen et al. Reference Tonnesen, Nadrigny, Willig, Wedlich-Soldner and Nägerl2011; Urban et al. Reference Urban, Willig, Hell and Nägerl2011; Willig et al. Reference Willig, Kellner, Medda, Hein, Jakobs and Hell2006b), or tagging proteins such as SNAP-, HALO- or CLIP-tags for proteins (Eggeling et al. Reference Eggeling, Ringemann, Medda, Schwarzmann, Sandhoff, Polyakova, Belov, Hein, Von Middendorff, Schönle and Hell2009; Hein et al. Reference Hein, Willig, Wurm, Westphal, Jakobs and Hell2010; Lukinavicius et al. Reference Lukinavicius, Umezawa, Olivier, Honigmann, Yang, Plass, Mueller, Reymond, Correa, Luo, Schultz, Lemke, Heppenstall, Eggeling and Johnsson2013; Pellett et al. Reference Pellett, Sun, Gould, Rothman, Xu, Correa and Bewersdorf2011; Schröder et al. Reference Schröder, Benink, Dyba and Los2008) or specifically for actin or microtubule-networks (Lukinavicius et al. Reference Lukinavicius, Reymond, D'Este, Masharina, Göttfert, Ta, Güther, Fournier, Rizzo, Waldmann, Blaukopf, Sommer, Gerlich, Arndt, Hell and Johnsson2014), or fluorogen-activating tags (Fitzpatrick et al. Reference Fitzpatrick, Yan, Sieber, Dyba, Schwarz, Szent-Gyorgyi, Woolford, Berget, Waggoner and Bruchez2009) that covalently bind functionalized and membrane-permeable organic dyes. Ranging from the study of the nanoscale dynamics of different cellular molecules, molecular assemblies and structures such as the cytoskeleton, ER, mitochondria, peroxisomes, caveolae, membrane lipids and proteins or vesicles (e.g. Eggeling et al. Reference Eggeling, Ringemann, Medda, Schwarzmann, Sandhoff, Polyakova, Belov, Hein, Von Middendorff, Schönle and Hell2009; Hein et al. Reference Hein, Willig and Hell2008, Reference Hein, Willig, Wurm, Westphal, Jakobs and Hell2010; Moneron & Hell, Reference Moneron and Hell2009; Morozova et al. Reference Morozova, Piatkevich, Gould, Zhang, Bewersdorf and Verkhusha2010; Muller et al. Reference Muller, Schumann and Kraegeloh2012; Pellett et al. Reference Pellett, Sun, Gould, Rothman, Xu, Correa and Bewersdorf2011; Rankin et al. Reference Rankin, Moneron, Wurm, Nelson, Walter, Schwarzer, Schroeder, Colon-Ramos and Hell2011; Tonnesen et al. Reference Tonnesen, Nadrigny, Willig, Wedlich-Soldner and Nägerl2011; Westphal et al. Reference Westphal, Rizzoli, Lauterbach, Kamin, Jahn and Hell2008; Willig et al. Reference Willig, Stiel, Brakemann, Jakobs and Hell2011), live-cell STED nanoscopy experiments have also been realized with multi-color detection (Bethge et al. Reference Bethge, Chereau, Avignone, Marsicano and Nägerl2013; Pellett et al. Reference Pellett, Sun, Gould, Rothman, Xu, Correa and Bewersdorf2011; Tonnesen et al. Reference Tonnesen, Nadrigny, Willig, Wedlich-Soldner and Nägerl2011; Willig et al. Reference Willig, Stiel, Brakemann, Jakobs and Hell2011), and video-rate STED imaging has been pushed to a time resolution of up to 80–200 frames per second. The STED method is therefore the fastest reported super-resolution imaging mode to date (Lauterbach et al. Reference Lauterbach, Keller, Schönle, Kamin, Westphal, Rizzoli and Hell2010a, Reference Lauterbach, Ullal, Westphal and Hellb; Westphal et al. Reference Westphal, Lauterbach, Di Nicola and Hell2007, Reference Westphal, Rizzoli, Lauterbach, Kamin, Jahn and Hell2008).
In an application to neurobiology it was shown that it is possible to image dendritic spines of YFP-positive or organic-dye-filled hippocampal neurons in organotypic slices (Fig. 6a) (Ding et al. Reference Ding, Takasaki and Sabatini2009; Nägerl et al. Reference Nägerl, Willig, Hein, Hell and Bonhoeffer2008; Urban et al. Reference Urban, Willig, Hell and Nägerl2011). Spines are the dendritic processes that form the postsynaptic part of most excitatory synapses in the mammalian brain. In neurobiology, confocal and two-photon microscopy are widely used to study activity-dependent changes in synaptic morphology by recording time lapse images. However, the diffraction-limited resolution of light microscopy is often inadequate, forcing researchers to complement the live-cell imaging strategy by electron microscopy. Time-lapse STED nanoscopy outperforms confocal microscopy in revealing important structural details and can be used for quantification of morphological parameters, such as the neck width and curvature of the heads of spines, which play critical roles for the function and plasticity of synaptic connections (Urban et al. Reference Urban, Willig, Hell and Nägerl2011), and can be correlated to synaptic signaling (Tonnesen et al. Reference Tonnesen, Katona, Rozsa and Nägerl2014). Here, the use of aberration-reducing optics has realized STED imaging deep inside scattering biological tissue with penetration depth of up to 120 μm (Urban et al. Reference Urban, Willig, Hell and Nägerl2011).
Live-cell STED nanoscopy. (a) Time-lapse STED imaging of dendritic processes in a living hippocampal slice culture labeled with the fluorescent protein YFP (1 frame every 40 s, adapted from (Nägerl et al. Reference Nägerl, Willig, Hein, Hell and Bonhoeffer2008)). Arrows indicate a change in shape over time of a cup-like spine head. Scale bar: 1 μm. (b) In-vivo STED nanoscopy of a YFP-labeled neuron in the molecular layer of the somatosensory cortex of a mouse (left, inset depicts imaging setup). A maximum intensity projection of dendritic and axonal structures proves a spatial resolution of <70 nm (upper right). Temporal dynamics of spine morphology (lower right). Scale bar: 1 μm. Adapted from (Berning et al. Reference Berning, Willig, Steffens, Dibaj and Hell2012). (c) Two-color in-vivo STED imaging of astrocytes and neurons offers the possibility to study the influence of the astrocyte on synaptic transmission in vivo. Confocal overview (left, 100 × 100 μm, scale bar: 10 μm) and STED close-up image (right, scale bar: 500 nm) of the somatosensory cortex in a double transgenic mouse expressing cytosolic EYFP in neurons (TgN(Thy1-EYFP)) and cytosolic GFP in astrocytes (TgN(GFAP-EGFP)GFEC).
With STED nanoscopy available to study the living cell it will be exciting to see where it can unravel fundamental details. The imaging of spines is a good example because synaptic function is related to its shape. Super-resolution is necessary because the size of the spine neck is below the diffraction barrier. However, the main function of neurons is information processing by forming connections with their neighbours. This can only be studied where they are embedded in their natural environment and, if possible, in the living animal. Therefore, STED imaging was adapted to resolve neurons and their subtle dynamics in the cerebral cortex of a living mouse with so far unachieved spatial resolution. An upright STED nanoscope was constructed and adapted to the spectroscopic properties of YFP. The somatosensory cortex of the anaesthetised mouse was exposed through a glass-sealed hole in the skull (Berning et al. Reference Berning, Willig, Steffens, Dibaj and Hell2012). Figure 6b shows an image of the setup as well as of dendritic processes within the molecular layer of a TgN (Thy1-YFP) mouse taken by STED. The line profile shows that the smallest structures are <70 nm in diameter, indicating that the resolution is at least of that order. Recording images over 30 min in the living organism revealed that the dendritic spine can undergo morphologic changes and movements on the time scale of minutes. Furthermore, multi-colour STED recordings of the somatosensory cortex in double transgenic mice have the potential to study the influence of astrocytes on synaptic transmission in vivo (Fig. 6c). This shows that STED nanoscopy can be a tool to study brain function or the origin of brain diseases which are related to a structural change.
2.1.6 Lasers for STED
The development of the STED method has significantly benefited from improvements in laser technologies. STED nanoscopy was first realized with pulsed and high-repetition (~80 MHz) Ti:Sa laser systems for stimulated emission and laser diodes for excitation (Klar et al. Reference Klar, Jakobs, Dyba, Egner and Hell2000). This configuration requires the exact timing of both lasers. This is usually accomplished by triggering the laser diodes using custom-built delay electronics, and stretching of the Ti:Sa pulses to 50–300 ps by, for example, glass rods and fibers. The triggering and pulse stretching optimize the timing and efficiency of the stimulated emission relative to the excitation laser pulses, and minimize bias due to polarization effects, jitters in the timing of the excitation and the STED pulses, multi-photon excitation processes, non-linear photobleaching via higher excited electronic states and direct excitation by the STED light (e.g. Dyba & Hell, Reference Dyba and Hell2003). While the Ti:Sa laser with wavelengths typically around 700–800 nm may directly be used for STED imaging of dyes emitting in the red spectrum (>600 nm), fluorescent labels such as GFP, YFP, Alexa 488, TMR and similar emit at around 500–590 nm and require STED wavelengths in the range of 590–650 nm. Pulsed laser light in this wavelength range and with average powers of 100–150 mW is delivered by an optical parametric oscillator (OPO) pumped by a Ti:Sa laser (Willig et al. Reference Willig, Kellner, Medda, Hein, Jakobs and Hell2006b, Reference Willig, Rizzoli, Westphal, Jahn and Hellc). Such Ti:Sa arrangements are usually rather complex and costly. Nevertheless, the use of Ti:Sa lasers is still one of the preferred options for STED nanoscopy (e.g. Auksorius et al. Reference Auksorius, Boruah, Dunsby, Lanigan, Kennedy, Neil and French2008; Berning et al. Reference Berning, Willig, Steffens, Dibaj and Hell2012; Eggeling et al. Reference Eggeling, Ringemann, Medda, Schwarzmann, Sandhoff, Polyakova, Belov, Hein, Von Middendorff, Schönle and Hell2009; Gould et al. Reference Gould, Myers and Bewersdorf2011; Lau et al. Reference Lau, Lee, Sahl, Stearns and Moerner2012; Leutenegger et al. Reference Leutenegger, Ringemann, Lasser, Hell and Eggeling2012; Nägerl et al. Reference Nägerl, Willig, Hein, Hell and Bonhoeffer2008; Pellett et al. Reference Pellett, Sun, Gould, Rothman, Xu, Correa and Bewersdorf2011; Sieber et al. Reference Sieber, Willig, Heintzmann, Hell and Lang2006, Reference Sieber, Willig, Kutzner, Gerding-Reimers, Harke, Donnert, Rammner, Eggeling, Hell, Grubmuller and Lang2007; Westphal et al. Reference Westphal, Rizzoli, Lauterbach, Kamin, Jahn and Hell2008; Willig et al. Reference Willig, Kellner, Medda, Hein, Jakobs and Hell2006b, Reference Willig, Rizzoli, Westphal, Jahn and Hell2006c). Ti:Sa-based laser systems were employed in the first demonstration of two-color STED imaging (Donnert et al. Reference Donnert, Keller, Wurm, Rizzoli, Westphal, Schoenle, Jahn, Jakobs, Eggeling and Hell2007b; Meyer et al. Reference Meyer, Wildanger, Medda, Punge, Rizzoli, Donnert and Hell2008), have been integrated in a commercial system (Clausen et al. Reference Clausen, Galiani, Bernardino De La Serna, Fritzsche, Chojnacki, Gehmlich, Lagerholm and Eggeling2013; Fitzpatrick et al. Reference Fitzpatrick, Yan, Sieber, Dyba, Schwarz, Szent-Gyorgyi, Woolford, Berget, Waggoner and Bruchez2009; Morozova et al. Reference Morozova, Piatkevich, Gould, Zhang, Bewersdorf and Verkhusha2010; Schröder et al. Reference Schröder, Benink, Dyba and Los2008) and have facilitated the D- or T-Rex modality (using a regenerative amplified (Rega) mode-locked Ti:sapphire oscillator) (Donnert et al. Reference Donnert, Keller, Medda, Andrei, Rizzoli, Lurmann, Jahn, Eggeling and Hell2006).
Several options have been presented to reduce complexity and cost of the laser setup. Giving up the wavelength tunability, the use of single-wavelength pico- or nanosecond laser modules allows reducing costs (Westphal et al. Reference Westphal, Blanca, Dyba, Kastrup and Hell2003), and their high pulse peak powers have facilitated imaging with spatial resolutions of <10–20 nm (Göttfert et al. Reference Göttfert, Wurm, Mueller, Berning, Cordes, Honigmann and Hell2013; Rittweger et al. Reference Rittweger, Han, Irvine, Eggeling and Hell2009a). The lowest-cost STED nanoscope to date has been realized by pulsing a 660 nm DVD-diode, i.e. a compact off-the-shelf laser diode (Schrof et al. Reference Schrof, Staudt, Rittweger, Wittenmayer, Dresbach, Engelhardt and Hell2011). Strong and compact single-wavelength lasers are therefore increasingly applied for STED, especially in new commercial STED nanoscopes. Multiple laser lines for STED and excitation can simultaneously be chosen from a pulsed white light or super-continuum laser, which offers highest flexibility for wavelength optimization, and disburdens from the necessity of synchronizing several lasers (Auksorius et al. Reference Auksorius, Boruah, Dunsby, Lanigan, Kennedy, Neil and French2008; Blom et al. Reference Blom, Rönnlund, Scott, Spicarova, Widengren, Bondar, Aperia and Brismar2011; Wildanger et al. Reference Wildanger, Rittweger, Kastrup and Hell2008, Reference Wildanger, Medda, Kastrup and Hell2009b). The advent of white light lasers alleviated the setup of multi-color STED instruments (Blom et al. Reference Blom, Rönnlund, Scott, Spicarova, Rantanen, Widengren, Aperia and Brismar2012; Bückers et al. Reference Bückers, Wildanger, Vicidomini, Kastrup and Hell2011; Neumann et al. Reference Neumann, Bückers, Kastrup, Hell and Jakobs2010). In another development, a ~530 nm pico- or nanosecond microchip or fiber-amplified, frequency doubled laser was coupled into a standard single-mode fiber to produce a tunable spectrum of discrete peaks between 530 and 620 nm via stimulated Raman scattering (SRS) (Rankin & Hell, Reference Rankin and Hell2009; Rankin et al. Reference Rankin, Kellner and Hell2008). This again allowed a flexible choice of STED laser wavelengths, demonstrating STED imaging with spatial resolution down to 20–30 nm (Rankin & Hell, Reference Rankin and Hell2009; Rankin et al. Reference Rankin, Kellner and Hell2008, Reference Rankin, Moneron, Wurm, Nelson, Walter, Schwarzer, Schroeder, Colon-Ramos and Hell2011).
Further simplification of the setup was achieved by realizing STED nanoscopy with continuous-wave (CW) lasers, since no laser-pulse preparation is required (Willig et al. Reference Willig, Harke, Medda and Hell2007). CW-STED imaging was first realized with strong Argon–Krypton lasers (Willig et al. Reference Willig, Harke, Medda and Hell2007) or Ti:Sa lasers running in CW mode (Ding et al. Reference Ding, Takasaki and Sabatini2009; Harke, Reference Harke2008), but since then it has been shown that it is possible to utilize compact fibre lasers (Bianchini & Diaspro, Reference Bianchini and Diaspro2012; Moneron & Hell, Reference Moneron and Hell2009; Moneron et al. Reference Moneron, Medda, Hein, Giske, Westphal and Hell2010), diode-pumped solid-state (DPSS) lasers (Honigmann et al. Reference Honigmann, Eggeling, Schulze and Lepert2012; Mueller et al. Reference Mueller, Eggeling, Karlsson and Von Gegerfelt2012) or amplified diode lasers (Honigmann et al. Reference Honigmann, Mueller, Fernando, Eggeling and Sperling2013a) at wavelengths between 560 and 765 nm, also on commercial systems (Clausen et al. Reference Clausen, Galiani, Bernardino De La Serna, Fritzsche, Chojnacki, Gehmlich, Lagerholm and Eggeling2013; Friedemann et al. Reference Friedemann, Turshatov, Landfester and Crespy2011). However, CW-STED comes with two drawbacks compared to the pulsed STED modality. Firstly, much higher average laser powers have to be applied (Harke, Reference Harke2008; Willig et al. Reference Willig, Harke, Medda and Hell2007). This follows from the fact that tightly synchronized trains of excitation and STED pulses, as realized in the pulsed modality, yield an optimized efficiency of stimulated emission: the pulses of the STED beam reach the focal plane virtually simultaneously with or a few picoseconds after the excitation pulses so as to instantly inhibit fluorescence emission from excited molecules. In contrast, in the CW-STED beam implementation the STED intensity and thereby the probability of stimulated de-excitation is lower. As a consequence, to achieve the same fluorescence inhibition efficiency by stimulated emission, (ln(2) f τ)−1-fold larger time-averaged powers of the CW than of a pulsed STED laser have to be supplied (with fluorescence lifetime τ of the label and repetition rate f of the pulsed STED modality) (Harke, Reference Harke2008; Willig et al. Reference Willig, Harke, Medda and Hell2007). For usual parameters f = 80 MHz and τ = 3·5 ns this amounts to about five-fold larger time-averaged CW powers, for example 800 mW in the CW compared to 160 mW in the pulsed case. Secondly, a further consequence of the CW STED modality is that a non-negligible fraction of the molecules emit fluorescence before having been exposed to much of the STED light, and thus residual fluorescence outside the zero-intensity point of the STED light leads to a pedestal in the effective observation spot, resulting in somewhat lower-contrast images (Leutenegger et al. Reference Leutenegger, Eggeling and Hell2010).
Besides the aforementioned simplifications of the laser arrangements (Kastrup et al. Reference Kastrup, Wildanger, Rankin, Hell and Diaspro2010), compact and more robust STED setups have been created by using optimized phase plates for realizing the focal intensity distribution of the STED laser (Reuss et al. Reference Reuss, Engelhardt and Hell2010; Wildanger et al. Reference Wildanger, Bückers, Westphal, Hell and Kastrup2009a). Based on diffractive optical elements, a single-beam-path STED nanoscope has been constructed, which includes a phase plate that selectively modulates the STED beam but leaves the excitation beam unchanged. In this configuration the beams are aligned by design and the alignment is hence insensitive to mechanical drift (easySTED) (Wildanger et al. Reference Wildanger, Bückers, Westphal, Hell and Kastrup2009a). Similarly, a birefringent device has been instituted which produces the doughnut-shaped focal spot with suitable polarization for the STED laser while leaving the excitation spot virtually intact, and which in addition can be adapted to reveal, through the resulting fluorescence image, the orientation of fluorophores in the sample, thus directly providing sub-diffraction resolution images of molecular orientation (Reuss et al. Reference Reuss, Engelhardt and Hell2010). Using Wollaston prisms, a common beam-shaping device realized a parallelized STED nanoscope featuring four pairs of scanning excitation and STED beams. This arrangement provides four-fold increased imaging speed of a given sample area, while maintaining the advantages of a single-beam easy STED instrument (Bingen et al. Reference Bingen, Reuss, Engelhardt and Hell2011). Further increases in image acquisition speed are achieved by the use of even more parallelized scanning excitation and STED beams, as recently introduced by camera-based detection and wide-field excitation together with well-designed optical patterns for STED (Yang et al. Reference Yang, Przybilla, Mestre, Trebbia and Lounis2014; Bergermann et al. Reference Bergermann, Alber, Sahl, Engelhardt and Hell2015). Spatial light modulators have been applied to auto-align a STED nanoscope (Gould et al. Reference Gould, Kromann, Burke, Booth and Bewersdorf2013).
Overall, it is to be expected that further developments in laser and optical technology will create more and more compact and less costly systems, and thus will further facilitate the use of STED imaging in day-to-day biophysical and medical research.
2.1.7 Gated CW-STED nanoscopy
The problem of the pedestal inherent to the CW-STED modality can be solved by implementing a pulsed-laser excitation in combination with the CW-STED laser and a time-gated detection scheme (Moffitt et al. Reference Moffitt, Osseforth and Michaelis2011; Vicidomini et al. Reference Vicidomini, Moneron, Han, Westphal, Ta, Reuss, Engelhardt, Eggeling and Hell2011). Time-gated detection is often used in fluorescence microscopy for suppressing background (e.g. Eggeling et al. Reference Eggeling, Berger, Brand, Fries, Schaffer, Volkmer and Seidel2001a; Shera et al. Reference Shera, Seitzinger, Davis, Keller and Soper1990), and, in a pulsed STED scheme, it is well known that photons should be detected after the STED pulse has left (Schrader et al. Reference Schrader, Meinecke, Bahlmann, Kroug, Cremer, Soini and Hell1995; Westphal & Hell, Reference Westphal and Hell2005), as shown in a recent experiment using time-correlated single photon counting (Auksorius et al. Reference Auksorius, Boruah, Dunsby, Lanigan, Kennedy, Neil and French2008). This is due to the fact that scattered laser light or residual fluorescence signal only occurs during the laser pulses. Time-gated detection also improves the contrast of CW-STED images by selectively suppressing image contents (or spatial frequencies) of low spatial resolution, i.e. the aforementioned pedestal or blurring (Fig. 7) (Moffitt et al. Reference Moffitt, Osseforth and Michaelis2011; Vicidomini et al. Reference Vicidomini, Moneron, Han, Westphal, Ta, Reuss, Engelhardt, Eggeling and Hell2011, Reference Vicidomini, Schoenle, Ta, Han, Moneron, Eggeling and Hell2013). This follows from the fact that fluorescence inhibition is lowest during the duration of the excitation pulse (usually <150 ps), while right afterwards only the CW-STED beam is acting and inhibiting fluorescence emission: the longer it lasts, the more likely it becomes that a fluorophore is switched off, i.e. the spatial resolution not only depends on the intensity of the STED light but also on the time span of the STED beam action (Hell et al. Reference Hell, Jakobs and Kastrup2003; Vicidomini et al. Reference Vicidomini, Schoenle, Ta, Han, Moneron, Eggeling and Hell2013). This can also be rationalized in the sense that STED reduces the fluorescence lifetime τ of the excited fluorescent state. Ensuring that photons are collected only for delays significantly after the excitation pulse largely suppresses signal from strongly inhibited molecules: fluorescence light is recorded mainly from fluorophores from the zero-intensity doughnut center, where the STED beam is inherently weak (and thus the fluorescence lifetime rather long). Along with the improved image contrast, the selection of high spatial frequencies by the gated detection scheme also allows to apply lower CW-STED powers compared to the non-gated CW-STED scheme to be able to similarly discern alike features (Vicidomini et al. Reference Vicidomini, Moneron, Han, Westphal, Ta, Reuss, Engelhardt, Eggeling and Hell2011). This, and the fact that CW in comparison to pulsed beams may be less prone to induce phototoxic multiphoton processes, reduces light-induced stress on the sample. It is worth noting that these improvements always come with a reduction in signal, since the gating suppresses valuable signal as well (Vicidomini et al. Reference Vicidomini, Schoenle, Ta, Han, Moneron, Eggeling and Hell2013). Gated-STED (gSTED) nanoscopy has been realized for different fluorophores and in living cells, and has now been incorporated into a commercial system, allowing the recording of live-cell images with sub-diffraction spatial resolution at moderate CW STED powers <80 mW (Clausen et al. Reference Clausen, Galiani, Bernardino De La Serna, Fritzsche, Chojnacki, Gehmlich, Lagerholm and Eggeling2013; Vicidomini et al. Reference Vicidomini, Moneron, Han, Westphal, Ta, Reuss, Engelhardt, Eggeling and Hell2011). Data acquisition for gSTED has been demonstrated by offline processing of time-correlated single-photon counting data, or in real-time using a fast electronic gate. As for CW-STED, gSTED nanoscopy can be realized with compact CW lasers, which are nowadays available at various wavelengths (Honigmann et al. Reference Honigmann, Eggeling, Schulze and Lepert2012, Reference Honigmann, Mueller, Fernando, Eggeling and Sperling2013a; Mueller, Reference Mueller2012) and show improved performance with reduced noise levels (Hernandez et al. Reference Hernandez, d'Amora, Diaspro and Vicidomini2014a). Of all current STED modalities, gSTED provides the sharpest STED images at the lowest peak laser powers.
gSTED nanoscopy. (a) Principle: the fluorescence lifetime of a fluorophore decreases with increasing STED power as depicted for representative fluorescence lifetime decays for different STED powers (left): using pulsed excitation (blue, Exc) and CW-STED (red) in conjunction with gated detection (detection within the time period ΔT (green) with a time lag T g (grey) relative to the exciting pulse) favors signal from points of low STED power, i.e. from areas at or close to the intensity zero. (b) Scanning fluorescence intensity (left and upper right) and lifetime (lower right) images of a single fluorophore for confocal diffraction-limited (upper left), CW-STED (intensity: lower left, lifetime: lower right) and gSTED (upper right) recordings (scale bar: 200 nm), and (right panel) intensity line profiles through the middle images, indicating the removal of the pedestal of the CW-STED recordings (black) by the gated detection (gSTED, red). (c) Confocal and gSTED images (right: magnification of central area marked by the dashed white box) of keratin fused to the fluorescent protein citrine in a living PtK2 cell with low CW STED laser power. Scale bar: 1 μm. Adapted from (Vicidomini et al. Reference Vicidomini, Moneron, Han, Westphal, Ta, Reuss, Engelhardt, Eggeling and Hell2011).
Besides the aforementioned improvement in image contrast, gated detection also allows to specifically suppress background signal. On one hand, discarding signal during the excitation pulse (as done for gSTED) reduces scattering signal from the excitation laser (e.g. Eggeling et al. Reference Eggeling, Berger, Brand, Fries, Schaffer, Volkmer and Seidel2001a; Shera et al. Reference Shera, Seitzinger, Davis, Keller and Soper1990). On the other hand, the rejection of signal for time delays after the excitation pulse much longer than the fluorescence lifetime τ of the fluorophore specifically suppresses continuous background signal such as fluorescence light excited by the CW-STED laser or detector noise. This allows using wavelengths of the STED laser closer to the fluorescence emission maximum, which reduces the required laser powers (Vicidomini et al. Reference Vicidomini, Moneron, Eggeling, Rittweger and Hell2012; Hernandez et al. Reference Hernandez, Peres, Zanacchi, d'Amora, Christodoulou, Bianchini, Diaspro and Vicidomini2014b). Consequently, gated detection introduces high flexibility, especially if the acquired data is post-processed by software. This will not only allow an optimization of the image contrast, but also the investigation of the very same data for different image contrasts, i.e. for different gating positions (Vicidomini et al. Reference Vicidomini, Moneron, Han, Westphal, Ta, Reuss, Engelhardt, Eggeling and Hell2011).
2.1.8 STED-FCS: nanoscale single-molecule dynamics
The ongoing quest to study molecular dynamics not in the ensemble but at the molecular level calls for measurements both of molecular numbers and, crucially, with access to molecular spatial scales. Compared to ensemble measurements, studies at the single-molecule level reach a much increased sensitivity as they may reveal heterogeneities hidden in the ensemble and disclose deviations from the ergodic theorem (i.e. a time-averaged ensemble measurement may not be the same as the ensemble average of a large number of single-molecule measurements). Fluorescence microscopy has reached single-molecule detection sensitivity (Moerner & Kador, Reference Moerner and Kador1989; Orrit & Bernard, Reference Orrit and Bernard1990; Shera et al. Reference Shera, Seitzinger, Davis, Keller and Soper1990; Weiss, Reference Weiss1999; Zander et al. Reference Zander, Enderlein and Keller2002), and studies of single-molecule dynamics have given many new, detailed insights into physical, chemical and biological problems (e.g. Lord et al. Reference Lord, Lee and Moerner2010; Moerner, Reference Moerner2007). In this context, statistical analysis tools such as Fluorescence Correlation Spectroscopy (FCS) (Ehrenberg & Rigler, Reference Ehrenberg and Rigler1974; Haustein & Schwille, Reference Haustein and Schwille2003; Magde et al. Reference Magde, Webb and Elson1972) or photon-counting histogram analysis (PCH) (Chen et al. Reference Chen, Muller, So and Gratton1999) and Fluorescence Intensity Distribution Analysis (FIDA) (Kask et al. Reference Kask, Palo, Ullmann and Gall1999) have been extremely helpful. However, further insights into a lot of (single-molecule) dynamical processes have been again impeded by the limited spatial resolution of common diffraction-limited fluorescence microscopy. 1) The concentration of fluorescently labeled molecules has to be very low (<nM) to reach the single-molecule level with conventional confocal observation volumes – a concentration which is often far below that of endogenous (biological) conditions. In contrast to performing measurements in zero-mode waveguides (Leutenegger et al. Reference Leutenegger, Goesch, Perentes, Hoffmann, Martin and Lasser2006; Levene et al. Reference Levene, Korlach, Turner, Foquet, Craighead and Webb2003; Wenger et al. Reference Wenger, Conchonaud, Dintinger, Wawrezinieck, Ebbesen, Rigneault, Marguet and Lenne2007), or to photobleach (Moertelmaier et al. Reference Moertelmaier, Brameshuber, Linimeier, Schutz and Stockinger2005) or switch off (Eggeling et al. Reference Eggeling, Hilbert, Bock, Ringemann, Hofmann, Stiel, Andresen, Jakobs, Egner, Schönle and Hell2007) large parts of the ensemble, the most obvious way to handle larger, endogenous concentrations would be to lower the observation spot's length scale (its size) (Blom et al. Reference Blom, Kastrup and Eggeling2006; Kastrup et al. Reference Kastrup, Blom, Eggeling and Hell2005; Weiss, Reference Weiss2000). 2) The conventional confocal observation spot usually averages over details of nanoscale molecular dynamics. For example, strongly localized trapping cannot directly be distinguished from slow but regular molecular diffusion (Eggeling et al. Reference Eggeling, Ringemann, Medda, Schwarzmann, Sandhoff, Polyakova, Belov, Hein, Von Middendorff, Schönle and Hell2009). In the case of confocal FCS observations of molecular membrane dynamics, such discrimination has indirectly been realized, for example, by searching for anomalies in diffusion (Schwille et al. Reference Schwille, Korlach and Webb1999), by extrapolating to the nanoscopic case (Wawrezinieck et al. Reference Wawrezinieck, Rigneault, Marguet and Lenne2005), or by probing in the near-field on nanostructures or -holes (Leutenegger et al. Reference Leutenegger, Goesch, Perentes, Hoffmann, Martin and Lasser2006; Manzo et al. Reference Manzo, Van Zanten and Garcia-Parajo2011; Wenger et al. Reference Wenger, Conchonaud, Dintinger, Wawrezinieck, Ebbesen, Rigneault, Marguet and Lenne2007). However, very direct measurements at the length scale of interest (i.e. observing diffusion dynamics through sub-diffraction-sized far-field observation spots) deliver much more reliable and model-independent results about nanoscopic details of molecular diffusion and interactions and, at the same time, allow indirect methods to access even smaller length scales.
In an attempt to access smaller length scales, non-invasive far-field microscopy was thus combined with single-particle tracking (SPT), utilizing the high spatial localization precision of down to the 1-nanometer level for bright marker particles (Geerts et al. Reference Geerts, Debrabander, Nuydens, Geuens, Moeremans, Demey and Hollenbeck1987; Kusumi et al. Reference Kusumi, Nakada, Ritchie, Murase, Suzuki, Murakoshi, Kasai, Kondo and Fujiwara2005; Schutz et al. Reference Schutz, Schindler and Schmidt1997; Sheetz et al. Reference Sheetz, Turney, Qian and Elson1989; Yildiz et al. Reference Yildiz, Forkey, Mckinney, Ha, Goldman and Selvin2003). Yet this introduces other restrictions: to reach the desired spatial localization precision, SPT often applies bright but rather large signal markers, which potentially influence the system under study (Clausen & Lagerholm, Reference Clausen and Lagerholm2011). When using conventional fluorophore labeling the temporal resolution is lower. And while important insights can be gained in carefully optimized SPT experiments, for example if the full spatiotemporal resolution afforded by the fluorophore photon budget is harnessed in fast molecular tracking schemes (Sahl et al. Reference Sahl, Leutenegger, Hilbert, Hell and Eggeling2010, Reference Sahl, Leutenegger, Hell and Eggeling2014), the amount of data to be gathered for an accurate statement on an average molecular behavior is higher for SPT compared to FCS. In addition to the concentration issue, the stochastic sampling concomitant with SPT yields low statistics and random coverage from a single measurement only.
A remedy for these limitations is the combination of FCS with the STED principle (Eggeling et al. Reference Eggeling, Ringemann, Medda, Schwarzmann, Sandhoff, Polyakova, Belov, Hein, Von Middendorff, Schönle and Hell2009; Kastrup et al. Reference Kastrup, Blom, Eggeling and Hell2005; Ringemann et al. Reference Ringemann, Harke, Middendorff, Medda, Honigmann, Wagner, Leutenegger, Schoenle, Hell and Eggeling2009). STED-FCS delivers high temporal and spatial resolution together with a high degree of statistical averaging. The most straightforward parameters measured with FCS are the average transit time τ D of the fluorescent molecules through the observation area/volume and the average number N of fluorescing molecules in the observation volume. One expects both τ D and N to decrease with the confinement of the observation spot, i.e. with the STED power. Figure 8a shows exemplarily FCS data for fluorophores in solution exhibiting 3D free diffusion. While the expected decrease of τ D is observed, N does not decrease as strongly, and even increases for high STED powers due to a reduced signal-to-background ratio (SBR) (Ringemann et al. Reference Ringemann, Harke, Middendorff, Medda, Honigmann, Wagner, Leutenegger, Schoenle, Hell and Eggeling2009). The low SBR is caused by non-inhibited, low-brightness fluorescence signals from out-of-plane volume shells. Contributions of the latter to the overall signal grow relative to the declining fluorescence signal from the more and more confined observation spot (Fig. 8a) (Ringemann et al. Reference Ringemann, Harke, Middendorff, Medda, Honigmann, Wagner, Leutenegger, Schoenle, Hell and Eggeling2009). This degradation in SBR has on the one hand been observed for confinement along x/y only, but also for confinement along z or along all three spatial directions (Kastrup et al. Reference Kastrup, Blom, Eggeling and Hell2005; Ringemann et al. Reference Ringemann, Harke, Middendorff, Medda, Honigmann, Wagner, Leutenegger, Schoenle, Hell and Eggeling2009), even when using two-photon excitation (Moneron & Hell, Reference Moneron and Hell2009) or two opposing objectives in an iso-STED arrangement (Schmidt et al. Reference Schmidt, Wurm, Jakobs, Engelhardt, Egner and Hell2008). The biased values of N can straightforwardly be corrected for by, for example, a combined or global FCS-FIDA analysis (Fig. 8a, right) (Ringemann et al. Reference Ringemann, Harke, Middendorff, Medda, Honigmann, Wagner, Leutenegger, Schoenle, Hell and Eggeling2009). Therefore, while such reduction effects on the SBR might limit the sensitivity of STED-FCS experiments for 3D diffusion, it does not necessarily preclude such measurements, such as assessments of nanoscale molecular diffusion dynamics inside living cells.
STED-FCS. (a) STED-FCS analysis of free 3D-diffusion of the organic dye Atto647N in aqueous solution. Representative correlation data (left panels, left: normalized amplitudes, right: original data) for confocal (black) and STED recordings (open dots) and (right panel) relative values of transit time τ D (black), particle number N (original open dots, background-corrected grey triangles), and signal fraction of apparent background (grey crosses) determined from FCS and FIDA data recorded for increasing power of the doughnut-shaped (inset left) STED laser. The size reduction of the observation spot by increasing the STED power shortens the dye's transit time, but also introduces an increasing contribution of apparent un-depleted low-brightness background, which introduces noise and dampens the FCS data's amplitude and thus results in an apparent increase of N, which can be corrected for by a global FCS-FIDA analysis. (b) Relative apparent background for the STED-FCS recordings for two different pinhole sizes (decrease from left to right), and for a fluorescent lipid analog diffusing in a multi-lamellar membrane. Reduction of the pinhole size reduces un-depleted out-of-plane low-brightness fluorescence signal (apparent background), which diminishes further when measuring two-dimensional diffusion in membranes, where out-of-plane signal is absent. (c) STED-FCS analysis of free 2D-diffusion of a fluorescent lipid analog in a multi-lamellar membrane. Representative correlation data (left panels, left: normalized amplitudes, right: original data) for confocal (black) and STED recordings (open dots) and (right panel) relative values of transit time τ D (black) and particle number N (original open dots, background-corrected grey triangles) determined from FCS and FIDA data recorded for increasing power of the doughnut-shaped STED laser. The confinement of the observation spot by increasing the STED power reduces both τ D and N, without an influence by out-of-plane signal contributions. (d) STED allows single-molecule observations at high concentrations. Fluorescence signal over time for the same concentration of a fluorescent lipid analog diffusing in a multi-lamellar membrane indicates diffusion of single molecules only for the STED (right) but not for the confocal (left) recordings. Adapted from (Ringemann et al. Reference Ringemann, Harke, Middendorff, Medda, Honigmann, Wagner, Leutenegger, Schoenle, Hell and Eggeling2009).
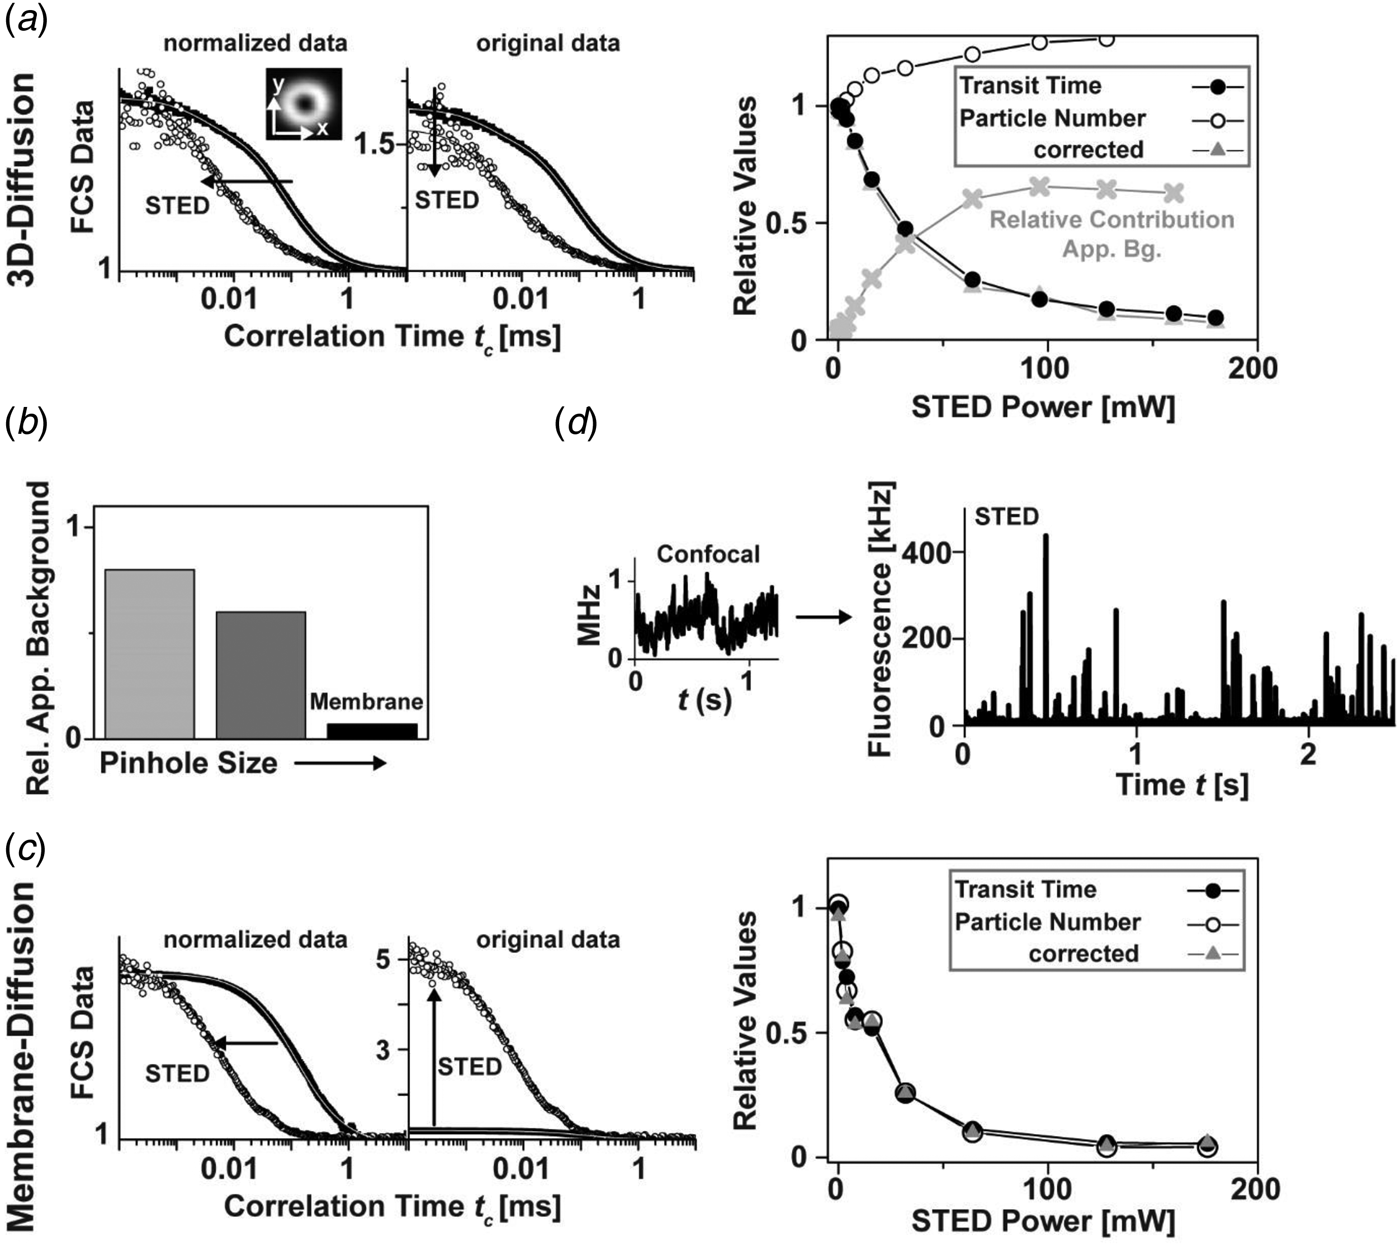
The above out-of-plane background vanishes for 2D diffusion measurements such as within membranes, where no out-of-plane signal is present (Fig. 8b). Here, both τ D and N decrease with increasing STED power, i.e. with the confinement of the observation area, as expected (Fig. 8c) (Ringemann et al. Reference Ringemann, Harke, Middendorff, Medda, Honigmann, Wagner, Leutenegger, Schoenle, Hell and Eggeling2009). Recently, STED-FCS has also been combined with evanescent (TIRF) illumination to reject out-of-plane background (Leutenegger et al. Reference Leutenegger, Ringemann, Lasser, Hell and Eggeling2012). However, the maximum achievable resolution of the TIRF-STED-FCS setup was only 50–60 nm due to side lobes inherent to the confocal TIRF illumination scheme. An important observation is that the STED mode reduces the transit times but hardly the detected fluorescence brightness (if the intensity zero of the STED focus is properly aligned, i.e. it really is close to zero). In Fig. 8d, the detected photon count-rate of a typical molecular trace of fluorescent lipids in multi-lamellar membrane layers peaks at 300–400 kHz which enables the analysis of single-molecule STED data at a good signal-to-noise ratio. Most importantly, signatures of single-molecule transits are only observable for small, sub-diffraction sized spots as created by STED, while the concentration is too high for conventional confocal recordings (Fig. 8d). Therefore, STED allows accurate single-molecule measurements on the cellular plasma membrane of living cells, and thus is a powerful tool for shedding new light on long-standing biological questions.
2.1.9 STED-FCS: live-cell membrane dynamics
Many membrane-associated processes such as signaling events are considered to be closely related to cholesterol-mediated interactions of some lipids such as sphingolipids (Brown & London, Reference Brown and London2000; Fielding, Reference Fielding2006; Hanzal-Bayer & Hancock, Reference Hanzal-Bayer and Hancock2007; Jacobson et al. Reference Jacobson, Mouritsen and Anderson2007; Simons & Ikonen, Reference Simons and Ikonen1997). In contrast to phosphoglycerolipids, these lipids are assumed to form molecular complexes or integrate, assisted by cholesterol, into <200 nm sized lipid nanodomains, usually denoted ‘rafts’ (Simons & Ikonen, Reference Simons and Ikonen1997). These interactions may disturb the diffusion of lipids and proteins in the plasma membrane, and on the other hand may compartmentalize cellular signaling (Pike, Reference Pike2006). Although several experiments indicate their existence, such complexes and/or lipid ‘rafts’ remained controversial due to the lack of suitable techniques for detecting these small-sized objects in living cells (Hancock, Reference Hancock2006; Jacobson et al. Reference Jacobson, Mouritsen and Anderson2007; Lommerse et al. Reference Lommerse, Spaink and Schmidt2004; Munro, Reference Munro2003; Shaw, Reference Shaw2006). A common problem is once again that the <200 nm sized domains cannot be resolved by conventional confocal microscopes, and thus common fluorescence recovery after photobleaching (Feder et al. Reference Feder, Brust-Mascher, Slattery, Baird and Webb1996; Yechiel & Edidin, Reference Yechiel and Edidin1987) or confocal FCS measurements (Fahey et al. Reference Fahey, Koppel, Barak, Wolf, Elson and Webb1977; Schwille et al. Reference Schwille, Korlach and Webb1999; Wawrezinieck et al. Reference Wawrezinieck, Rigneault, Marguet and Lenne2005) average over nanoscale details of molecular diffusion. STED nanoscopy opens up a new avenue to elucidate lipid diffusion.
Figure 9 shows FCS analysis of lipid diffusion in the plasma membrane of living mammalian cells recorded with a STED nanoscope. The unique feature of the STED method to continuously downscale the size of the observation area with laser intensity and/or gated detection allows the determination of the average transit time τ D for different diameters d of the observation, revealing different modes of diffusion (Fig. 9d) (Eggeling et al. Reference Eggeling, Ringemann, Medda, Schwarzmann, Sandhoff, Polyakova, Belov, Hein, Von Middendorff, Schönle and Hell2009; He & Marguet, Reference He and Marguet2011; Ruprecht et al. Reference Ruprecht, Wieser, Marguet and Schuetz2011; Wawrezinieck et al. Reference Wawrezinieck, Rigneault, Marguet and Lenne2005). Unlike the confocal recordings, the STED-FCS data reveal distinct differences between fluorescent phosphoglycerolipid (PE) and sphingolipid (SM) analogs. Most importantly, it is revealed that while the PE lipids diffuse freely, the SM lipids diffuse heterogeneously on small spatial scales, being transiently (~10–20 ms) trapped in cholesterol-mediated molecular complexes with relatively slow-moving or immobilized binding partners. Such previously inaccessible molecular details depict how the non-invasive optical recording of molecular time traces and fluctuation data in tunable nanoscale domains is a powerful new approach to study the dynamics of biomolecules in living cells. Recent work could not detect any correlation between the nanoscale trapping as observed by STED-FCS in living cells and partitioning characteristics of the labeled lipids into liquid ordered domains of phase separated model membranes (which is often assumed as a physical model of lipid ‘rafts’) (Fig. 9f) (Eggeling, Reference Eggeling, Mely and Duportail2012; Mueller et al. Reference Mueller, Ringemann, Honigmann, Schwarzmann, Medda, Leutenegger, Polyakova, Belov, Hell and Eggeling2011, Reference Mueller, Honigmann, Ringemann, Medda, Schwarzmann, Eggeling and Tetin2013; Sezgin et al. Reference Sezgin, Levental, Grzybek, Schwarzmann, Mueller, Honigmann, Belov, Eggeling, Coskun, Simons and Schwille2012; Honigmann et al. Reference Honigmann, Mueller, Ta, Schoenle, Sezgin, Hell and Eggeling2014). Rather, the trapping characteristics and the dependence on cholesterol are highly dependent on the molecular structure of the lipid (however not on the dye label or the labeling position), identifying the ceramide or sphingosine group close to the water–lipid interface as well as the lipid's headgroup as the driving forces for molecular interactions (Fig. 9g) (Mueller et al. Reference Mueller, Ringemann, Honigmann, Schwarzmann, Medda, Leutenegger, Polyakova, Belov, Hell and Eggeling2011). Therefore, we may recall our previous statement (Eggeling, Reference Eggeling, Mely and Duportail2012; Mueller et al. Reference Mueller, Ringemann, Honigmann, Schwarzmann, Medda, Leutenegger, Polyakova, Belov, Hell and Eggeling2011, Reference Mueller, Honigmann, Ringemann, Medda, Schwarzmann, Eggeling and Tetin2013), ‘that the observed transient trapping with its rather strong binding to other membrane constituents follows a different molecular mechanism than that of the weak interactions responsible for the formation of ordered phases in model membranes. […] If one pictures the STED-FCS observations in the context of lipid ‘rafts’, one may support a current view that (sphingo)lipid rafts may establish fluctuating nanoscale assemblies of sphingolipid, cholesterol and proteins that can be stabilized to coalesce, forming platforms that function in membrane signaling and trafficking (Lingwood & Simons, Reference Lingwood and Simons2010). Here, the STED-FCS experiments may highlight the fluctuating nanoscale assemblies, which then seem to be highly diverse and strongly depending on the lipid structure. It remains to be shown whether these fluctuating nanoscale assemblies may be stabilized to coalesce to maybe more tightly packed domains (Joly, Reference Joly2004; Lingwood & Simons, Reference Lingwood and Simons2010). A fluorescent lipid analog that partitions into the liquid ordered phase of model membranes (like its natural counterpart) may be able to report on this coalescence.’ Recently, such a lipid analog has successfully been tested in STED experiments (Honigmann et al. Reference Honigmann, Mueller, Hell and Eggeling2013b), and initial experiments in live-cell membranes indicated no difference to the liquid-disordered partitioning of fluorescent lipid analogs (Sezgin et al. Reference Sezgin, Levental, Grzybek, Schwarzmann, Mueller, Honigmann, Belov, Eggeling, Coskun, Simons and Schwille2012; Honigmann et al. Reference Honigmann, Mueller, Ta, Schoenle, Sezgin, Hell and Eggeling2014). Caution has to be taken when designating any lipid-based interaction or heterogeneous organization as a ‘raft’, since the basis of these may be highly diverse (Eggeling, Reference Eggeling, Mely and Duportail2012; Mueller et al. Reference Mueller, Ringemann, Honigmann, Schwarzmann, Medda, Leutenegger, Polyakova, Belov, Hell and Eggeling2011, Reference Mueller, Honigmann, Ringemann, Medda, Schwarzmann, Eggeling and Tetin2013; Sezgin et al. Reference Sezgin, Levental, Grzybek, Schwarzmann, Mueller, Honigmann, Belov, Eggeling, Coskun, Simons and Schwille2012).
STED-FCS analysis of lipid plasma membrane diffusion. (a) Lipids and proteins are heterogeneously distributed in the cellular plasma membrane, stemming from often cholesterol-assisted lipid–protein interactions (which may be the basis for the coalescence of transient signaling platforms, denoted membrane domains or lipid ‘rafts’, i.e. spatially confined molecular assemblies of different lipids and proteins which are essential for a cellular signaling event), an asymmetric molecular distribution to the inner and outer leaflet of the bilayer, the underlying cytoskeleton (which is membrane-anchored via proteins), and from membrane curvature and pits. Adapted from (Lingwood & Simons, Reference Lingwood and Simons2010). (b) Structures of the fluorescent lipid analogs phosphoethanolamine (PE) and sphingomyelin (SM), both tagged with the organic dye Atto647N. Grey shaded area: ceramide or sphingosine group of the SM lipid. (c) Representative confocal and STED (observation diameter d = 40 nm) FCS data of PE (red), SM (black) and SM after cholesterol depletion by Cholesterol Oxidase (grey, SM+COase). The SM STED-FCS data can only be described by anomalous diffusion, revealing cholesterol-assisted hindered diffusion of the SM lipid analog. (d) The dependence of the transit time τ D for different sub-diffraction sized observation areas ~d 2 (as tuned by the STED laser power) shows an almost free diffusion (linear dependence, dark grey line diffusion coefficient 0·5 μm2/s) for PE (red squares) and SM after cholesterol depletion (open circles), and a hindered diffusion (non-linear dependence) for SM (grey circles). The minimal change of τ D for very small observation areas (grey horizontal line) and Monte-Carlo simulations indicate that the hindrance in diffusion is caused by transient complexes with either relatively slow-moving or immobilized membrane molecules (red dotted line) and not by incorporation into ⩾20 nm large domains, where diffusion is slowed down (green dotted line). The direct observation of these transient interactions is impossible with the large diffraction-limited confocal observation area (grey shaded area). (e) Schematic drawing of normal free (red) and hindered SM diffusion (blue, dots: points of interactions or complexes). (f) Comparison of live-cell and model membrane data. Phase separation into liquid-disordered (Ld) and liquid-ordered (Lo) domains of a model membrane bilayer composed of a ternary mixture: both the fluorescent PE and SM lipid analogs hardly enter the Lo phase (upper panel: confocal scanning fluorescence image, black: low signal, white: high signal, adapted from (Mueller et al. Reference Mueller, Ringemann, Honigmann, Schwarzmann, Medda, Leutenegger, Polyakova, Belov, Hell and Eggeling2011)). Partitioning in model membranes and trapping characteristics observed by STED-FCS on live-cell plasma membranes are not correlated (lower panel): Trapping time (red, left axis, live-cell) and fraction of signal in Lo phase (grey, right axis, model membranes) of PE and SM (adapted from Sezgin et al. Reference Sezgin, Levental, Grzybek, Schwarzmann, Mueller, Honigmann, Belov, Eggeling, Coskun, Simons and Schwille2012). (g) STED-FCS analysis of the plasma membrane diffusion of different fluorescent lipid analogs, revealing lipid-specific interactions and independence on dye and label position. Average transit time τ D for confocal (d ≈ 250 nm, upper panel) and STED (d ≈ 40 nm, lower panel) recordings of the Atto647N- or Atto532-labeled phosphoethanolamine (PE: head group and PE1: acyl-chain labeled), sphingomyelin (SM: acyl-chain and CPE: head-group labeled), ganglioside GM1 (GM1: acyl-chain, GM1#: head-group and GM1##: chain addition), and of an Atto647N-tagged transfected GPI-anchor. The meshed bars in the lower panel indicate the values of τ D determined after cholesterol depletion by COase treatment. Error bars result from averaging over more than thirty measurements. No dependence of the STED-FCS data on the dye-label position has been observed, apart from using the dye Atto532 on the lipid's acyl chain, which accelerates diffusion and lowers trapping probability. Adapted from (Eggeling et al. Reference Eggeling, Ringemann, Medda, Schwarzmann, Sandhoff, Polyakova, Belov, Hein, Von Middendorff, Schönle and Hell2009).
2.2 Generalization: STED, GSD, SSIM/SPEM and RESOLFT
Stimulated emission is only one way to reversibly transfer molecules between states of different fluorescence properties. Similarly, other state transitions may be applied for sub-diffraction optical microscopy (nanoscopy). The key is to identify a pair of ON- and OFF-states between which at least one transition can be driven by light (Hell, Reference Hell2004, Reference Hell2009b; Hell et al. Reference Hell, Jakobs and Kastrup2003). The different mechanisms used so far are summarized in Fig. 10a; they most significantly differ in the molecular states involved, the required laser intensities and the choice of label.
Generalization of coordinate-targeted (deterministic) nanoscopy: the RESOLFT concept. (a) Different molecular states and transitions can be applied to reversibly inhibit fluorescence for coordinate-targeted nanoscopy ranging from STED (stimulated emission), over GSD (metastable dark states), SPEM/SSIM/GSD (ground state depletion by saturated excitation) to RESOLFT (e.g. photoswitchable fluorophores, different conformational states): acronyms (left), molecular states (middle) with energy level diagram of a fluorophore (ground S 0, excited S 1 and dark states) and transitions for ON (left middle) and OFF (right middle) direction (middle: ON-OFF transitions with excitation (Exc), fluorescence (Flu), stimulated emission (STED), metastable dark states (with crossing probability Φ D and lifetime τ D), bright (ON) and dark (OFF) conformational states (with on- and off-switching light and potential spontaneous transition lifetime τ) and intensity I of the corresponding lasers), intensity I dependence of switching with threshold intensities I S (right), and approximate values of I S. Adapted from (Hell, Reference Hell2007). (b) GSD nanoscopy: (left) dependence of the inhibition of fluorescence on the excitation laser intensity, which is based on transient shelving into a metastable dark state (inset). (Middle) Pump-probe principle with pump light inducing dark state transitions and probe light exciting fluorescence of those molecules that are left in the bright state, resulting in a sub-diffraction observation spot. (Right) GSD and confocal (upper marked areas) images of immunolabeled SNAP-25 protein clusters on a fixed cell membrane (left) and an organic dye with a high triplet intersystem crossing rate, filling up a grooved nanostructure (right). Scale bars: 500 nm. Adapted from (Bretschneider et al. Reference Bretschneider, Eggeling and Hell2007). (c) RESOLFT nanoscopy using the reversibly photoswitchable protein rsGFP. (Left) rsGFP fulfills all requirements for coordinate-targeted nanoscopy: fast photoswitching (upper panel: fluorescence signal following repetitive on-off switching (red) with comparison to the RSFP Dronpa (blue)) with low switching fatigue (lower left panel: ‘on’ fluorescence versus number of on–off switching cycle (red) and comparison to Dronpa (blue)), and a long lifetime of the ‘off’ state (lower right panel: spontaneous temporal recovery of fluorescence after off-switching with half of the fluorescence recovered after 23 min). (Right) RESOLFT and confocal (lower or upper left corner) of an Escherichia coli bacterium expressing rsGFP–MreB (left) and a live mammalian cell expressing keratin-19–rsGFP (right). Scale bar: 1 μm. Adapted from (Grotjohann et al. Reference Grotjohann, Testa, Leutenegger, Bock, Urban, Lavoie-Cardinal, Willig, Eggeling, Jakobs and Hell2011). (d) RESOLFT nanoscopy with more than hundred-thousand doughnuts. (Left) By overlapping the diffraction pattern generated by two perpendicularly arranged gratings, an illumination pattern of the switch-off light is generated, which features a large number of intensity zeros (PBS: polarization beam-splitter, Obj: objective lens) and which results in multiple simultaneous scanning points, whose dimension decreases with increasing intensity of the switch-off light (middle). (Right) Conventional (left part) and RESOLFT (right part) wide-field images of keratin 19–rsEGFP(N205S) in live mammalian cells (scale bar: 1 μm, adapted from (Chmyrov et al. Reference Chmyrov, Keller, Grotjohann, Ratz, D'Este, Jakobs, Eggeling and Hell2013)).
2.2.1 STED: stimulated emission
STED requires rather large laser intensities in order to induce de-excitation from S 1 more efficiently than the spontaneous decay (usually around 2–4 ns). Therefore, the threshold or saturation intensities required to inhibit half of the fluorescence are in the range of I S = 1–10 MW/cm2 (Fig. 10a). As mentioned in Section 2.1.6, a preferred implementation of STED is the use of pulsed lasers supplying high peak intensities. This STED modality provides an exponential, i.e. a very steep, dependence of the fluorescence inhibition on the STED laser, realizing a very sharp confinement of fluorescence emission (Harke et al. Reference Harke, Keller, Ullal, Westphal, Schoenle and Hell2008a; Hell, Reference Hell2009b). Inhibition of fluorescence by stimulated emission can be realized with basically any fluorophore. The spatial resolution of the STED concept is in principle limited only by the size of the quantum system to be imaged, i.e. by the molecule. (Section 2.3).
2.2.2 GSD: transient dark state shelving
GSD imaging was the second far-field nanoscopy concept concretely laid out (Hell & Kroug, Reference Hell and Kroug1995). In GSD, inhibition of fluorescence emission is realized by transiently shelving the fluorophore in a metastable dark state such as the triplet (Kasha, Reference Kasha1950) or other dark (redox) states populated therefrom (e.g. Vogelsang et al. Reference Vogelsang, Kasper, Steinhauer, Person, Heilemann, Sauer and Tinnefeld2008; Zondervan et al. Reference Zondervan, Kulzer, Orlinskii and Orrit2003). Since the lifetime of the involved dark states is usually much longer (μs to s) than that of the S 1 (ns), GSD allows using much lower intensities than STED, in the range of 100–300 kW/cm2 (Fig. 10b) (Bretschneider et al. Reference Bretschneider, Eggeling and Hell2007; Hell & Kroug, Reference Hell and Kroug1995). Since both dark state shelving and fluorescence excitation occur via S 1, i.e. most efficiently by the same laser line, a pump-probe scheme has been introduced in the experimental realization of GSD nanoscopy (Bretschneider et al. Reference Bretschneider, Eggeling and Hell2007). Here, the pump beam is arranged with one or several zero intensity points (such as the doughnut-shaped intensity distribution) and essentially prepares the observation area by restricting molecules that are left in the bright S 0–S 1 system to sub-diffraction sized volumes. A subsequent conventional, diffraction-limited fluorescence excitation beam probes these residual bright molecules. Super-resolution images are again realized by scanning the resulting nanoscopic observation spot over the sample, as depicted for immunolabeled SNAP-25 protein clusters on a cell membrane in Fig. 10b. The silenced fluorophores have to return to the S 0–S 1 system before each scanning step, which puts a lower limit on the image acquisition time (e.g. pixel dwell times of 60 ms in Fig. 10b). The implementation of the GSD concept is further challenged by the increased involvement of the dark states in photobleaching. Therefore, the experimental realization of GSD had to discover conditions for which (1) the dark state lifetime is within a reasonable range (1–100 ms) to minimize laser intensity for optical pumping but also to reduce pixel dwell and thus image acquisition times, and (2) photobleaching is low enough to allow a reasonable number of pump-probe cycles per fluorophore (Bretschneider et al. Reference Bretschneider, Eggeling and Hell2007). This has, for example, been realized using special mounting media (Bretschneider et al. Reference Bretschneider, Eggeling and Hell2007) or nitrogen temperatures (Schwentker, Reference Schwentker2007) increasing both the dark state lifetime as well as the photostability. On the other hand, it was shown that the addition of UV or IR light after probing may shorten the return time to the S 0–S 1 system by reverse dark state/intersystem crossing (Giske, Reference Giske2007; Ringemann et al. Reference Ringemann, Schönle, Giske, Von Middendorff, Hell and Eggeling2008), introducing an additional degree of freedom for the optimization of GSD data acquisition (Schwentker, Reference Schwentker2007). A large list of fluorophores was introduced as potential labels for GSD nanoscopy (Bretschneider et al. Reference Bretschneider, Eggeling and Hell2007). Recently, GSD was realized with NV centers in diamond, featuring down to 12 nm spatial resolution (compare Fig. 11b) (Han et al. Reference Han, Kim, Eggeling and Hell2010). GSD nanoscopy will benefit from the exploration of fluorophores and mounting or buffer conditions which realize large and controllable dark-state populations (Kolmakov et al. Reference Kolmakov, Belov, Bierwagen, Ringemann, Mueller, Eggeling and Hell2010a; Vogelsang et al. Reference Vogelsang, Kasper, Steinhauer, Person, Heilemann, Sauer and Tinnefeld2008). For example, special redox buffers have allowed the controlled and efficient photoswitching of conventional organic dyes by promoting the population of their dark states as well as their photostability (Vogelsang et al. Reference Vogelsang, Kasper, Steinhauer, Person, Heilemann, Sauer and Tinnefeld2008). Figure 10b on the other hand depicts GSD imaging in aqueous environment, where fluorophores usually exhibit dark state lifetimes in the range of μs. The image has been recorded with an organic dye which is characterized by a high intersystem crossing rate, i.e. a high triplet state yield (Chmyrov et al. Reference Chmyrov, Arden-Jacob, Zilles, Drexhage and Widengren2008) and using somewhat larger laser intensities (Bretschneider et al. Reference Bretschneider, Eggeling and Hell2007). The use of dark states that are normally involved in bleaching pathways has however so far hampered the practicability of GSD for (live-) cell nanoscopy.
The resolution of coordinate-targeted nanoscopy is in principle limited only by the size of the quantum system (molecule or emitter) to be distinguished: imaging nitrogen-vacancy (NV) centers in diamond. (a) STED imaging of NV centers. (Upper left) NV centers (inset: molecular structure) are a nearly perfect switch: fluorescence inhibition versus STED laser intensity. (Upper middle) STED images of single isolated NV centers in bulk diamond (inset: scanning image, with confocal counterpart in the upper left corner) reveal down to 6 nm spatial resolution (or diameters of the observation area) with increasing STED laser intensity. Scale bar: 100 nm. (Upper right) Scanning image of a single isolated NV center (fast axis along y) with STED laser switched on only in the marked area, exemplifying the vast increase in spatial resolution from confocal 225 nm down to 8 nm. Scale bar: 100 nm. (Lower left) Repetitive STED images of single isolated NV centers in diamond (frame number in the upper right corner), showing the ultimate stability of these emitters. Scale bar: 200 nm. (Lower right) Confocal (left) and STED (right) images of 35 nm large NV-containing nanodiamonds. Scale bar: 100 nm. Adapted from (Han et al. Reference Han, Willig, Rittweger, Jelezko, Eggeling and Hell2009; Rittweger et al. Reference Rittweger, Han, Irvine, Eggeling and Hell2009a). (b, c) GSD nanoscopy of NV centers. (b) GSD by reversible laser-driven transitions into a long-lived dark state. (Upper panel) Energy level diagram of an NV center with ground 3A, excited 3E and dark states, transitions driven by red (excitation Exc and OFF-switching) and blue light (ON-switching), spontaneous fluorescence emission (Flu) and dark state return (dashed line, >100 s lifetime). (Lower panel) Spatial resolution versus power of the red laser driving the OFF transition, as determined by scanning images of isolated NV centers and respective intensity line profiles (insets, scale bar is 100 nm). Adapted from (Han et al. Reference Han, Kim, Eggeling and Hell2010). (c) GSD by saturated excitation. (Upper left panel) Energy level diagram of an NV center with 3A (OFF) and 3E (ON) states, and excitation by green light (Exc) and spontaneous fluorescence emission (Flu). (Upper right panel) Saturation of fluorescence signal: dependence of fluorescence signal of a single NV center on the power of the excitation laser. (Middle panel) Experimental setup with green 532 nm excitation laser, phase plate (PM) generating the doughnut-shaped intensity distribution (inset), dichroic mirror (DC), fluorescence signal (orange), and detector (Det). (Lower panels) Scanning images of a single NV center for increasing intensity of the excitation laser (left to right), depicting the confinement of the area in which no fluorescence is elicited. Adapted from (Rittweger et al. Reference Rittweger, Wildanger and Hell2009b). Scale bar: 50 nm.
2.2.3 SPEM/SSIM: GSD via saturated excitation
Saturated Patterned Excitation Microscopy (SPEM) (Heintzmann et al. Reference Heintzmann, Jovin and Cremer2002) or Saturated Structured Illumination Microscopy (SSIM) (Gustafsson, Reference Gustafsson2005) also depletes the ground state, as in GSD. It differs from GSD (or STED) in that it confines the dark state S 0 rather than the emitting state S 1, thus creating sub-diffraction sized dark regions that are surrounded by bright areas. Scanning of such spots consequently produces ‘negative data’ and the final ‘positive’ images have to be reconstructed computationally (Gustafsson, Reference Gustafsson2005). The intensities necessary to create dark regions of sub-diffraction sized extent, i.e. to efficiently deplete S 0 and saturate the population of S 1 are of similar magnitude as in the STED concept, because both rely on the same states. Introduced theoretically a decade ago and also promising in principle molecular resolution (Heintzmann et al. Reference Heintzmann, Jovin and Cremer2002), SPEM/SSIM has so far experimentally been realized once with fluorescent beads, displaying a lateral resolution of 50 nm (Gustafsson, Reference Gustafsson2005). The limitations of this technique result from the use of very large excitation intensities, which cause enhanced photobleaching from higher excited (dark) states, as well as an optically induced depopulation of dark states, which prevents saturation of the S 1 (Giske, Reference Giske2007; Ringemann et al. Reference Ringemann, Schönle, Giske, Von Middendorff, Hell and Eggeling2008; Schwentker, Reference Schwentker2007). The aforementioned SPEM/SSIM experiment therefore implemented a D-/T-Rex-like illumination scheme, avoiding significant populations of long-lived dark states using a 5 kHz laser for excitation (Gustafsson, Reference Gustafsson2005). In other work, saturated excitation of ultra-stable NV centers in diamond yielded single-spot scanning GSD images with a spatial resolution of <10 nm (compare Fig. 11c) (Han et al. Reference Han, Wildanger, Rittweger, Meijer, Pezzagna, Hell and Eggeling2012; Rittweger et al. Reference Rittweger, Wildanger and Hell2009b).
2.2.4 RESOLFT: reversible photoswitchable labels
All of the above approaches may be summarized under a general name, RESOLFT nanoscopy (Hell, Reference Hell2004; Hell et al. Reference Hell, Jakobs and Kastrup2003, Reference Hell, Dyba and Jakobs2004). The realization of STED or GSD led to the consideration of molecular switches between states of very long lifetimes (even longer than the metastable dark states introduced in the GSD concept). The advantage is obvious: the utilization of states with very long lifetimes τ (or even the elimination of spontaneous transitions) would allow applying very low laser intensities for driving a fluorophore to a certain state (Hell et al. Reference Hell, Jakobs and Kastrup2003). Reversible photoswitching between states with very long τ can be realized through changes in molecular conformations. A prominent example is photoinduced cis–trans isomerization involving fluorescent and dark (or non-detectable) isomeric counterparts, which can be switched back and forth by light of different wavelengths. Cis–trans isomerization is for example known for cyanine dyes. The lifetime of these states for cyanines is however τ < μs in aqueous solution (Widengren & Schwille, Reference Widengren and Schwille2000), impeding the move to very low intensities. Isomeric states may be stabilized (and τ prolonged) for other molecules such as reversible switchable fluorescent proteins (RSFPs) or spiro-compounds, and/or by fixation in rigid environments (Ando et al. Reference Ando, Mizuno and Miyawaki2004; Bossi et al. Reference Bossi, Foelling, Dyba, Westphal and Hell2006; Dickson et al. Reference Dickson, Cubitt, Tsien and Moerner1997; Feringa, Reference Feringa2001; Irie et al. Reference Irie, Fukaminato, Sasaki, Tamai and Kawai2002; Lukyanov et al. Reference Lukyanov, Fradkov, Gurskaya, Matz, Labas, Savitsky, Markelov, Zaraisky, Zhao, Fang, Tan and Lukyanov2000; Sakata et al. Reference Sakata, Yan and Marriot2005). In RSFPs the differently isomerized states are usually stabilized by the protein barrel surrounding the chromophore (and often involve differently protonated states) (Andresen et al. Reference Andresen, Wahl, Stiel, Grater, Schafer, Trowitzsch, Weber, Eggeling, Grubmuller, Hell and Jakobs2005, Reference Andresen, Stiel, Trowitzsch, Weber, Eggeling, Wahl, Hell and Jakobs2007; Habuchi et al. Reference Habuchi, Dedecker, Hotta, Flors, Ando, Mizuno, Miyawaki and Hofkens2006; Wilmann et al. Reference Wilmann, Petersen, Devenish, Prescott and Rossjohn2005). It was therefore an RSFP, asFP595 (Lukyanov et al. Reference Lukyanov, Fradkov, Gurskaya, Matz, Labas, Savitsky, Markelov, Zaraisky, Zhao, Fang, Tan and Lukyanov2000), that was first used to experimentally prove the viability of the general RESOLFT concept in 2005 (Hofmann et al. Reference Hofmann, Eggeling, Jakobs and Hell2005). asFP595 can be reversibly switched between a dark trans and a bright cis state with light of 405–460 and 560 nm, respectively, and the thermal lifetimes of τ > ms in aqueous solution enabled for the first time the use of ultra-low intensities (<kW/cm2) for super-resolution microscopy. Similar sub-diffraction images were realized when using other RSFPs such as Dronpa (Ando et al. Reference Ando, Mizuno and Miyawaki2004; Bock, Reference Bock2008; Dedecker et al. Reference Dedecker, Hotta, Flors, Sliwa, Uji-I, Roeffaers, Ando, Mizuno, Miyawaki and Hofkens2007; Hofmann, Reference Hofmann2007), or when switching between an open and a closed form of a photochromic organic compound of the furyl-fulgides family in a polymeric matrix (Bossi et al. Reference Bossi, Foelling, Dyba, Westphal and Hell2006). In the latter, the difference in fluorescence signal between the two forms had been realized by the photochromic compound serving as a reversible switchable energy acceptor for a fluorescent compound. Unfortunately, the uses of both asFP595 and the photochromic organic compound for cellular RESOLFT nanoscopy were limited. First of all, specific labeling with either was not feasible, since asFP595 was only present in a tetrameric form, and the organic compound could not successfully be functionalized. Furthermore, under the final imaging conditions the signal could not be switched off completely due to cross-talk between laser lines (e.g. >30% of the ON-state fluorescence in the case of asFP595), requiring computational post-processing of the recorded image (through, e.g. deconvolution) in order to fully extract the sub-diffraction image contents – a procedure which can be prone to noise and biases. In addition, the switching speed was rather slow, entailing scanning dwell times of >100 ms. Finally, and most importantly, both labels exhibited considerable switching fatigue. Therefore, deliberate screening for fast and high-contrast switching monomeric RSFPs which should hardly show spontaneous decay of the involved states and, most importantly, survive >1000 and more photoswitching cycles was performed (Stiel et al. Reference Stiel, Trowitzsch, Weber, Andresen, Eggeling, Hell, Jakobs and Wahl2007). This screen ended in a RSFP variant of GFP (rsGFP: reversible switchable GFP), and its use in RESOLFT nanoscopy realized down to 40 nm spatial resolution in live-cell imaging (Grotjohann et al. Reference Grotjohann, Testa, Leutenegger, Bock, Urban, Lavoie-Cardinal, Willig, Eggeling, Jakobs and Hell2011). Similarly, the RSFP Dreiklang was created and applied to RESOLFT imaging, where suitable wavelengths for on and off switching and fluorescence excitation were completely disentangled, minimizing any action cross-talk (Brakemann et al. Reference Brakemann, Stiel, Weber, Andresen, Testa, Grotjohann, Leutenegger, Plessmann, Urlaub, Eggeling, Wahl, Hell and Jakobs2011). Applying laser intensities of only 1 kW/cm2, the RESOLFT concept applying RSFPs is highly suited for live-cell applications. RESOLFT nanoscopy has in the meantime enabled the recording of live-cell dynamics even in 3D (Testa et al. Reference Testa, Urban, Jakobs, Eggeling, Willig and Hell2012). Further improvements have come with the development of RSFPs with faster photoswitching times and decreased switching fatigue (Grotjohann et al. Reference Grotjohann, Testa, Reuss, Brakemann, Eggeling, Hell and Jakobs2012), as well as with additional emission wavelength ranges (Stiel et al. Reference Stiel, Andresen, Bock, Hilbert, Schilde, Schönle, Eggeling, Egner, Hell and Jakobs2008) for multi-color observations. Phototoxic effects of the (often UV) photoswitching light may be avoided by the use of IR light in a two-photon mode (Denk, Reference Denk1996).
2.2.5 Parallelization
The image acquisition in coordinate-targeted nanoscopy can be accelerated significantly by employing multiple observation spots simultaneously. As already outlined in Section 2.1.6, this has been realized in STED nanoscopy with four parallel scanning spots using Wollaston prisms (Bingen et al. Reference Bingen, Reuss, Engelhardt and Hell2011), or 100 or even 2000 parallel spots using optical standing wave patterns (Yang et al. Reference Yang, Przybilla, Mestre, Trebbia and Lounis2014; Bergermann et al. Reference Bergermann, Alber, Sahl, Engelhardt and Hell2015). Unfortunately, the laser intensities required for STED are still too high to allow further parallelization with currently available laser powers. The required average laser intensities in GSD – 105-fold lower compared to STED – allowed the use of larger numbers of intensity zeros in parallel (Schwentker, Reference Schwentker2007). SSIM has so far been experimentally shown with structured illumination, i.e. with a multitude of zero-intensity lines (Gustafsson, Reference Gustafsson2005). The high laser intensities were delivered by a laser with large transient pulse peak powers but very low repetition rate, which again slows down the image acquisition process and makes live-cell imaging less feasible. This restriction has been lifted by employing RSFPs: the ultra-low intensities required for the RESOLFT concept allowed scanning with several intensity zeros and thus several sub-diffraction sized observation areas in parallel for live-cell nanoscopy (Rego et al. Reference Rego, Shao, Macklin, Winoto, Johansson, Kamps-Hughes, Davidson and Gustafsson2012; Schwentker et al. Reference Schwentker, Bock, Hofmann, Jakobs, Bewersdorf, Eggeling and Hell2007). The combination of RESOLFT and structured illumination therefore promises <50–60 nm with sub-second image acquisition times of >50 × 50 μm2 fields of view (Rego et al. Reference Rego, Shao, Macklin, Winoto, Johansson, Kamps-Hughes, Davidson and Gustafsson2012). A more advanced illumination pattern than using parallel lines of high intensities as in conventional SIM is the scanning with thousands of parallelized points as in spinning-disc microscopy (McCabe et al. Reference Mccabe, Fewer, Ottewill, Hewlett and Hegarty1996) or in multifocal SIM (York et al. Reference York, Parekh, Nogare, Fischer, Temprine, Mione, Chitnis, Combs and Shroff2012). Similarly, more than 100 000 doughnuts were generated simultaneously for ultra-fast live-cell RESOLFT imaging of large fields of view with down to 70 nm spatial resolution (Chmyrov et al. Reference Chmyrov, Keller, Grotjohann, Ratz, D'Este, Jakobs, Eggeling and Hell2013) (Fig. 10d). With the development of further optimized photoswitchers, RESOLFT is therefore a very promising tool for revolutionizing live-cell optical nanoscopy.
2.2.6 Nanoscale writing
Concurrently to the imaging of various nanostructures, the RESOLFT concept was extended to the writing of structures with sub-diffraction size and spacing using visible light. Proposed in the early times (Hell, Reference Hell2004), writing of nanostructures based on the STED and RESOLFT concept has been experimentally realized using photochromic materials (Andrew et al. Reference Andrew, Tsai and Menon2009; Fischer et al. Reference Fischer, Freymann and Wegener2010; Harke et al. Reference Harke, Bianchini, Brandi and Diaspro2012; Li et al. Reference Li, Gattass, Gershgoren, Hwang and Fourkas2009a; Scott et al. Reference Scott, Kowalski, Sullivan, Bowman and Mcleod2009; Wiesbauer et al. Reference Wiesbauer, Wollhofen, Vasic, Schilcher, Jacak and Klar2013; Wollhofen et al. Reference Wollhofen, Katzmann, Hrelescu, Jacak and Klar2013) or RSFPs (Grotjohann et al. Reference Grotjohann, Testa, Leutenegger, Bock, Urban, Lavoie-Cardinal, Willig, Eggeling, Jakobs and Hell2011). Analogously to imaging sub-diffraction features, an intensity distribution of a photoswitching laser exhibiting one or several intensity zeros is used to maintain molecules in a reactive ON-state (i.e. in a writable state that, in contrast to the OFF-state, can be transferred to a permanent state) only at the sub-diffraction spots defined by the zeros. Scanning then realizes writing of nanostructures. RESOLFT has thus evolved to a versatile concept to reach the nanoscale in far-field optical applications.
2.3 Ultimate limit
The spatial resolution of all of the above approaches scales inversely with the square root of the intensity of the laser light featuring the intensity zero(s) (Harke et al. Reference Harke, Keller, Ullal, Westphal, Schoenle and Hell2008a; Hell, Reference Hell2004; Hell et al. Reference Hell, Jakobs and Kastrup2003). Therefore, driving up the intensity should entail observation spots going down to the size of a single emitter. Several test samples containing different fluorophores have been chosen to prove this. For example, STED on the organic dye JA26 in a polyvinyl-alcohol (PVA) matrix could for the first time experimentally prove the square-root law down to a spatial resolution of 16 nm along one lateral dimension (Westphal & Hell, Reference Westphal and Hell2005). T-Rex STED nanoscopy of protein assemblies in cells provided spatial resolution down to 20 nm along all lateral directions (Donnert et al. Reference Donnert, Keller, Medda, Andrei, Rizzoli, Lurmann, Jahn, Eggeling and Hell2006). The square-root dependence and spatial resolutions of <20–30 nm were also demonstrated for STED measurements on fluorescent beads or single fluorescent molecules under special photostabilizing buffer conditions (reducing and oxidizing system (ROXS) buffer) (Harke et al. Reference Harke, Keller, Ullal, Westphal, Schoenle and Hell2008a; Kasper et al. Reference Kasper, Harke, Forthmann, Tinnefeld, Hell and Sauer2010). Going beyond this, RESOLFT imaging was applied to NV centers in diamond (Han et al. Reference Han, Willig, Rittweger, Jelezko, Eggeling and Hell2009, Reference Han, Kim, Eggeling and Hell2010; Rittweger et al. Reference Rittweger, Han, Irvine, Eggeling and Hell2009a, Reference Rittweger, Wildanger and Hell2009b). These fluorescent color centers are extremely photostable, and were imaged by STED nanoscopy as well using very high laser intensities, exemplifying a nearly perfect switch in fluorescence emission. These experiments once again proved the square-root intensity dependence with spatial resolutions down to 6 nm (Fig. 11a), only limited by the insufficient stability of the microscope stage. The use of a solid-immersion lens has recently enabled imaging of single NV centers with a spatial resolution of below 3 nm (Wildanger et al. Reference Wildanger, Patton, Schill, Marseglia, Hadden, Knauer, Schönle, Rarity, O'Brien, Hell and Smith2012). The NV centers could be imaged multiple times without any sign of photobleaching (Fig. 11a). With fluorescence lifetimes >10 ns, these fluorescent centers perform almost equally well in the pulsed or CW STED mode (Han et al. Reference Han, Willig, Rittweger, Jelezko, Eggeling and Hell2009), with further improvements realized through gated detection (Vicidomini et al. Reference Vicidomini, Moneron, Han, Westphal, Ta, Reuss, Engelhardt, Eggeling and Hell2011). 20–35 nm large ‘nanodiamonds’ containing one or more NV centers could be imaged equally well (Fig. 11a) (Han et al. Reference Han, Willig, Rittweger, Jelezko, Eggeling and Hell2009; Vicidomini et al. Reference Vicidomini, Moneron, Han, Westphal, Ta, Reuss, Engelhardt, Eggeling and Hell2011), and progress in their size reduction down to 5 nm (Smith et al. Reference Smith, Inglis, Sandnes, Rabeau, Zvyagin, Gruber, Noble, Vogel, Osawa and Plakhotnik2009) and functionalization (Fu et al. Reference Fu, Lee, Chen, Lim, Wu, Lin, Wei, Tsao, Chang and Fann2007; Krueger, Reference Krueger2008) aims at their applicability in cellular nanoscopy (Tzeng et al. Reference Tzeng, Faklaris, Chang, Kuo, Hsu and Chang2011). Apart from cellular imaging, STED nanoscopy has allowed the optical detection of electron spin resonances from single NV centers in diamond located at sub-diffraction proximities (Wildanger et al. Reference Wildanger, Maze and Hell2011), which is an important development for diverse areas of research such as quantum computation or magnetic resonance imaging (Balasubramanian et al. Reference Balasubramanian, Chan, Kolesov, Al-Hmoud, Tisler, Shin, Kim, Wojcik, Hemmer, Krueger, Hanke, Leitenstorfer, Bratschitsch, Jelezko and Wrachtrup2008; Jelezko & Wrachtrup, Reference Jelezko and Wrachtrup2006; Maze et al. Reference Maze, Stanwix, Hodges, Hong, Taylor, Cappellaro, Jiang, Dutt, Togan, Zibrov, Yacoby, Walsworth and Lukin2008).
The NV centers also exhibit dark states, transitions to which can specifically be addressed by light of different wavelengths: while red light (>600 nm) ‘dumps’ the NV centers into a >100 s long dark state, blue light efficiently depopulates this state (Han et al. Reference Han, Kim, Eggeling and Hell2010, Reference Han, Wildanger, Rittweger, Meijer, Pezzagna, Hell and Eggeling2012). Therefore, NV centers are also perfect candidates for GSD nanoscopy. Using this switching mechanism, the square-root law could be ascertained for the GSD approach with down to 12 nm spatial resolution (Fig. 11b), again limited by the stability of the microscope table and signal-to-noise (Han et al. Reference Han, Kim, Eggeling and Hell2010). The NV centers’ ground state could be equally well inhibited, and emission of the fluorescence saturated, by simply raising the excitation intensity (Fig. 11c). Shaping the focal intensity distribution of the excitation laser in a way to present a local intensity zero (such as for the doughnut-shaped intensity distribution) and driving up its intensity consequently creates sub-diffraction sized dark holes, as presented above for the GSD-based SPEM/SSIM approaches (Section 2.2.3). Scanning of these dark spots over the sample and subsequent computations created images of single isolated NV centers in diamond with down to <10 nm spatial resolution, proving the square-root dependence also for this approach (Han et al. Reference Han, Wildanger, Rittweger, Meijer, Pezzagna, Hell and Eggeling2012; Rittweger et al. Reference Rittweger, Wildanger and Hell2009b). Furthermore, optical nanoscopy of NVs was achieved by combining spin manipulation and optical read-out, allowing individual electronic spins to be detected, imaged and manipulated coherently with nanoscale resolution (Maurer et al. Reference Maurer, Maze, Stanwix, Jiang, Gorshkov, Zibrov, Harke, Hodges, Zibrov, Yacoby, Twitchen, Hell, Walsworth and Lukin2010).
3. The coordinate-stochastic approach
3.1 Basics: (F)PALM/STORM
The challenges posed by repeated cycling between molecular states for the coordinate-targeted STED/RESOLFT approaches are alleviated when transferring individual molecules between different states stochastically in space. For example, molecules that are initially OFF may be individually driven to their ON-state at unknown spatial coordinates. The molecules’ coordinates can be determined with sub-diffraction precision from their images on a camera. While the image of a single molecule is again blurred by diffraction, the molecular position can be determined by calculating the centroid of the blurred image spot (Bobroff, Reference Bobroff1986; Heisenberg, Reference Heisenberg1930). Restrictions are: (1) only single isolated molecules further apart than the distance given by diffraction can be imaged at a time to avoid any bias in localization of molecular positions from overlapping (blurred) spots, and (2) molecules, once in their ON-state, have to emit a sufficient number of photons N, since the localization precision scales with the inverse square root of N (Thompson et al. Reference Thompson, Larson and Webb2002). It is however important to realize that localization per se cannot provide super-resolution, i.e. finding a position of an object with arbitrary precision is not the same as resolution. Resolution is about separating similar objects at small distances. This is why, although it had routinely been applied for decades, specifically for spatiotemporal tracking of single isolated particles or molecules, localization on its own did not provide nanoscale images. Resolution requires a criterion to discern neighboring molecules such as realized by driving molecular transitions between different states (Hell, Reference Hell2009b; Hell & Kroug, Reference Hell and Kroug1995; Hell & Wichmann, Reference Hell and Wichmann1994). Therefore, an approach first suggested as (F)PALM (Betzig et al. Reference Betzig, Patterson, Sougrat, Lindwasser, Olenych, Bonifacino, Davidson, Lippincott-Schwartz and Hess2006; Hess et al. Reference Hess, Girirajan and Mason2006) or STORM (Rust et al. Reference Rust, Bates and Zhuang2006) assembles a super-resolved image by determining spatial positions molecule by molecule using molecular transitions: (1) only a few isolated molecules are stochastically transferred (or activated) into their ON-state at once; (2) these molecules are imaged onto a camera and their spatial coordinates are determined through localization and saved; (3) molecules are transferred into an OFF-state; (4) stochastic activation of another subset of isolated molecules allows the read-out of neighboring molecules; and (5) repetition of this cycle realizes the reconstruction of an image with sub-diffraction resolution from the spatial coordinates of all imaged molecules (Fig. 12a). Similar to upgrading conventional confocal scanning or SIM systems for RESOLFT-type nanoscopy, the setup for this stochastic-switching based nanoscopy concept is a simple expansion of a conventional camera-equipped wide-field or TIRF microscope, updated by a stronger excitation laser and/or a second laser for controlling the switching of molecules (Fig. 12b, where an implementation with two separate detection channels is shown).
Coordinate-stochastic (single-marker/single-molecule switching-based) nanoscopy ((F)PALM/STORM). (a) Images with sub-diffraction spatial resolution are reconstructed from consecutive camera frames with simultaneous imaging and position-localization of single isolated (sparse) molecules only, which are switched on and off one after the other. (b) The setup is typically based on a conventional wide-field (TIRF) microscope with an excitation laser and, if required, an additional switching (or activation) laser, a microscope objective, dichroic mirrors (DC) for overlaying the lasers, de-coupling the fluorescence signal from the laser light and if required splitting up the fluorescence signal into two different wavelength ranges, fluorescence filters (here F1 and F2) for rejecting any residual laser scattering light and selecting the detected wavelength range, and a CCD camera detecting the fluorescence potentially in two channels (Ch. 1 and Ch. 2). (c–f) Various modes of (F)PALM/STORM-based nanoscopy differing in the labels and molecular transitions: (c) the original (F)PALM approach using photoactivatable proteins that are initially dark or non-detectable, sparsely switched on by, for example, UV light and switched off by photobleaching. (d) The original STORM approach: Organic dyes such as Cy5 (or also fluorescent proteins) can be switched on and off by laser light of the same or different color or by spontaneous recovery (τ), with on- and off-switching potentially assisted by an additional activator dye such as Cy3 and by photobleaching, respectively. (e) Single-cycle switching using photoactivatable organic dyes that are initially dark or non-detectable, sparsely switched on by UV light and switched off by photobleaching or rarely by a spontaneous dark state return (τ). (f) Multiple-cycle switching using RSFPs that can be switched between a dark and bright isomer using the excitation and UV light (or spontaneous transitions (τ) and photobleaching). (g) Example PALM/STORM image of a tubulin network in a fixed PtK2 cell stained with a photoactivatable rhodamine (sub-diffraction (left) and diffraction-limited (right) counterparts, scale bar: 2 μm, adapted from (Fölling et al. Reference Fölling, Belov, Kunetsky, Medda, Schönle, Egner, Eggeling, Bossi and Hell2007)). (h) Example STORM image of Alexa647-immunolabeled actin in a fixed COS-7 cell (scale bar: 2 μm, adapted from (Xu et al. Reference Xu, Babcock and Zhuang2012)).
3.2 Molecular transitions
Various ways of preparing molecular states with different fluorescence properties such as an ON- and an OFF-state have been suggested and implemented for this coordinate-stochastic nanoscopy. The strategy of combining stochastic molecular switching with localization was first used in methods called single-molecule high-resolution imaging with photobleaching (SHRImP) (Gordon et al. Reference Gordon, Ha and Selvin2004) and nanometer-localized multiple single-molecule (NALMS) (Qu et al. Reference Qu, Wu, Mets and Scherer2004) imaging, in which the position of a small number of bright regular fluorophores was mapped by bleaching them (i.e. switching them off) consecutively, individually and stochastically. However, these methods start out from many bright molecules and hence from a bright total signal. They can therefore, in contrast to (F)PALM/STORM, accommodate only a small number of fluorophores. Similarly, the molecule-specific temporal characteristics of the blinking of nearby quantum-dots as recorded over consecutive camera frames were enough to separate two nearby emitters (Lidke et al. Reference Lidke, Rieger, Jovin and Heintzmann2005), but it remains to be shown how many close-by emitters can be distinguished using the presented algorithms.
The original (F)PALM experiments employed photoactivatable fluorescent proteins (Patterson & Lippincott-Schwartz, Reference Patterson and Lippincott-Schwartz2002), with the switch-on and -off accomplished using dedicated laser light and irreversible photobleaching, respectively (Fig. 12c) (Betzig et al. Reference Betzig, Patterson, Sougrat, Lindwasser, Olenych, Bonifacino, Davidson, Lippincott-Schwartz and Hess2006; Hess et al. Reference Hess, Girirajan and Mason2006). Similarly, photoactivatable organic dyes can be used (Fig. 12e) (Fölling et al. Reference Fölling, Belov, Kunetsky, Medda, Schönle, Egner, Eggeling, Bossi and Hell2007, Reference Fölling, Belov, Riedel, Schönle, Egner, Eggeling, Bossi and Hell2008a). This unfortunately comes at the expense of not being able to record a molecule several times, i.e. to acquire structural changes in the specimen over time. The original STORM experiments applied reversible photoswitchable organic fluorophores such as cyanines (Fig. 12d) (Rust et al. Reference Rust, Bates and Zhuang2006): under certain buffer conditions they can be transferred between a bright ON- and a dark OFF-state using red and green light, mediated by nearby activator fluorophores (Bates et al. Reference Bates, Blosser and Zhuang2005). Photoswitching in cyanines and other organic dyes may also be accomplished by other molecular transitions such as via the transient population of metastable dark states including the dyes’ triplet states or redox states populated therefrom (Bock et al. Reference Bock, Geisler, Wurm, Von Middendorff, Jakobs, Schönle, Egner, Hell and Eggeling2007; Heilemann et al. Reference Heilemann, Van De Linde, Schuttpelz, Kasper, Seefeldt, Mukherjee, Tinnefeld and Sauer2008; Hu et al. Reference Hu, Tian, Wu, Wan and Li2008; Rust et al. Reference Rust, Bates and Zhuang2006; Steinhauer et al. Reference Steinhauer, Forthmann, Vogelsang and Tinnefeld2008; van de Linde et al. Reference Van De Linde, Kasper, Heilemann and Sauer2008). Similarly, RSFPs may be employed (Fig. 12f) (Dickson et al. Reference Dickson, Cubitt, Tsien and Moerner1997; Egner et al. Reference Egner, Geisler, Von Middendorff, Bock, Wenzel, Medda, Andresen, Stiel, Jakobs, Eggeling, Schoenle and Hell2007; Geisler et al. Reference Geisler, Schoenle, Von Middendorff, Bock, Eggeling, Egner and Hell2007). Harnessing reversible molecular transitions allows the recording of a molecule's position several times, i.e. to acquire a sequence of super-resolution images (Endesfelder et al. Reference Endesfelder, Van De Linde, Wolter, Sauer and Heilemann2010; Jones et al. Reference Jones, Shim, He and Zhuang2011; Shroff et al. Reference Shroff, Galbraith, Galbraith and Betzig2008; Stiel et al. Reference Stiel, Andresen, Bock, Hilbert, Schilde, Schönle, Eggeling, Egner, Hell and Jakobs2008). Beside fluorescent proteins and organic dyes, (F)PALM/STORM-like recordings were realized with other emitters such as luminescent single-walled carbon nanotubes (Cognet et al. Reference Cognet, Tsyboulski and Weisman2008) or QDs (Hoyer et al. Reference Hoyer, Staudt, Engelhardt and Hell2010; Lagerholm et al. Reference Lagerholm, Averett, Weinreb, Jacobson and Thompson2006).
3.3 Continuous recording
The use of reversible molecular transitions led to the idea to continuously (and still stochastically) drive molecules between a bright and a dark state. Modalities termed ‘PALM with independently running acquisition’ (PALMIRA) (Egner et al. Reference Egner, Geisler, Von Middendorff, Bock, Wenzel, Medda, Andresen, Stiel, Jakobs, Eggeling, Schoenle and Hell2007; Geisler et al. Reference Geisler, Schoenle, Von Middendorff, Bock, Eggeling, Egner and Hell2007) and ‘ground state depletion followed by individual molecule return’ (GSDIM) (Fölling et al. Reference Fölling, Bossi, Bock, Medda, Wurm, Hein, Jakobs, Eggeling and Hell2008b) apply no activation or switch-on beam, and isolated fluorophores are allowed to blink stochastically and subsequently in time (not only in space) (Fig. 13a) (Fölling et al. Reference Fölling, Bossi, Bock, Medda, Wurm, Hein, Jakobs, Eggeling and Hell2008b; Hell, Reference Hell2007). A single CW laser beam is used to generate the N photons and to switch the fluorophores off by transferring them into dark states. Dark state return is either promoted by switching cross-talk of the laser or by a spontaneous decay. The camera is run freely and the laser intensity and frame rate adjusted such that the average duration of the N-photon burst coincides with the duration of a camera frame. These purely stochastic concepts probably are the simplest far-field nanoscopy systems at present, because they require just uniform laser illumination, a freely running camera, and appropriate software. A straightforward advantage of such an acquisition mode is that it allows the use of conventional fluorophores such as many organic dyes or fluorescent proteins. Starting with STORM (Rust et al. Reference Rust, Bates and Zhuang2006) and later GSDIM (Fölling et al. Reference Fölling, Bossi, Bock, Medda, Wurm, Hein, Jakobs, Eggeling and Hell2008b), experiments termed direct-STORM (dSTORM) (Heilemann et al. Reference Heilemann, Van De Linde, Schuttpelz, Kasper, Seefeldt, Mukherjee, Tinnefeld and Sauer2008; van de Linde et al. Reference Van De Linde, Kasper, Heilemann and Sauer2008) and Blinking Microscopy (Steinhauer et al. Reference Steinhauer, Forthmann, Vogelsang and Tinnefeld2008), or single-molecule active control microscopy (SMACM) (Biteen et al. Reference Biteen, Thompson, Tselentis, Bowman, Shapiro and Moerner2008, Reference Biteen, Thompson, Tselentis, Shapiro and Moerner2009; Sahl & Moerner, Reference Sahl and Moerner2013; Sahl et al. Reference Sahl, Weiss, Duim, Frydman and Moerner2012), spectral precision distance microscopy/spectral position determination microscopy with physically modifiable fluorochromes (SPDM/SPDMPhymod) (Lemmer et al. Reference Lemmer, Gunkel, Baddeley, Kaufmann, Urich, Weiland, Reymann, Muller, Hausmann and Cremer2008, Reference Lemmer, Gunkel, Weiland, Mueller, Baddeley, Kaufmann, Urich, Eipel, Amberger, Hausmann and Cremer2009), or reversible photobleaching microscopy (RPM) (Baddeley et al. Reference Baddeley, Jayasinghe, Cremer, Cannell and Soeller2009) adapt buffer conditions and laser intensities to tune transitions to metastable dark states such as radical states of standard labels, producing super-resolution images of conventionally labelled samples (Fig. 13b, c) or even of autofluorescent cellular structures (Bierwagen et al. Reference Bierwagen, Testa, Fölling, Wenzel, Jakobs, Eggeling and Hell2010). The return from long-lived metastable states can often be accelerated with additional UV or IR laser light, adding another parameter to optimize the acquisition of the single-molecule data (e.g. Fölling et al. Reference Fölling, Bossi, Bock, Medda, Wurm, Hein, Jakobs, Eggeling and Hell2008b). Transient stochastic on-switching may also be effected by molecular collisions or chemical reactions, where a fluorophore is only activated once interacting with other specific molecules such as single-walled carbon nanotubes (Cognet et al. Reference Cognet, Tsyboulski and Weisman2008) or chemical reaction centres as in trajectory time distribution optical microscopy (TTDOM) (Mei & Hochstrasser, Reference Mei and Hochstrasser2006), points accumulation for imaging in nanoscale topography (PAINT) (Sharonov & Hochstrasser, Reference Sharonov and Hochstrasser2006), universal PAINT (uPAINT) (Giannone et al. Reference Giannone, Hosy, Levet, Constals, Schulze, Sobolevsky, Rosconi, Gouaux, Tampe, Choquet and Cognet2010), NASCA (nanometer accuracy by stochastic chemical reactions) (Roeffaers et al. Reference Roeffaers, De Cremer, Libeert, Ameloot, Dedecker, Bons, Buckins, Martens, Sels, De Vos and Hofkens2009), or CHemically Improved Resolution for Optical Nanoscopy (CHIRON) (Schwering et al. Reference Schwering, Kiel, Kurz, Lymperopoulos, Sprodefeld, Kramer and Herten2011). We have to note that albeit a whole gamut of different notations have been introduced ((F)PALM, STORM, PALMIRA, dSTORM, GSDIM, Blinking Microscopy, SMACM, SPDM, SPDMPhymod, RPM, TTDOM, PAINT, uPAINT, NASCA, CHIRON or photoactuated unimolecular logical switching attained reconstruction (PULSAR) microscopy (Hu et al. Reference Hu, Tian, Wu, Wan and Li2008), they are all based on the same principle, namely, modulating the fluorescence emission of single molecules using molecular transitions. Differences appear only in details of the experimental design, i.e. switching mechanism, how many lasers used, camera running mode, choice of label, buffer conditions, etc.
Coordinate-stochastic single-marker/single-molecule switching: stochasticity in space and time (GSDIM, (d)STORM, …) and SOFI. (a) A fluorophore can continuously be cycled between its bright singlet (S 0 and S 1, emitting fluorescence (Flu)) and dark state (triplet T and other long-lived (μs-ms) dark states) system with a single excitation (Exc) laser, eliciting on-off blinking of fluorescence in time (as highlighted by a fluorescence time trace of a single Atto532 fluorophore in PVA, adapted from (Fölling et al. Reference Fölling, Bossi, Bock, Medda, Wurm, Hein, Jakobs, Eggeling and Hell2008b)) and space (as sketched in the lower panel for three different single molecules). (b) GSDIM/(d)STORM/… images of Rh6G-immunostained microtubules in PtK2 cells in aqueous buffer (left) and of the microtubule cytoskeleton of living PtK2 cells labeled with the fluorescent protein Citrine-Map2 (right). Upper left corner: Diffraction-limited wide-field recordings. Scale bars: 1 μm. Adapted from (Fölling et al. Reference Fölling, Bossi, Bock, Medda, Wurm, Hein, Jakobs, Eggeling and Hell2008b). (c) GSDIM/(d)STORM/… allows the use of a whole gamut of conventional organic dyes with different emission spectra as highlighted by super-resolution (lower panels) and corresponding diffraction-limited wide-field (upper panels) images of the cytoskeletal network of mammalian cells immunolabeled with eight different Alexa Fluor and Atto dyes spanning the visible wavelength range (emission maxima in upper color bar) according to the dSTORM principle (scale bar: 1 μm, adapted from (Heilemann et al. Reference Heilemann, Van De Linde, Mukherjee and Sauer2009b)). (d) Principle of SOFI imaging. SOFI is based on higher-order statistical analysis of temporal fluctuations recorded in a sequence of images. The spatial resolution increases with the order as exemplified by SOFI images of different order (as indicated) of two blinking quantum dots deposited on a cover slip (left, scale bars: 250 nm, adapted from (Dertinger et al. Reference Dertinger, Colyer, Iyer, Weiss and Enderlein2009)). (Right) Diffraction-limited wide-field (left) and SOFI (right) images of quantum-dot immunolabeled tubulin network of a 3T3 fibroblast (scale bar: 10 μm, adapted from (Dertinger et al. Reference Dertinger, Colyer, Vogel, Enderlein and Weiss2010)).
3.4 SOFI
Molecule-specific ON–OFF blinking (Lidke et al. Reference Lidke, Rieger, Jovin and Heintzmann2005) is the basis of a recent stochastic nanoscopy approach termed super-resolution optical fluctuation imaging (SOFI) (Fig. 13d) (Dertinger et al. Reference Dertinger, Colyer, Iyer, Weiss and Enderlein2009). Higher-order statistical analysis of the temporal fluctuations (recorded in a sequence of images) allows the identification of molecular positions with sub-diffraction spatial resolution. An example of such higher-order statistical analysis is the calculation of higher-order cumulants or autocorrelation functions (Dertinger et al. Reference Dertinger, Colyer, Iyer, Weiss and Enderlein2009, Reference Dertinger, Colyer, Vogel, Enderlein and Weiss2010; Geissbuehler et al. Reference Geissbuehler, Dellagiacoma and Lasser2011, Reference Geissbuehler, Bocchio, Dellagiacoma, Berclaz, Leutenegger and Lasser2012). Similarly to FCS-based analysis of diffusing molecules, SOFI does not require temporal fluctuations recorded for single isolated molecules, but can be applied to up to ten-fold larger molecular densities than conventional (F)PALM/STORM. Furthermore, autocorrelations may be used to acquire, along with the spatial coordinates, temporal molecular parameters such as dark state kinetics, which might be, for example, a read-out for local oxygen concentrations (Geissbuehler et al. Reference Geissbuehler, Bocchio, Dellagiacoma, Berclaz, Leutenegger and Lasser2012). The spatial resolution increases with the order number, and images reconstructed from up to the 4th order cumulants have been demonstrated so far (Fig. 13d) (Dedecker et al. Reference Dedecker, Moa, Dertinger and Zhang2012; Dertinger et al. Reference Dertinger, Colyer, Iyer, Weiss and Enderlein2009, Reference Dertinger, Colyer, Vogel, Enderlein and Weiss2010; Geissbuehler et al. Reference Geissbuehler, Dellagiacoma and Lasser2011, Reference Geissbuehler, Bocchio, Dellagiacoma, Berclaz, Leutenegger and Lasser2012). A face-to-face comparison to (F)PALM/STORM nanoscopy revealed ‘that localization-based super-resolution can deliver higher resolution enhancements but imposes significant constraints on the blinking behavior of the probes, which limits its applicability for live-cell imaging. SOFI, on the other hand, works more consistently over different photo-switching kinetics and also delivers information about the specific blinking statistics. Its suitability for low SNR acquisition reveals SOFI's potential as a high-speed super-resolution imaging technique’ (Geissbuehler et al. Reference Geissbuehler, Dellagiacoma and Lasser2011).
3.5 General aspects
It becomes obvious that in the coordinate-stochastic approaches there is a tradeoff between spatial resolution, image acquisition speed and error rates: the spatial resolution of the final image may be increased by selecting only single-molecule emission events with high photon count numbers, and the acquisition time may be reduced by activating more molecules per imaging cycle, however introducing errors due to the neglect of some molecular positions (and thus lower sampling of the structure) and the risks of producing overlapping images of single molecules which hide information on molecular positions (e.g. Nieuwenhuizen et al. Reference Nieuwenhuizen, Lidke, Bates, Leyton Puig, Grünwald, Stallinga and Rieger2013; Shroff et al. Reference Shroff, Galbraith, Galbraith and Betzig2008; Small, Reference Small2009). Therefore, quite a number of improvements in determining molecular positions from the isolated blurred spots of the camera frames have been promoted for (F)PALM/STORM-based nanoscopy, especially aiming at image reconstructions for more densely labeled samples, at low SNR, with improved localization precision, with increased acquisition and analysis speeds, and for different blinking/photoswitching statistics (e.g. Cox et al. Reference Cox, Rosten, Monypenny, Jovanovic-Talisman, Burnette, Lippincott-Schwartz, Jones and Heintzmann2012; Cronin et al. Reference Cronin, De Wet and Wallace2009; Endesfelder et al. Reference Endesfelder, Van De Linde, Wolter, Sauer and Heilemann2010; Hedde et al. Reference Hedde, Fuchs, Oswald, Wiedenmann and Nienhaus2009; Henriques et al. Reference Henriques, Lelek, Fornasiero, Valtorta, Zimmer and Mhlanga2010; Holden et al. Reference Holden, Uphoff and Kapanidis2011; Huang et al. Reference Huang, Schwartz, Byars and Lidke2011; Jones et al. Reference Jones, Shim, He and Zhuang2011; Larson, Reference Larson2010; Laurence & Chromy, Reference Laurence and Chromy2010; Mortensen et al. Reference Mortensen, Churchman, Spudich and Flyvbjerg2010; Nieuwenhuizen et al. Reference Nieuwenhuizen, Lidke, Bates, Leyton Puig, Grünwald, Stallinga and Rieger2013; Pertsinidis et al. Reference Pertsinidis, Zhang and Chu2010; Smith et al. Reference Smith, Joseph, Rieger and Lidke2010; Wolter et al. Reference Wolter, Schuttpelz, Tscherepanow, Van De Linde, Heilemann and Sauer2010). In addition, one should bear in mind that rather immobile molecular orientations and out-of-focus sites may potentially result in significantly biased determinations of molecular positions (e.g. Enderlein et al. Reference Enderlein, Toprak and Selvin2006; Engelhardt et al. Reference Engelhardt, Keller, Hoyer, Reuss, Staudt and Hell2011). Strategies to diagnose, mitigate and even fully correct molecular dipole orientation-related position artifacts have recently been emerging (Backer et al. Reference Backer, Backlund, Von Diezmann, Sahl and Moerner2014; Backlund et al. Reference Backlund, Lew, Backer, Sahl, Grover, Agrawal, Piestun and Moerner2012, Reference Backlund, Lew, Backer, Sahl and Moerner2014; Lew et al. Reference Lew, Backlund and Moerner2013; Lew & Moerner, Reference Lew and Moerner2014; Backer et al. Reference Backer, Backlund, Lew and Moerner2013).
3.6 3D imaging
Sectioning or 3D imaging has been implemented for coordinate-stochastic switching-based nanoscopy. Sectioning along the axial direction is provided when activating molecules via two- or multi-photon processes (Fig. 14a) (Fölling et al. Reference Fölling, Belov, Kunetsky, Medda, Schönle, Egner, Eggeling, Bossi and Hell2007, Reference Fölling, Belov, Riedel, Schönle, Egner, Eggeling, Bossi and Hell2008a; York et al. Reference York, Ghitani, Vaziri, Davidson and Shroff2011). On the other hand, most (F)PALM/STORM-based experiments have applied a TIRF illumination scheme from the very start, i.e. only planes of the sample that are within <100 nm near the microscope cover glass are selected and out-of-plane background rejected. Several different approaches have been proposed and demonstrated to supply real 3D resolution (Fig. 14b) (whether in wide-field or TIRF illumination mode), such as the introduction of astigmatism by the use of cylindrical lenses (Huang et al. Reference Huang, Wang, Bates and Zhuang2008; Mlodzianoski et al. Reference Mlodzianoski, Juette, Beane and Bewersdorf2009; York et al. Reference York, Ghitani, Vaziri, Davidson and Shroff2011) or adaptive optics (Izeddin et al. Reference Izeddin, El Beheiry, Andilla, Ciepielewski, Darzacq and Dahan2012), double-plane detection using two camera channels (Juette et al. Reference Juette, Gould, Lessard, Mlodzianoski, Nagpure, Bennett, Hess and Bewersdorf2008; Mlodzianoski et al. Reference Mlodzianoski, Juette, Beane and Bewersdorf2009), two opposing objectives in a 4Pi illumination and detection mode (Aquino et al. Reference Aquino, Schönle, Geisler, Middendorff, Wurm, Okamura, Lang, Hell and Egner2011; Shtengel et al. Reference Shtengel, Galbraith, Galbraith, Lippincott-Schwartz, Gillette, Manley, Sougrat, Waterman, Kanchanawong, Davidson, Fetter and Hess2009), a double-helix modification to the emission path of the microscope (Lee et al. Reference Lee, Sahl, Lew and Moerner2012, Reference Lee, Rai, Williams, Twieg and Moerner2014; Pavani et al. Reference Pavani, Thompson, Biteen, Lord, Liu, Twieg, Piestun and Moerner2009; Sahl & Moerner, Reference Sahl and Moerner2013), bisected pupil 3D imaging (Backer et al. Reference Backer, Backlund, Von Diezmann, Sahl and Moerner2014), an Airy-beam point spread function (Jia et al. Reference Jia, Vaughan and Zhuang2014), other novel information-optimal point spread function designs (Shechtman et al. Reference Shechtman, Sahl, Backer and Moerner2014) or a combination of two opposing objectives and astigmatism (Xu et al. Reference Xu, Babcock and Zhuang2012). A nice example of 3D STORM nanoscopy recently presented novel details of the spatial organization of actin and other cytoskeletal filaments in mammalian cells (Fig. 12h) (Xu et al. Reference Xu, Babcock and Zhuang2012) and axons (Fig. 14b) (Xu et al. Reference Xu, Zhong and Zhuang2013). Observing single-molecule fluorescence from deep inside samples such as tissue may prove itself difficult due to enhanced background signal stemming from scattered light or out-of-focus fluorescence. A remedy of this limitation may be the combination of the (F)PALM/STORM-based readout with selective-plane-illumination microscopy (SPIM) (Zanacchi et al. Reference Zanacchi, Lavagnino, Donnorso, Del Bue, Furia, Faretta and Diaspro2011) and/or the use of adaptive optics to correct for aberrations (Izeddin et al. Reference Izeddin, El Beheiry, Andilla, Ciepielewski, Darzacq and Dahan2012).
3D and multi-color imaging with coordinate-stochastic single-marker/single-molecule switching-based nanoscopy. (a) Optical sectioning and out-of-plane signal rejection achieved by two-photon on-switching or activation: Super-resolution images of lamin of a U373MG cell stained with a photoactivatable rhodamine (inset: equatorial slice as marked by the line, scale bar: 2 μm, adapted from (Fölling et al. Reference Flors, Ravarani and Dryden2007)). (b) (Left) Different approaches of 3D (F)PALM/STORM-based imaging: astigmatism using a cylindrical lens results in an elliptical distortion of the images of out-of-plane (axial z-direction) molecules, double plane imaging comparing focused and defocused camera images, 4Pi using two opposing objectives, and double-helix detection employing a ‘doubled’ detection of each single molecule where the orientation of the two lobes of intensity changes with the z-position of the molecule. (Right) Two-color STORM image of immunolabeled bII-spectrin (green) and adducin (magenta) in fixed axons reveals that actin, spectrin and adducin form a coordinated, quasi-1D lattice structure in axons (scale bar: 500 nm, adapted from (Xu et al. Reference Xu, Zhong and Zhuang2013), where 3D astigmatic imaging was also performed). (c) Two-color image of the microtubular network in a PtK2 cell stained with the reversibly photoswitchable protein rsFastLime (green) and the organic dye Cy5 (red) generated by subsequent recordings using two excitation lasers and two detection channels (upper left corner: diffraction-limited wide-field recording, scale bar: 1 μm, adapted from (Bock et al. Reference Bock, Geisler, Wurm, Von Middendorff, Jakobs, Schönle, Egner, Hell and Eggeling2007)). (d) Fast two-color 3D-STORM images of live BSC-1 cells using one activation and two excitation lasers inducing fluorescence blinking over time: Alexa 568-labeled transferrin (green) and clathrin-coated pits labeled with Alexa647 via a SNAP tag (magenta), x/y-projection of the recordings of multiple sections along z (upper panel), and different cross-sections through two objects (i, ii) indicated in the upper panel (x/y near the plasma membrane (left), x/z cutting through the middle of the invaginating pits (middle) and corresponding x/z cross-section of the clathrin channel only (right)). Scale bars: 500 nm (upper panel) and 100 nm (lower panels), adapted from (Jones et al. Reference Jones, Shim, He and Zhuang2011). (e, f) Multi-color imaging via single-molecule signatures using one continuously running laser and two detection channels. Color separation is realized by applying fluorescence labels with slightly shifted emission spectra, which emit differently into the two detection channels (lower panels: fluorescence emission spectra of the given fluorophores and (black) transmission spectrum of the applied dichroic mirror for splitting up the signal onto the two detection channels ch1 and ch2), and can be distinguished by a different ratio of photons detected in the two detection channels (upper left: two-dimensional histogram of photon pairs simultaneously registered in the two detection channels ch1 and ch2, allowing an accurate distinction of the three different fluorophores (color coded)). Super-resolution images and diffraction-limited counterparts (upper corners) of (e) Alexa488-labeled vimentin (blue), Alexa514-labeled clathrin (green), and Rhodamine 3c-labeled tubulin (red) in fixed PtK2 cells, and (f) Caveolin 1 (red) and Caveolin 2 (green) in live PtK2 cells labeled with TMR via SNAP tag and the fluorescent protein Citrine, respectively (scale bars: 2 μm, adapted from (Testa et al. Reference Testa, Wurm, Medda, Rothermel, Middendorff, Fölling, Jakobs, Hell and Eggeling2010)).
3.7 Dynamics
A limitation of stochastic single-molecule switching is the rather large total image acquisition time, since a sufficiently large number of single-molecule positions and thus camera frames (usually >10 000–100 000) have to be gathered for the reconstruction of an accurate and representative super-resolved image of a reasonably complex structure (Betzig et al. Reference Betzig, Patterson, Sougrat, Lindwasser, Olenych, Bonifacino, Davidson, Lippincott-Schwartz and Hess2006). Furthermore, the initial use of photoactivatable, i.e. only one-cycle, photoswitchable fluorophores originally impeded the recording of multiple consecutive super-resolved images. However, the advent of reversibly photoswitchable labels (Fig. 12d, f) and the aforementioned sophisticated image reconstruction algorithms have since then enabled time-lapse studies of live-cell dynamics with (F)PALM/STORM-based techniques (e.g. Dedecker et al. Reference Dedecker, Moa, Dertinger and Zhang2012; Endesfelder et al. Reference Endesfelder, Van De Linde, Wolter, Sauer and Heilemann2010; Flors et al. Reference Flors, Ravarani and Dryden2009; Hess et al. Reference Hess, Gould, Gudheti, Maas, Mills and Zimmerberg2007; Jones et al. Reference Jones, Shim, He and Zhuang2011; Shroff et al. Reference Shroff, Galbraith, Galbraith and Betzig2008; Stiel et al. Reference Stiel, Andresen, Bock, Hilbert, Schilde, Schönle, Eggeling, Egner, Hell and Jakobs2008; Testa et al. Reference Testa, Wurm, Medda, Rothermel, Middendorff, Fölling, Jakobs, Hell and Eggeling2010; Wilmes et al. Reference Wilmes, Staufenbiel, LIßE, Richter, Beutel, Busch, Hess and Piehler2012; Wombacher et al. Reference Wombacher, Heidbreder, Van De Linde, Sheetz, Heilemann, Cornish and Sauer2010). Longer observation times can thereby be achieved by using, for example, transiently binding fluorescent markers (Lukinavicius & Johnsson, Reference Lukinavicius and Johnsson2011), such as a peptide that is designed to bind reversibly to the F-actin cytoskeleton (Izeddin et al Reference Izeddin, Specht, Lelek, Darzacq, Triller, Zimmer and Dahan2011). With further optimization of the label brightness, labeling protocol, camera technology and image acquisition and reconstruction, time resolutions of down to <1 s have been anticipated for stochastic single-molecule switching-based nanoscopy techniques (Dempsey et al. Reference Dempsey, Vaughan, Chen, Bates and Zhuang2011; Huang et al. Reference Huang, Hartwich, Rivera-Molina, Lin, Duim, Long, Uchil, Myers, Baird, Mothes, Davidson, Toomre and Bewersdorf2013; Jones et al. Reference Jones, Shim, He and Zhuang2011; Ondrus et al. Reference Ondrus, Lee, Iwanaga, Parsons, Andresen, Moerner and Du Bois2012). Importantly, as well, photoswitching and continuous determination of molecular positions may be combined to perform single-molecule tracking at higher concentration of the labeled molecules (Eggeling et al. Reference Bock, Geisler, Wurm, Von Middendorff, Jakobs, Schönle, Egner, Hell and Eggeling2007; Hess et al. Reference Hess, Gould, Gudheti, Maas, Mills and Zimmerberg2007; Manley et al. Reference Manley, Gillette, Patterson, Shroff, Hess, Betzig and Lippincott-Schwartz2008).
3.8 Multi-colour recordings
Multi-color imaging is straightforward for the single-molecule-based nanoscopy techniques. The most obvious approach generates separate detection and localization of different labels by subsequently or simultaneously switching them on and off and detecting their emission at different colors using several dedicated laser lines and appropriate filtering (Fig. 14c, d) (e.g. Bates et al. Reference Bates, Huang, Dempsey and Zhuang2007; Bock et al. Reference Bock, Geisler, Wurm, Von Middendorff, Jakobs, Schönle, Egner, Hell and Eggeling2007; Klein et al. Reference Klein, Loeschberger, Proppert, Wolter, Van De Linde and Sauer2011; Shroff et al. Reference Shroff, Galbraith, Galbraith, White, Gillette, Olenych, Davidson and Betzig2007; van de Linde et al. Reference Van De Linde, Endesfelder, Mukherjee, Schuttpelz, Wiebusch, Wolter, Heilemann and Sauer2009; Wilmes et al. Reference Wilmes, Staufenbiel, LIßE, Richter, Beutel, Busch, Hess and Piehler2012). Discrimination of up to six different colors was introduced for the original STORM approach by applying different labels at different wavelengths for activation and emission (Bates et al. Reference Bates, Dempsey, Chen and Zhuang2011). The simplest approach is to use single-molecule signatures not only for determining positions but also for identifying different species (Schoenle & Hell, Reference Schoenle and Hell2007): a single continuously running excitation laser elicits fluorescence emission of various labels with slightly differing emission spectra (e.g. with their maxima 20–40 nm apart), two camera channels (preferably on the same chip) detect the fluorescence signal in nearby wavelength ranges, and single molecules are assigned through the ratios of photons detected in each channel (Bossi et al. Reference Bossi, Foelling, Belov, Boyarskiy, Medda, Egner, Eggeling, Schoenle and Hell2008). Using this approach, up to four different colors have been separated with nanoscale resolution in fixed as well as living cells (Fig. 14e, f) (Gunewardene et al. Reference Gunewardene, Subach, Gould, Penoncello, Gudheti, Verkhusha and Hess2011; Testa et al. Reference Testa, Wurm, Medda, Rothermel, Middendorff, Fölling, Jakobs, Hell and Eggeling2010). Similarly, other spectroscopic parameters such as fluorescence anisotropy or lifetime may be used to distinguish between molecules of different rotational mobility (e.g. immobilized and freely diffusing molecules) or lifetime but same emission color (Schoenle & Hell, Reference Schoenle and Hell2007; Testa et al. Reference Testa, Schönle, Middendorff, Geisler, Medda, Wurm, Stiel, Jakobs, Bossi, Eggeling, Hell and Egner2008), or to simply image molecular positions and mobilities (Gould et al. Reference Gould, Gunewardene, Gudheti, Verkhusha, Yin, Gosse and Hess2008).
(F)PALM/STORM or GSDIM/(d)STORM-based nanoscopes have nowadays been commercialized and found their ways into a lot of laboratories all over the world, adding to the toolset for solving long-standing biological problems.
4. Conclusions: coordinate-targeted versus -stochastic
Both branches of nanoscopy (super-resolution optical microscopy) – coordinate-targeted STED/RESOLFT and coordinate-stochastic (F)PALM/STORM – are ultimately based on the same basic principle: transferring fluorescent labels between states of different emission characteristics (such as a bright ON- and a dark OFF-state) to allow the discerning of nearby objects (e.g. Hell, Reference Hell2009b) (Fig. 15). Both branches are complementary and have their own advantages and disadvantages. The advantage of stochastically switching molecules is obvious: Whereas in the coordinate-targeted STED/RESOLFT read-out mode a molecule has to undergo many ON–OFF cycles, in the stochastic switching mode, a single OFF–ON–OFF cycle per molecule is in principle enough to produce an image, thus avoiding switching fatigue. However, in contrast to STED/RESOLFT nanoscopy, which usually creates a direct image of molecular distributions, computational algorithms are generally applied for (F)PALM/STORM to reconstruct the final image, a potential source of bias. For example, some molecules may be localized more precisely than others, because the number of photon emissions N follows a statistical distribution. Therefore, to ensure a certain resolution, the stochastic read-out mode usually defines a brightness threshold (e.g. N > 50) and molecules emitting less than this threshold in a bunch are discarded without contributing to the image. In a sense, this rejection of molecular events is to the stochastic read-out what switching fatigue (or photobleaching) is to its coordinate-targeted counterpart; the higher the required resolution, the more molecular events are discarded. Often, (F)PALM/STORM-based experiments have achieved focal plane resolution of <20 nm at the expense of discarding molecules (see e.g. Shroff et al. Reference Shroff, Galbraith, Galbraith and Betzig2008; Small, Reference Small2009). In addition, some molecules may not be activated at all or counted several times, i.e. the molecular numbers assigned to the final image may be biased. While this imperfect assignment may not corrupt images of filament-like structures such as of microtubules, actin, mitochondrial or ER membrane renditions, it may compromise the accurate characterization of protein clusters (e.g. Annibale et al. Reference Annibale, Vanni, Scarselli, Rothlisberger and Radenovic2011). In general, coming along with the increased sensitivity of the nanoscopy approach, greater care has to be taken when labelling cellular samples, especially with respect to unspecific background staining (Wurm et al. Reference Wurm, Neumann, Schmidt, Egner, Jakobs and Papkovsky2010). Artifacts due to, for example, improper fixation in immunolabeling or unspecific binding may not be observed in confocal but may be visible in nanoscopy images, due to the improved spatial resolution in the latter (Opazo et al. Reference Opazo, Levy, Byrom, Schaefer, Geisler, Groemer, Ellington and Rizzoli2012; Tanaka et al. Reference Tanaka, Suzuki, Shirai, Shibutani, Miyahara, Tsuboi, Yahara, Yoshimura, Mayor, Fujiwara and Kusumi2010). Also, due to the increased spatial resolution, the term “co-localization” may become invalid, since two objects (especially when labelled via a primary and secondary antibody as in most immunolabeling approaches) cannot occupy the same spot.
Coordinate-targeted versus coordinate-stochastic nanoscopy. Both families of methods are based on transitions between molecular states of different fluorescence characteristics (such as a bright ON- and a dark OFF-state) realizing the separation of different molecules within a diffraction-limited area by subsequently confining emission either to sub-diffraction sized spots defined in space (coordinate-targeted (deterministic), left) or stochastically in space on single isolated molecules (coordinate-stochastic, right). Sub-diffraction coordinate-targeted and -stochastic imaging can be realized using the same fluorescence labels and switching mechanisms. (a) Coordinate-targeted STED (left) versus coordinate-stochastic (F)PALM/STORM images (right) of organic-dye-labeled microtubules in fixed PtK2 cells. (b) Coordinate-targeted GSD (left, scale bar 500 nm) versus coordinate-stochastic GSDIM images (right) of Atto532-labeled microtubules in fixed PtK2 cells. (c) Coordinate-targeted RESOLFT (left) versus coordinate-stochastic (F)PALM/STORM images (right) of the RSFP Dreiklang expressed in live PtK2 cells at Keratin19 (left) and Map2-micotubules (right). Adapted from (Brakemann et al. Reference Brakemann, Stiel, Weber, Andresen, Testa, Grotjohann, Leutenegger, Plessmann, Urlaub, Eggeling, Wahl, Hell and Jakobs2011). Diffraction-limited counterparts in upper parts. All other scale bars: 1 μm.
It is worth noting that the enhanced sensitivity of all nanoscopy concepts to artifacts calls for elaborate control measurements. For example, the results of previous protein cluster analyses using STED nanoscopy were ascertained using different labels as well as different STED setups, potentially introducing different switching fatigues (Sieber et al. Reference Sieber, Willig, Kutzner, Gerding-Reimers, Harke, Donnert, Rammner, Eggeling, Hell, Grubmuller and Lang2007). At the same time, the multitude of different nanoscopy methods allows new ways of validating results. For example, both nanoscopy branches, the coordinate-targeted and the coordinate-stochastic, may exploit the same molecular transitions and may thus be applicable to the same samples. Figure 15 depicts examples of STED versus (F)PALM/STORM (Fölling et al. Reference Fölling, Belov, Kunetsky, Medda, Schönle, Egner, Eggeling, Bossi and Hell2007), GSD versus GSDIM (Bretschneider et al. Reference Bretschneider, Eggeling and Hell2007; Fölling et al. Reference Fölling, Bossi, Bock, Medda, Wurm, Hein, Jakobs, Eggeling and Hell2008b), and RESOLFT versus PALM (Brakemann et al. Reference Brakemann, Stiel, Weber, Andresen, Testa, Grotjohann, Leutenegger, Plessmann, Urlaub, Eggeling, Wahl, Hell and Jakobs2011) nanoscopy experiments, where the same or similar labels have been used for nanoscale cellular imaging. Consequently, both techniques could be applied for the validation of a specific result. Of course, while complementary, one approach may be more suitable for a concrete measurement than the other, and this argues for research environments having access to several of the above methodologies. For example, STED/RESOLFT has proven to be able to record fast live-cell dynamics, even deep inside tissue and in vivo (at times through the combination with single-molecule spectroscopic tools such as FCS), yet, to maintain reasonable signal-to-noise or -background levels, brightly labeled samples are often favored. On the other hand, (F)PALM/STORM-based experiments have shown remarkable results when imaging faintly labeled structures such as actin, but due to their acquisition mode have proven to be less versatile for dynamic live-cell and deep-tissue imaging, even if recent developments may improve their applicability in this regard. Quite generally, one should keep in mind and expect that new research will address such limitations where they are not of a fundamental nature. Still one should not expect one microscope to be optimized in all aspects of microscopy: high spatial and temporal resolution, low phototoxicity (and thus large live-cell compatibility), and high image contrast. For example, while (F)PALM/STORM- and STED-based nanoscopy approaches may suffer from still too low temporal resolution and potentially too high phototoxicity, respectively, recent ultrafast, low-phototoxic light-sheet based optical microscopes (Wu et al. Reference Wu, Wawrzusin, Senseney, Fischer, Christensen, Santella, York, Winter, Waterman, Bao, Colón-Ramos, McAuliffe and Shroff2013; Chen et al. Reference Chen, Legant, Wang, Shao, Milkie, Davidson, Janetopoulos, Wu, Hammer, Liu, English, Mimori-Kiyosue, Romero, Ritter, Lippincott-Schwartz, Fritz-Laylin, Mullins, Mitchell, Bembenek, Reymann, Böhme, Grill, Wang, Seydoux, Tulu, Kiehart and Betzig2014) so far do not give sub-diffraction spatial resolution.
It is becoming obvious that lens-based far-field fluorescence nanoscopy opens up unprecedented possibilities for biophysical and medical research. Wide-spread availability of instrumentation and expertise and the targeted application to important problems will enable the full impact of far-field nanoscopy to be realized, with many answers to long-standing scientific quests.
5. Acknowledgements
Several members of the Department of NanoBiophotonics (Stefan Jakobs, Roman Schmidt, Mark Bates, Brian Rankin, Veronika Mueller, Alf Honigmann, Vladimir Belov, Volker Westphal, Lars Kastrup), Xiaowei Zhuang (Harvard), Markus Sauer (University of Würzburg, Germany), Thomas Dertinger and Jörg Enderlein (University of Göttingen, Germany), Jun-ichi Hotta and Johan Hofkens (Leuven, Belgium), Günter Schwarzmann (University of Bonn), Benjamin Harke (Genua, Italy), Hans Blom (Stockholm, Sweden), Hari Shroff (NIH, Bethesda) are greatly acknowledged for supplying data for the figures and fruitful discussions. We thank Lars Meyer (Department NanoBiophotonics), Jochen Sieber (Leica Microsystems, Mannheim) and Thorsten Lang (University of Bonn) for measurements or sample preparations. We wish to express our thanks to all our colleagues in Göttingen, in Heidelberg and around the world who have helped make the remarkable development of far-field fluorescence nanoscopy over the last 20 years a reality. Finally, one of us (SWH) acknowledges long-term support by a Gottfried Wilhelm Leibniz Prize of the Deutsche Forschungsgemeinschaft, the Körber European Science Prize of the Körber Foundation and by the Volkswagenstiftung.