I. INTRODUCTION
Microarchitectured materials including microlattices and microsandwiches have emerged recently as promising structural and functional frameworks for small-scale multifunctional devices. Reference Fleck, Deshpande and Ashby1–Reference Xiong, Mines, Ghosh, Vaziri, Ma, Ohrndorf, Christ and Wu3 Their open architecture not only leads to low areal density and high damage tolerance, but also provides channels for heat/fluid flow, which is critical to multifunctional devices such as high-capacity batteries, insect-like robots, and microair vehicles. Reference Tian, Kim, Lu, Hodson, Queheillalt, Sypeck and Wadley4–Reference Gu and Greer7 A sandwich structure exhibits higher bending rigidity than lattices by effectively redistributing the mass to the outer surfaces (instead of the core), similar to natural cellular materials found in insects and plants. Reference Fleck, Deshpande and Ashby1,Reference McCormack, Miller, Kesler and Gibson8 The stiff face sheets carry bending and in-plane stresses during deformation, while the low-density core bears transverse shear stresses. Reference Shuaeib and Soden9 Such superior property has led to extensive study on the structural design of sandwiches, mostly with core size above tens of millimeters. The damage tolerance of sandwiches is highly dependent on the density, strength, and geometry of the core. Reference Shen, McKown, Tsopanos, Sutcliffe, Mines and Cantwell10 It was found that the periodic sandwich core can be optimized to sustain loads at much lower relative densities than stochastic foams. Reference Wadley, Fleck and Evans11 Further improvement of mechanical properties may also be achieved by hybridizing the core material. Reference Yin, Wu, Ma and Nutt12
Existing fabrication procedures of large-scale sandwich structures typically involve welding or adhesive bonding of the face sheets and the core. These techniques become challenging as core size decreases to the nano- to micro-meter scale. Recently, there have been several successful attempts to create microlattice and microsandwich structures from polymers, Reference Kolodziejska, Roper, Yang, Carter and Jacobsen2 ceramics, Reference Meza, Das and Greer13 and metals. Reference Gu and Greer7 Kolodziejska et al. Reference Kolodziejska, Roper, Yang, Carter and Jacobsen2 demonstrated the synthesis of an ultrathin lightweight polymer micosandwich by using a self-propagating photopolymer waveguide. Meza et al. Reference Meza, Das and Greer13 developed energy-absorbing ceramic microlattices with high compression ductility by combing photon lithography, atomic layer deposition, focused ion beam microscopy (FIB), and oxygen plasma etching. Recently, the same group Reference Gu and Greer7 combined the template fabrication procedure with aqueous electrodeposition (ED) to produce Cu octet microlattice. Despite these progresses, the fabrication processes reported above often are complicated (involve multiple steps) or limited to specific material type, Reference Kolodziejska, Roper, Yang, Carter and Jacobsen2 a simple fabrication technique for a metallic microsandwich structure is still lacking. Here, we report a one-step ED procedure to fabricate an Al-based microsandwich structure by using a commercial polycarbonate (PC) template and two anodes simultaneously. Mn is chosen to refine the microstructure and improve the strength of Al, as demonstrated in electrodeposited Al–Mn thin films by Ruan and Schuh. Reference Ruan and Schuh14,Reference Ruan and Schuh15 The presented approach offers an opportunity to create Al alloy structures with low density, open architecture, high specific strength, and damage tolerance, which may find potential applications as plasmonic pixels in color displays, Reference Olson, Manjavacas, Liu, Chang, Foerster, King, Knight, Nordlander, Halas and Link16 anodes for Li ion batteries, Reference Cheah, Perre, Rooth, Fondell, Harsta, Nyholm, Boman, Gustafsson, Lu, Simon and Edstrom17,Reference Oltean, Nyholm and Edstrom18 and energy adsorbers Reference Deshpande and Fleck19,Reference Mukai, Kanahashi, Miyoshi, Mabuchi, Nieh and Higashi20 etc.
II. EXPERIMENTAL PROCEDURE
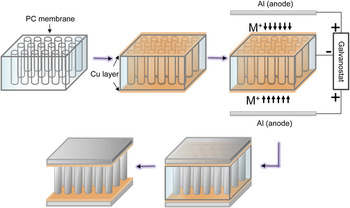
Track-etched PC membranes (Cyclopre) with an average nominal pore diameter of 5 µm were sputtered (CRC sputter coater [Torr International, New Windsor, New York], 99.99% argon, 5 mTorr) with a thin Cu layer of ∼250 nm thickness on both sides prior to ED. The ED experiments were performed at room temperature using a three-electrode setup inside an Ar-filled glovebox (Mbraun Labstar [Stratham, New Hampshire], O2 < 1 ppm, H2O < 1 ppm). Al wire (99.99%, Alfa Aesar, Haverhill, Massachusetts) was used as the reference electrode. The Cu-coated PC membrane (working electrode) was placed in the middle of two parallel Al anodes (99.99%, Alfa Aesar), allowing Al–Mn to be deposited from both ends of the pore, as illustrated in Fig. 1. The ionic liquid electrolyte was made by mixing AlCl3 (anhydrous, 99.999%, Alfa Aesar) and 1-ethyl-3-methyl-imidazolium chloride (EMIC, >98%, IoLiTec, Tuscaloosa, Alabama) in 2:1 molar ratio. As-received EMIC was dried under vacuum at 60 °C for at least 24 h prior to mixing. The electrolyte was then purified using an Al plate under agitation until a vanish yellow color was achieved. MnCl2 (98%, GFS Chemicals, Powell, Ohio) was added to the electrolyte in different molarities and agitated for 24 h. Galvanostatic ED was performed using Gamry Reference 600 potentiostat/galvanostat at 10 mA/cm2 for 1 h. Finally, free-standing microsandwiches were obtained by dissolving the PC membrane using dichloromethane.
Schematic illustration of ED procedures for microsandwiches.

Cyclic voltammetry experiments were performed on tungsten wire (∼1 mm diameter) working electrode at a scan rate of 20 mV/s. The deposited structures were characterized using x-ray diffraction (XRD, PANalytical X'Pert PRO, Westborough, Massachusetts), scanning electron microscopy (SEM, Hitachi SU-70, Willich, Germany), and energy-dispersive x-ray spectroscopy (EDS, EDAX-Phoenix, Mahwah, New Jersey). Cross-sections of the microsandwiches were obtained by ion milling using focused ion beam microscopy (FIB, FEI Quanta 200, Hillsboro, Oregon). Special care was taken to minimize Ga contamination by using reduced current density during the final milling steps. Nanoindentation of the deposits was performed using a triboindenter (Ti900, Hysitron, Minneapolis, Minnesota) with a diamond Berkovich tip (∼125 nm radius) at 7 mN maximum load, 1.4 mN/s loading/unloading rate, and 2 s holding time. Finally, to investigate the mechanical behavior of sandwich structures exposed to localized point loads, microindentation (UMT-2, CETR, Campbell, California) tests were performed using an alumina ball (4 mm diameter) tip under a constant normal load (varied from 20 to 25 N).
III. RESULTS AND DISCUSSION
A. Cyclic voltammogram
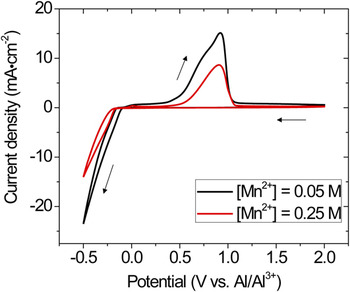
Figure 2 shows the typical cyclic voltammograms recored at W electrodes in 66.7–33.3 mol% AlCl3–EMIC electrolyte containing 0.05 and 0.25 M [Mn2+]. The scan started from 2 V versus Al/Al3+ and was reversed at −0.5 V versus Al/Al3+. Mn is nobler than Al in an aqueous solution, but in acidic chloroaluminate electrolyte (with molar fraction of AlCl3 > 0.5), the deposition potential of Mn is slightly more negative than that of Al. Reference Verdieck and Yntema21 The forward scan in Fig. 2 is similar to that reported for pure Al, Reference Tsuda, Hussey and Stafford22,Reference Su, Hsieh, Chen and Sun23 showing no obvious reduction wave associated with [Mn2+]. This indicates that Mn codeposited with Al at potentials lower than ∼−0.1 V versus Al/Al3+ in the ionic liquid with 0.05 M [Mn2+]. The overall reduction of Al–Mn occurred by the following reactions Reference Uchida, Tsuda, Yamamoto, Seto, Abe and Shibuya24 :
 $${\rm{M}}{{\rm{n}}^{2 + }} + 2{{\rm{e}}^ - } \leftrightarrow {\rm{Mn}}\quad ,$$
and
 $$4{\rm{A}}{{\rm{l}}_2}\mathop {{\rm{C}}{{\rm{l}}_7}}\nolimits^ - + 3{{\rm{e}}^ - } \leftrightarrow {\rm{Al}} + 7{\rm{Al}}\mathop {{\rm{C}}{{\rm{l}}_4}}\nolimits^ - \quad .$$
Cyclic voltammograms recored in AlCl3–EMIC electrolyte containing 0.05 and 0.25 M [Mn2+].

In the reverse scan, Al–Mn dissolution occurred at potentials higher than ∼0.3 V versus Al/Al3+. Increasing [Mn2+] in the electrolyte shifted the reduction potential in the anodic direction and the dissolution potential in the cathodic direction. In addition, the current densities decreased by ∼40% as [Mn2+] increased from 0.05 to 0.25 M. This is similar to that reported by Tsuda et al.,
Reference Tsuda, Hussey and Stafford22
who found that the addition of [Mn2+] inhibits the nucleation of Al. EDS (EDAX-Phoenix) analysis showed that increasing [Mn2+] from 0.05 to 0.25 M increased the Mn concentration in the deposits from 9.0 ± 0.3 at.% to 26.2 ± 0.4 at.%. During codeposition of Al and Mn, the alloy composition is mainly governed by the concentrations of the electroactive species
 ${\rm{A}}{{\rm{l}}_2}\mathop {{\rm{C}}{{\rm{l}}_7}}\nolimits^ -$
and Mn2+.
Reference Stafford, Hussey, Alkire and Kolb25
 ${\rm{A}}{{\rm{l}}_2}\mathop {{\rm{C}}{{\rm{l}}_7}}\nolimits^ -$
strongly depends on the acidity of the electrolyte. Under Lewis base conditions (molar fraction of AlCl3 < 0.5),
 $\left[ {{\rm{A}}{{\rm{l}}_2}{\rm{Cl}}_7^ - } \right]$
is close to zero (<10−7 M).
Reference Boon, Levisky, Pflug and Wilkes26
Thus, maintaining a Lewis acid electrolyte is necessary for the deposition of Al–Mn binary alloy. It also should be noted that this condition is not necessary for Al–Mn deposition in inorganic chloroaluminate electrolyte systems where the deposition can take place involving the discharge of
 ${\rm{Al}}\mathop {{\rm{C}}{{\rm{l}}_4}}\nolimits^ -$
in a basic solution.
Reference Li, Hjuler, Berg and Bjerrum27
B. Microstructure of Al–Mn microsandwich
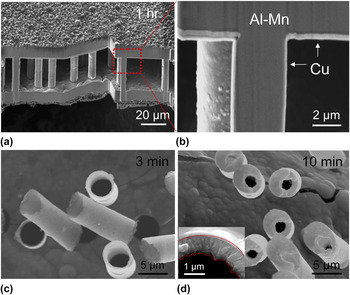
Al–Mn microsandwiches were successfully electrodeposited from acidic AlCl3–EMIC–MnCl2 electrolyte containg 0.05 M and 0.25 M [Mn2+], following the procedure illustrated in Fig. 1. Galvanostatic control was chosen to better control the size of the deposited structures. Figure 3(a) shows the SEM image of the microsandwich with ∼11 µm thick face sheets separated by 27.6 ± 0.6 µm tall pillars, which resemble the ancient Temple of Athena Nike. Figure 3(b) shows the cross-section of the microsandwich prepared by FIB, where Cu coating (light contrast) and Al–Mn pillar (dark contrast) can be seen clearly. Occasionally, porosity can be found in the center of the pillars, probably due to the development of high surface roughness after the extended deposition time.
SEM images of (a) and (b) microsandwich, (c) and (d) microtubes deposited from acidic AlCl3–EMIC electrolyte containing 0.05 M [Mn2+].

To evaluate the sandwich growth kinetics, selected ED was carried out for 3 and 10 min using one Al plate as an anode. The deposited structures were freestanding microtubes with various wall thicknesses. Typical SEM images of the microtubes are shown in Figs. 3(c) and 3(d). The tubes were completely hollow, with an average height of 9.8 ± 0.9 µm. Increasing the deposition time from 3 to 10 min led to thickening of the tube wall from 670 ± 100 nm to 1.2 ± 0.4 µm without affecting the tube length. The inset in Fig. 3(d) shows a closeup of the tube after 10 min deposition. It can be seen that the deposition advanced in the radial direction of the pore, and the inner-tube surface roughness increased with deposition time. During ED, kinetic roughening is often observed following a power law
 $\left\langle w \right\rangle \propto {t^\beta }$
,
Reference Huo and Schwarzacher28,Reference Dammers and Radelaar29
where w represents the surface width, i.e., the average edge length projected on the substrate, and t is the deposition time. The power exponent β typically varies from 0.2 to 0.5, depending on deposition parameters such as the current density and electrolyte concentration.
Reference Huo and Schwarzacher28,Reference Dammers and Radelaar29
Measurements of the inner-tube surfaces indicate ∼36% increase of the surface width as the deposition time increased from 3 to 10 min, giving a power exponent β ≈ 0.25 in the present study.
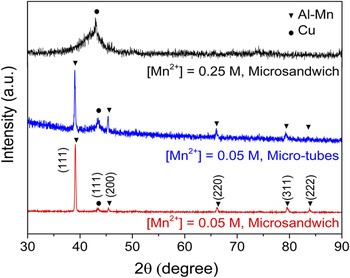
XRD results of the microtubes and microsandwiches are presented in Fig. 4. At 0.05 M [Mn2+], the XRD pattern of the microtubes and microsandwich exhibited a single set of fcc peaks (lattice constant ≈ 4.00 Å) in addition to Cu (111), indicating the formation of a supersaturated solid solution of Al–Mn. This Mn concentration (9.0 at.%) is significantly higher than the equilibrium solubility of Mn in Al at room temperature (∼0.62 at.%).
Reference Liu, Ohnuma, Kainuma and Ishida30
For the microsandwich, a pronounced
 $\left\langle {111} \right\rangle$
fiber texture developed along the pillar direction, similar to that observed in other fcc metallic nanowires.
Reference Tian, Wang, Kurtz, Mallouk and Chan31
At 0.25 M [Mn2+], the XRD pattern of the microsandwich indicated the formation of a complete amorphous phase (with possible local ordering
Reference Ruan and Schuh14
), as represented by the diffuse peak at 2θ ≈ 42°. These results indicate that Mn, which has a Goldschmidt radius ∼11% smaller than that of Al, is substitutionally incorporated into the Al lattice. Further increasing the alloy content frustrates the ordered structure and leads to the formation of amorphous phase.
XRD 2θ scans of microtubes and microsandwiches.

C. Mechanical properties
To evaluate the mechanical properties of the microsandwiches, nanohardness of Al–Mn was measured using Oliver–Pharr method on sandwich face sheets.
Reference Oliver and Pharr32
The maximum indentation for the crystalline (9 at.% Mn) and amorphous (26 at.% Mn) Al–Mn was ∼250 and ∼200 nm, respectively. The hardness of the crystalline and amorphous deposits is 2.59 ± 0.21 and 6.14 ± 0.35 GPa, respectively. These values are consistent with those reported in monolithic Al–Mn thin films electrodeposited from the same electrolyte at similar deposition current density.
Reference Ruan and Schuh14,Reference Ruan and Schuh15
Ruan and Schuh
Reference Ruan and Schuh14
showed that Mn is highly effective in refining the microstructure of Al; increasing Mn% up to ∼13 at.% reduces the grain size of Al by more than three orders of magnitude. Thus the high hardness of Al–Mn is likely the combined effects of Hall–Petch and solid solution strengthening. Given the low density of Al alloys (ρAl–9Mn ≈ 3.12 g/cm3 and ρAl–26Mn ≈ 3.94 g/cm3) and the open architecture (relative density
 $\bar \rho = {{{\rho _{{\rm{sandwich}}}}} \mathord{\left/ {\vphantom {{{\rho _{{\rm{sandwich}}}}} {{\rho _{{\rm{solid}}}}}}} \right. \kern-\nulldelimiterspace} {{\rho _{{\rm{solid}}}}}} = 0.48$
), the density of the microsandwiches is estimated to be ∼1.50 and 1.89 g/cm3 for the crystalline and amorphous structure, respectively. The estimated specific strengths of the sandwiches are between 277 and 520 kN m/kg, well in excess of that of Al alloys used in commercial Al foams.
Reference McCormack, Miller, Kesler and Gibson8
We also note that the relative density of the deposit can be tailored by adjusting the geometry of the membrane (e.g., pore density, pore diameter, membrane thickness) or controlling the deposition time (to form hollow instead of solid cores). For commercial PC membrane with void volume ranges between 4 and 20%, we estimate that a relative density in the range of ∼20–50% can be potentially achieved using the current method.
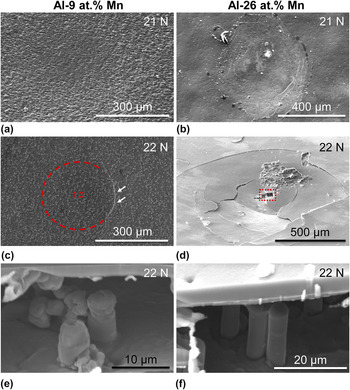
While sandwiches are efficient lightweight structures with high bending rigidity, they are notoriously sensitive to failure by the application of localized external loading. Reference Shuaeib and Soden9 To evaluate their resistance to quasistatic impact, the crystalline and amorphous microsandwiches (approximately 1 × 1 cm2) were indented by a 4 mm diameter alumina ball under 20–25 N normal load. A top face crack started to develop in the crystalline microsandwich at loads larger than ∼22 N. On the other hand, large-scale cracks were observed on the top face of the amorphous microsandwiches under all loads investigated. Figures 5(a)–5(d) show typical SEM images of the surface of the microsandwiches indented at 21 and 22 N. The failure modes were similar to those reported for macroscale sandwich structures. Reference Shuaeib and Soden9 The crystalline microsandwich mainly failed by pillar (core) compression [Fig. 5(e)], with minimal deformation of the upper face (skin). The height of the deformed pillars beneath the indent was ∼8.3 ± 0.5 µm, corresponding to a local compressive strain of ∼70%. An arc-shaped crack was developed near the edge of the contact area under 22 N [Fig. 5(c)], characteristic of ductile intergranular fracture. The failure mode of the amorphous microsandwich [Figs. 5(b) and 5(d)] was mainly the brittle fracture and collapse of the upper face, whereas the pillars underneath retained their original shape [Fig. 5(f)]. Debonding between the top faces and the core was observed in both samples.
SEM images of (a) and (b) surface and (c) and (d) cross-section of Al–9 at.% Mn and Al–26 at.% Mn microsandwiches after microindentation. Images (e) and (f) are taken from the box areas in (c) and (d), respectively.

During indentation of a sandwich structure, the core yield load (P 1) can be estimated as Reference Shuaeib and Soden9
 $${P_1} = 1.52{\sigma _{\rm{c}}}bt{\left( {{{{E_{\rm{c}}}} \over {{E_{\rm{f}}}}}{c \over t}} \right)^{{1 \mathord{\left/ {\vphantom {1 4}} \right. \kern-\nulldelimiterspace} 4}}}\quad ,$$
where the core yield strength (σc, listed in Table I) is calculated from nanoindentation hardness assuming a Tabor factor of 3, the skin thickness t is 11 µm, sample width b is 1 mm, core thickness c is 27.6 µm, and the core to face elastic modulus ratio
 ${{{E_{\rm{c}}}} \over {{E_{\rm{f}}}}} \approx 1$
. The load for the top skin fracture (P
2) and the plastic zone size (2 s, as defined in Fig. 3 in Ref. Reference Shuaeib and Soden9) can be solved numerically from Eqs. (2) and (3) (Ref. Reference Shuaeib and Soden9):
 $$\left( {{{3\lambda } \over {2{\sigma _{\rm{c}}}b}}} \right){P_2} = {{2{z^3}\left( {{{\sinh }^2}z\prime + {{\sin }^2}z\prime } \right) + 3\left( {\sinh z\prime \cosh z\prime - \sin z\prime \cos z\prime } \right)\left( {2{z^2} - 1} \right) - 6z} \over {{z^2}\left( {{{\sinh }^2}z\prime + {{\sin }^2}z\prime } \right) + 2z\left( {\sinh z\prime \cosh z\prime - \sin z\prime \cos z\prime } \right) - \left( {{{\cosh }^2}z\prime + {{\cos }^2}z\prime } \right)}}\quad ,$$
and
 $$\left( {{\lambda \over {{\sigma _c}b}}} \right){P_2} = {{{{{\lambda ^2}{t^2}{\sigma _f}} \over {3{\sigma _c}}} + {z^2} + 2zA + B} \over {z + A}}\quad ,$$
where z = λs, Z′ = λs′,
 $\lambda = {\left( {{{3{E_{\rm{f}}}} \over {{E_{\rm{c}}}c{t^3}}}} \right)^{{1 \mathord{\left/ {\vphantom {1 4}} \right. \kern-\nulldelimiterspace} 4}}}$
,
 $A = {{\sinh z'\cosh z' - \sin z'\cos z'} \over {{{\sinh }^2}z' + {{\sin }^2}z'}}$
, and
 $B = {{{{\sinh }^2}z' - {{\sin }^2}z'} \over {{{\sinh }^2}z' + {{\sin }^2}z'}}$
. The calculated results are listed in Table I. For the crystalline microsandwich, the predicted skin fracture load is 23.4 N, very close to the crack initiation load measured experimentally (∼22 N). This load is also larger than the core yield load (18.2 N). Thus, extensive core compression occurred prior to surface crack formation. In addition, the predicted plastic zone size (300 µm) agrees well with the experimentally measured fracture size [dashed arc in Fig. 5(c)]. For the amorphous microsandwich, the predicted core yield load (43.1 N) is much higher than the applied loads. Thus, no core compression was expected in this case. On the other hand, the brittle fracture of the top face, despite a high skin fracture load (55.6 N), is likely related to the near-zero tensile ductility of amorphous metals, which lacks sufficient intrinsic micromechanisms to mitigate high stress concentrations at crack tips.
Reference Lewandowski, Wang and Greer33
Summary of composition and properties of microsandwiches. Elastic constants were estimated from rule of mixture. Reference Cardarelli35 Plastic zone size, core yield and skin fracture loads were calculated from Eqs. (1)–(3).

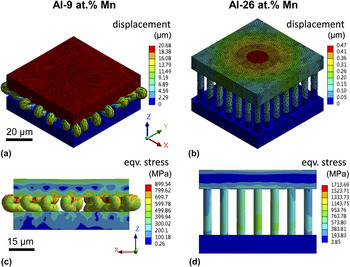
To gain further understanding of the failure mechanism of the microsandwiches, finite element analysis (FEA) was performed using Ansys Workbench over an area of 70 × 70 µm2 with pillars separated 10 µm apart. The dimensions of the microsandwich were taken from experimental measurements. Both Al–9 at.% Mn and Al–26 at.% Mn were assumed to be elastic-perfectly plastic (due to the lack of reliable stress-strain data) with material properties listed in Table I. The sandwiches were loaded at 0.81 N and subsequently unloaded to reproduce the experimentally measured displacement. The FEA results are shown in Fig. 6. Under the same load, the crystalline sandwiches were plastically deformed with large displacement [Fig. 6(a)], while the amorphous one experienced only elastic deformation [mainly on top face, as shown in Fig. 6(b)]. In both structures, the maximum equivalent stress and the critical shear strains always appear near the face–core interface, in agreement with the pillar delamination location observed experimentally. Finally, the absorption energy per unit volume of the crystalline microsandwich is estimated to be ∼43.2 MJ/m3, much higher than that of conventional aluminum foams and new lattice structures under similar strain (e.g., ∼1–4 MJ/m3 for ALPORAS, Reference Mukai, Kanahashi, Miyoshi, Mabuchi, Nieh and Higashi20 ∼12 MJ/m3 for aluminum honeycomb foam, Reference Ruan, Torres, Thompson and Schuh34 and 1–20 MJ/m3 for stainless steel square and diamond lattice Reference Ruan and Schuh14,Reference Ruan, Torres, Thompson and Schuh34 ).
FEA predicted (a) and (b) displacement, and (c) and (d) equivalent stress of Al–9 at.% Mn and Al–26 at.% Mn microsandwiches after microindentation.

IV. CONCLUSIONS
In summary, Al–Mn microsandwiches with a nominal core pillar size of 5 μm were successfully electrodeposited using a PC template from acidic chloroaluminate electrolyte containing 0.05 and 0.25 M [Mn2+]. The crystallinity and mechanical properties of the deposits can be tuned by controlling [Mn2+] in the electrolyte. Microsandwiches were found to grow along the radial direction of the template pore with tunable wall thickness by the deposition time. Alloying with Mn significantly increased the strength and damage tolerance of the microsandwich. Given the flexibility and scalability of the ED process, the methods demonstrated here present an interesting future direction for designing ultralightweight energy adsorbers with open architecture, high strength, and damage resistance.
ACKNOWLEDGMENTS
This research was financially supported by a University of South Florida start-up fund. All materials characterization was performed at the Nano Research and Educational Center (NREC) at the University of South Florida.