Nomenclature list
- FID:
Flame ionisation detection
- Ea:
activation energy
- x:
the cumulative conversion rate of the hydrocarbon evaporation in the total evaporable hydrocarbons
- ai:
the relative contribution
- Ai:
the pre-exponential of the ith compositional group
- Ei:
the activation energies of the ith compositional group
- xi:
the cumulative conversion rate of hydrocarbon evaporation in the ith compositional group
- R:
the gas constant
- T:
the absolute temperature
- m:
the number of evaporable hydrocarbon groups
- xt :
the evaporation rate at time t
- S:
the FID signal
- M:
the weight of the sample for Rock-Eval pyrolysis
- Sw,t:
the cumulative FID signals of the whole source rock at time t
- Sw,c:
the cumulative FID signals of the whole source rock at completion
1. Introduction
Shale oil is an unconventional petroleum resource characterised by self-generation and self-storage. The great success of shale oil exploration and development in North America has triggered a global boom in shale oil exploration and development. Shale oil content evaluation technology forms the basis of shale oil exploration and resource evaluation. There are two kinds of evaluation methods for shale oil content: solvent extraction; and pyrolysis. The solvent extraction method is more cumbersome, involves more solvent loss, and – takes more time than the pyrolysis method. Pyrolysis is a commonly used analysis method for conventional oil and gas exploration. It has the advantages of being well established, highly accurate, quick and economic with low sample consumption, and convenient acquisition. However, pyrolysis does not always yield the true oil content. More reliable methods for the rapid evaluation of shale oil content based on pyrolysis have been proposed by previous researchers (Jarvie Reference Jarvie and Breyer2012a, Reference Jarvie and Breyer2012b; Jiang et al. Reference Jiang, Li, Qian, Li, Li, Huang, Zhang and Ma2016; Li et al. Reference Li, Chen, Ma, Cao, Li and Jiang2018). In essence, the pyrolysis method is based on the evaporation characteristics of crude oil under heating conditions. Therefore, an understanding of the crude oil evaporation kinetics in shale is required to establish a pyrolysis method to evaluate the oil-bearing properties of shale.
In this study, pyrolysis experiments were conducted on an unextracted source rock sample and the extracted sample. A simple method is proposed to calculate the thermal evaporation kinetics of soluble organic matter.
2. Methods
A source rock sample rich in free and adsorbed hydrocarbons from the Jianghan Basin was collected. The sample was crushed to <120 mesh and divided into two parts. One part was directly used for pyrolysis analysis performed on Rock-Eval 6, and the other was used for pyrolysis analysis on Rock-Eval 6 after extraction. Chloroform was used as the solvent, and Soxhlet extraction was conducted for 72 h. The whole-rock samples and the extracted sample were pyrolysed with three different heating programmes: 5°C min−1; 15°C min−1; and 25°C min−1. The initial temperature of the pyrolysis oven was 200°C, and the maximum temperature was 650°C. Thermal desorption and pyrolysis were conducted in a nitrogen atmosphere, followed by oxidation in air. Flame ionisation detection (FID) was used to monitor the hydrocarbons released during thermal evaporation and pyrolysis. Hydrocarbon FID-pyrogrammes of the samples were used for data analysis.
3. Results and discussion
3.1. Rock-Eval data
The FID signals show bimodal characteristics (S1 and S2) at all three heating rates. Although the values of S1 and S2 differ between heating rates, the hydrocarbon potential is not affected. The mean values of the hydrocarbon potential obtained from the three Rock-Eval pyrolysis experiments at different heating rates were 20.70 mg g−1 and 2.24 mg g−1, for the unextracted sample and the extracted sample, respectively; the difference (18.46 mg g−1) corresponds to the content of soluble organic matter. This is like the abundance of chloroform bitumen ‘A’ of 1.91%.
It should be noted that the S2 peak of the whole source rock sample does not completely overlap with that of the extracted sample (Fig. 1). The S2 of the extracted sample was almost half that of the whole source rock sample, indicating that half of the S2 was composed of soluble organic matter, rather than kerogen pyrolytic hydrocarbon.
Flame ionisation detection signal per milligram sample. (a) Real-time FID signal vs temperature at 25°C min−1. (b) Cumulative FID signal vs temperature at 25°C min−1. (c) Real-time FID signal vs temperature at 15°C min−1. (d) Cumulative FID signal vs temperature at 15°C min−1. (e) Real-time FID signal vs temperature at 5°C min−1. (f) Cumulative FID signal vs temperature at 5°C min−1.

In addition, a relatively small peak was observed between S1 and S2, which is like that observed by Li et al. (Reference Li, Chen, Ma, Cao, Li and Jiang2018) and termed S1b. The S1b response of trapped hydrocarbons lies in the default temperature range of S2 for a normal programmed heating procedure. A small S1 peak remained for the extracted sample, which may be attributed to some isolated hydrocarbons that could not be extracted due to lack of contact with the solvent during the extraction process.
3.2. Evaporation kinetic model
The pyrolysis of kerogen and source rock rich in soluble hydrocarbons can be described using chemical kinetic models. Therefore, the thermal evaporation of soluble hydrocarbons can also be described by chemical kinetics (Nezhad & Hami, Reference Nezhad and Hami2016). A series of independent and parallel first-order chemical reaction kinetics is often used to describe the thermal degradation of source rock. The thermal evaporation of free and adsorbed hydrocarbons in source rocks can also be described by an n-parallel first-order reaction model. Let x be the cumulative conversion rate of the hydrocarbon evaporation in the total evaporable hydrocarbons:

where ai is the relative contribution, Ai and Ei are the pre-exponential and activation energies of the ith compositional group, respectively, xi is the cumulative conversion rate of hydrocarbon evaporation in the ith compositional group, R is the gas constant, T is the absolute temperature and m denotes the number of evaporable hydrocarbon groups.
3.3. Conversion rate of hydrocarbon evaporation
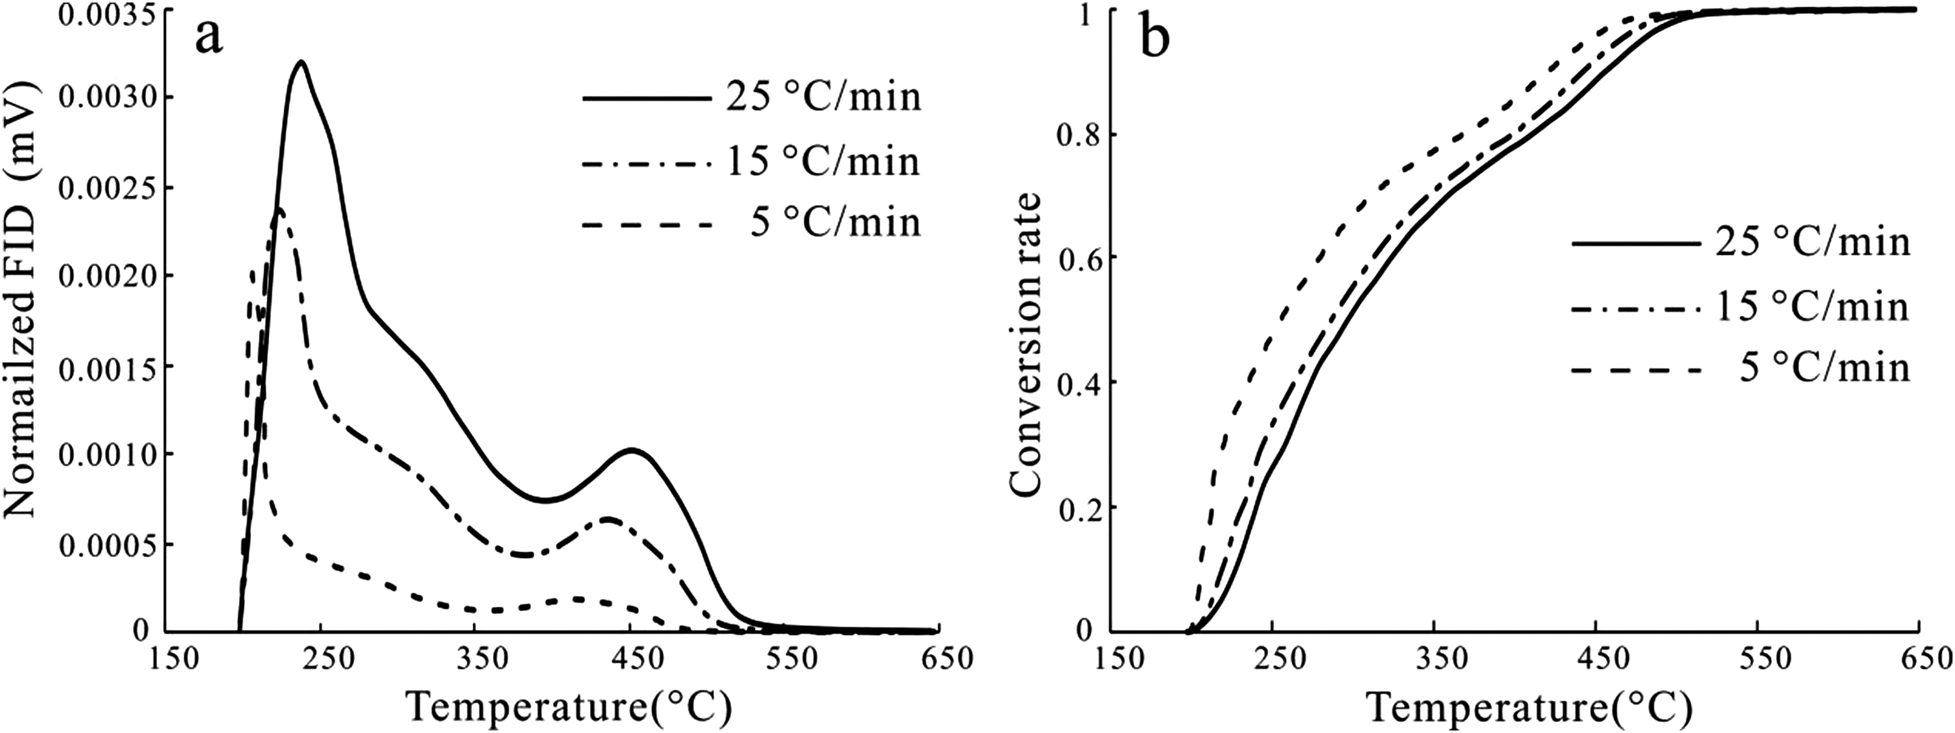
The FID signal has a positive linear correlation with the number of hydrocarbons in the source rocks (Romero-Sarmiento 2019). Therefore, the conversion rate can be expressed by the following formula:

where xt is the evaporation rate at time t, S is the FID signal, and M is the weight of the sample for Rock-Eval pyrolysis, while S w,t and S w,c are the cumulative FID signals of the whole source rock at time t and at completion, respectively, and the subscripts w and ex represent the whole source rock sample and extracted sample, respectively. The whole source rock sample and extracted sample pyrolysis were heated using the same pyrolysis procedure. The calculated FID signal and evaporation conversion rate of the extractable crude oil are shown in Fig. 2.
(a) The relationship between the calculated flame ionisation detection signal of extractable crude oil and pyrolysis temperature. (b) The evaporate conversion rate of extractable crude oil.

3.4. Kinetic parameters
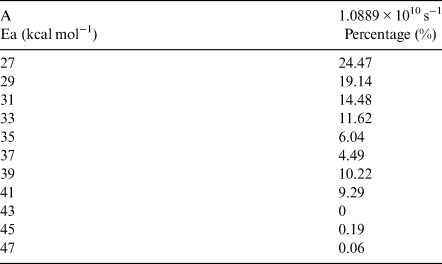
The cumulative evaporation rates at different times and temperatures can be calculated using the methods described in the previous sub-section. Kinetics 2000 software was used to calculate the kinetic parameters for the evaporation kinetics of extractable free and adsorbed hydrocarbons. The values of the pre-exponential and discrete distribution of activation energies could be obtained based on the time, temperature and evaporation rate input data from the three heating rates (Fig. 3 and Table 1). The pre-exponential term was 1.0889 × 10¹⁰ s−1. The calculated results have a high degree of fit with the experimental results.
The calculated evaporate conversion rate of extractable crude oil compared with measured results. (a) Fit effect diagram at 25°C min−1. (b) Fit effect diagram at 15°C min−1. (c) Fit effect diagram at 5°C min−1. (d) Activation energy distribution using pre-exponential 1.0889 × 10¹⁰ s−1 for thermal evaporation of extractable crude oil.

Evaporation kinetics of extractable hydrocarbon in source.

The activation energy (Ea) for hydrocarbon evaporation was in the range of 27–47 kcal mol−1 in a bimodal distribution, with a primary peak at 27 kcal mol−1 and a secondary peak at 39 kcal mol−1. The secondary peak of Ea represents some large molecules that are difficult to vaporise, and these compounds may be adsorbed on or be (?) mutually soluble with kerogen.
4. Conclusions
Based on Rock-Eval pyrolysis data of a whole source rock sample and an extracted sub-sample, a simple method is proposed to calculate the thermal evaporation kinetics of crude oil in shale. In this study, the Ea for hydrocarbon evaporation was in the range of 27–47 kcal mol−1 with a bimodal distribution with a primary peak at 27 kcal mol−1, and a secondary peak at 39 kcal mol−1.
5. Financial support
The authors acknowledge the financial support of the Open Fund of Key Laboratory of Exploration Technologies for Oil and Gas Resources (No. K2021-20) and the Open Foundation of Cooperative Innovation Center of Unconventional Oil and Gas, Yangtze University (No. UOG2022-19).
6. Conflict of interests
The authors declare none.