

Introduction
Juries are central to the US legal system (Abramson Reference Abramson1994). Although the majority of criminal cases do not reach a jury trial, the possibility of adjudication by a jury structures the decision making of prosecutors (Albonetti Reference Albonetti1986), defense attorneys (Kramer, Wolbransky, and Heilbrun Reference Kramer, Wolbransky and Heilbrun2007), and defendants throughout the court process (Eisenstein and Jacob Reference Eisenstein and Herbert1977). Roughly a third of all US citizens serve on a jury at some point (Mize, Hannaford-Agor, and Waters Reference Mize, Paula and Waters2007; Gastil et al. Reference Gastil, Pierre Deess, Weiser and Simmons2010, 4), and jury service is understood to be a key form of contact with the legal system, shaping attitudes toward legal institutions and participation in politics and civil society (Diamond Reference Diamond and Litan1993; Gastil et al. Reference Gastil, Pierre Deess, Weiser and Simmons2010). Indeed, the US Supreme Court has considered jury service an important aspect of citizenship, establishing that citizens cannot be excluded from a jury based on their race or gender (Fukurai and Krooth Reference Fukurai and Krooth2003; Gastil et al. Reference Gastil, Pierre Deess, Weiser and Simmons2010).
Despite the social significance of jury service for jurors, the majority of research on jury deliberations considers how different styles of deliberations or demographic compositions of juries relate to criminal defendants' outcomes (Sommers Reference Sommers2007; Devine Reference Devine2012; Hunt Reference Hunt2015). Less research has focused on the experiences of jurors as the outcome of interest (Diamond Reference Diamond and Litan1993). Studies that have considered jurors' experiences of deliberations have largely examined objective outcomes that are measurable through external observation, such as individual jurors' participation rates. We argue that researchers should also pay attention to jurors' subjective experiences of deliberations as an independent object of analysis. We define subjective experience as a juror's feelings about her involvement on a deliberating jury, such as feelings of inclusion, self-expression, worthiness, and engagement during the deliberation process. A juror's subjective experience may not align with objective measures of deliberations. For example, a juror may objectively speak more than other jurors but subjectively feel frustrated that other jurors did not understand her position. Thus, subjective experience reveals an underexamined dimension of jury service.
Drawing on status characteristics theory of interpersonal interaction in small group settings, we further argue that researchers should consider whether jurors' subjective experiences of deliberations vary by status group membership. This inquiry, unaddressed by extant jury research, is critical for several reasons. Research on subjective experiences in other institutional contexts suggests that formal incorporation of lower-status groups does not necessarily translate into feelings of inclusion (Jack Reference Jack2014; Evans and Moore Reference Evans and Moore2015). As juries represent a key symbol of US democracy (Diamond and Rose Reference Diamond and Rose2005) and are an important site of public participation (Bradbury and Williams Reference Bradbury and Williams2013), it is important to know whether members of social groups that were historically excluded from jury service (Fukurai and Krooth Reference Fukurai and Krooth2003) feel less a part of deliberations than others despite their increased access. Evidence of disparate subjective experiences of deliberations would indicate not only a lack of social inclusion, but also a potential pathway for shaping jurors' disparate perceptions of the legal system (Diamond Reference Diamond and Litan1993) and may contribute to jurors' legal cynicism (Sampson and Bartusch Reference Sampson and Bartusch1998).
We utilize a unique survey of real-world jurors to advance jury research by examining whether one measure of subjective experience—the extent to which jurors felt they had enough time to express themselves during deliberations—varies by gender, race, and education level. Informed by status characteristics theory, we consider both the independent and interactive relationships between these status characteristics and self-expression, as well as whether any observed differences are accounted for by which jurors held opinions with respect to the verdict that contrasted with those of the majority of their fellow jurors at the start of deliberations. We find that the majority of jurors feel that they had enough time to express themselves during deliberations, but we look beyond jurors' overwhelmingly positive reports to reveal that blacks and Hispanics, and especially blacks and Hispanics of lower education levels, are less likely to feel they had enough time to express themselves relative to whites. Our findings hold after incorporating minority opinion status. Our findings illustrate the intersectionality of subjective experience in real-world interpersonal interaction and have theoretical implications for jury research and status characteristics theory as well as substantive implications for jurors and the US legal system.
In what follows, we first review research on jurors' objective experiences of deliberations within the context of status characteristics theory—a theory that was partially developed by studying mock juries and offers clues to explaining how gender, race, and socioeconomic status (SES) might shape jurors' experiences. We then introduce our concept of subjective experience and explain its significance in relation to jury deliberations. Finally, we draw on status characteristics theory to develop and then test hypotheses regarding jurors' subjective experiences of deliberations.
Jury Deliberations and Status Characteristics Theory
Fundamental to status characteristics theory is the concept of status. Status is a marker of worth that helps determine how individuals and groups are evaluated in terms of esteem and respect (Weber Reference Weber1968). Social categories (such as gender or race) are socially meaningful and historically contingent groupings of individuals that tend to be associated with varying levels of status (Ridgeway Reference Ridgeway1991; Cornell and Hartmann Reference Cornell and Douglas2007). Status characteristics theory posits that status differences between social categories operate in interpersonal interactions (such as when small groups of individuals assemble to accomplish a task) and contribute to macro-level differences in the distribution of symbolic and material resources between groups (Ridgeway Reference Ridgeway2014).
Joseph Berger was among the first to elaborate a theory of why status organizing processes matter in interpersonal interaction. Drawing on findings from mock juries, Berger theorized that varying status characteristics, such as age, gender, race, and class, are associated with evaluations of worth and competence that shape expectations and, in turn, behavior, including deference and the allocation of opportunities to perform (Berger et al. Reference Berger, Fisek, Norman and Zelditch1977). Similarly, research on implicit bias has found that those of lower status tend to internalize dominant status hierarchies against their own group (Jost, Pelham, and Carvallo Reference Jost, Pelham and Carvallo2002). The meanings of status characteristics are not innate, but are learned and reproduced through interpersonal interaction. This involves status generalization, a process by which scant information or beliefs about a given social group are applied to individual members (Meeker and Weitzel-O'Neill Reference Meeker and Weitzel-O'Neill1977; Allport Reference Allport1979).
Following Berger, a host of studies in mostly experimental settings has assessed the consequences of status characteristics for the accumulation of, or inability to access, rewards in interpersonal interaction—including respect, belief in one's competence (Meeker and Weitzel-O'Neill Reference Meeker and Weitzel-O'Neill1977; Correll Reference Correll2004), participation (Berger, Cohen, and Zelditch Reference Berger, Cohen and Zelditch1972), leadership positions (Webster and Driskell Reference Webster and Driskell1978), and verbal and nonverbal influence (Fiske Reference Fiske, Fiske, Gilbert and Lindzey2010). Generally, with regard to each of these dimensions, studies involving small groups working toward a task have consistently shown that within the United States, it is advantageous to be male, of middle age, white, and of a higher social class (Webster and Driskell Reference Webster and Driskell1978; Fiske Reference Fiske, Fiske, Gilbert and Lindzey2010). Although the effects of status characteristics are more pronounced when they are commonly perceived as relevant to the task at hand, given stereotypes associated with certain groups' task-specific abilities (Berger et al. Reference Berger, Fisek, Norman and Zelditch1977; Webster and Driskell Reference Webster and Driskell1978; Correll and Ridgeway Reference Correll, Ridgeway and Delamater2003), status characteristics also shape interpersonal interaction when they are irrelevant to the task at hand (Berger, Cohen, and Zelditch Reference Berger, Cohen and Zelditch1972; Webster and Driskell Reference Webster and Driskell1978).
Given the use of mock juries in the early development of status characteristics theory, it is not surprising that the theory's predictions have largely borne out in jury deliberation studies. These studies have mostly considered jurors' objective experiences, or aspects of jurors' experiences that are measurable through external observation. Because outside parties are legally barred from real-world jury deliberations (Cornwell Reference Cornwell2010), researchers have largely relied on mock juries (for a review, see Devine et al. Reference Devine, Clayton, Dunford, Seying and Pryce2001) or, more recently, surveys of jurors following real-world deliberations (York and Cornwell Reference York and Cornwell2006; Farrell, Pennington, and Cronin Reference Farrell, Pennington and Cronin2013) to investigate how jurors' objective experiences vary by status characteristics. These studies use measures such as observed participation rates, influence nominations of other jurors, and likelihood of changing one's vote after deliberating. Findings with respect to class have been in line with status characteristics theory, whereas findings with respect to gender and race/ethnicity have been mixed in the jury setting.
With respect to social class, some of the earliest studies found that whites with higher levels of education (James Reference James1959) or greater occupational prestige (Strodtbeck, James, and Hawkins Reference Strodtbeck, James and Hawkins1957) participated more in mock jury deliberations than whites of lower status. Hastie, Penrod, and Pennington (Reference Hastie, Penrod and Pennington1983) further found that more educated jurors and those of higher occupational status participated more frequently and also contributed more to the number of legal issues and case facts discussed. A small number of more recent studies has confirmed that education and occupation shape participation rates, controlling for race and other juror- and case-level characteristics. York and Cornwell (Reference York and Cornwell2006), using postdeliberation survey data of real-world jurors in Massachusetts, find that jurors of higher social class are rated by other jurors as more influential and as having participated more during deliberations, relative to their lower-class peers. Moreover, other recent studies of real-world jurors have found that those with higher levels of education report having participated more during deliberations (Moran and Comfort Reference Moran and Comfort1982; Cornwell and Hans Reference Cornwell and Hans2011).
With respect to gender, while studies from the 1950s and later found that men tended to exhibit leadership roles (Strodtbeck and Mann Reference Strodtbeck and Mann1956) and participated more in mock juries than women (Strodtbeck, James, and Hawkins Reference Strodtbeck, James and Hawkins1957; James Reference James1959; Hastie, Penrod, and Pennington Reference Hastie, Penrod and Pennington1983), more recent studies have not found a significant difference between men's and women's participation. Cornwell and Hans (Reference Cornwell and Hans2011), using the same data set of real-world jurors used here, find that gender is not significantly associated with differences in self-reported participation rates. And York and Cornwell (Reference York and Cornwell2006) find that gender is not significantly associated with differences in fellow jurors' perceived influence.
With respect to race and ethnicity, although early studies relied on all-white juries, a small number of recent studies have indicated contradictory findings. York and Cornwell (Reference York and Cornwell2006) find null results with respect to race and fellow jurors' perceived influence, controlling for other juror characteristics, including social class, but Cornwell and Hans (Reference Cornwell and Hans2011) find that blacks report having participated more during deliberations than whites and members of other racial/ethnic groups. The authors note the surprising nature of these findings and conclude that more research is needed in order to understand how race and ethnicity shape the deliberation process. Meanwhile, Lynch and Haney (Reference Lynch and Haney2015) examine the role of emotions in mock capital jury deliberations and observe that white male jurors tend to assert emotional authority during deliberations by both proclaiming their own emotional responses and monitoring the emotional expressions of others. Although the authors do not disentangle this finding in relation to jurors' gender and race, in line with status characteristics theory, it suggests the possibility of racial differences in authority during the deliberation process. Finally, Rose (Reference Rose and Sandefur2009) and Hunt (Reference Hunt2015) cite unpublished findings based on data from real-world civil jury deliberations in Arizona (Diamond et al. Reference Diamond, Vidmar, Rose and Ellis2003) that whites speak more during deliberations than members of other racial/ethnic groups.
Extant jury deliberation research generally considers one status characteristic at a time while controlling for the others. Yet, the effects of multiple status characteristics on interpersonal interaction may not be simply additive (Pettigrew Reference Pettigrew1981; Crenshaw Reference Crenshaw1991; McCall Reference McCall2005). According to status characteristics theory, individuals tend to form “aggregated performance expectations” of others based on their multiple status characteristics. This occurs both when multiple status characteristics are simultaneously salient given the task at hand (Ridgeway and Smith-Lovin Reference Ridgeway and Smith-Lovin1999) and when some are relevant to the particular situation and others are not, but are generally accepted markers of status (Balkwell and Berger Reference Balkwell and Berger1996). These aggregated expectations are formed outside of conscious thought, but lead to behavior that empirically suggests that additional consistent information has declining marginal impact, whereas inconsistent information tends to carry more weight (Correll and Ridgeway Reference Correll, Ridgeway and Delamater2003). For example, the status gain a white man would receive from others learning he is also a physician would not be as large as the status gain a black woman would receive from the same information. It is, therefore, important to considerer intersecting social categories in order to understand fully how status characteristics shape jury deliberations. We return to this insight when we develop our hypotheses below.
Jurors' Well-Being: From Objective to Subjective Experience
As we have noted, jury deliberation research tends to focus on individuals' objective experiences of deliberations—aspects of jurors' experiences that are measurable through external observation. This perspective considers jurors' roles in shaping the deliberation process through their perceived influence, persuasion, or participation rates, often with an eye toward explaining juries' ultimate verdicts (Rose Reference Rose and Sandefur2009). We argue that in addition to considering objective experience, researchers should consider whether subjective experiences of deliberations vary by gender, race, and/or SES, with an eye toward understanding jury deliberation as an important social and political experience for jurors (Bradbury and Williams Reference Bradbury and Williams2013).
We define subjective experience as a juror's feelings about her involvement on a deliberating jury, especially feelings of inclusion, self-expression, worthiness, and engagement as a member of a deliberative body. High levels of participation (an objective measure of experience) may mask lower levels of self-expression (a subjective measure) if a juror is participating more than her peers because she feels her points are not being given their proper due. Objective experience and subjective experience are, therefore, distinct constructs that reveal different processes through which inequalities in jurors' experiences may be produced.
Extant research on jurors' subjective experiences tends to focus on jurors' satisfaction with the jury selection process (Rose Reference Rose2005), stress, anxiety, or hardships associated with various aspects of jury service (Cutler and Hughes Reference Cutler and Hughes2001; Miller and Bornstein Reference Miller and Bornstein2004; Brower Reference Brower2010), or jurors' willingness to serve again (Diamond Reference Diamond and Litan1993; Rose Reference Rose2005). Very few studies have considered jurors' subjective experiences of deliberations, and those that have do not address the extent to which such experiences vary by status characteristics. For example, in their study of jurors in King County, Washington, Gastil et al. (Reference Gastil, Pierre Deess, Weiser and Simmons2010) find that jurors' feelings that other jurors “gave me enough of a chance to express my opinions” are significantly correlated with jurors' overall satisfaction with deliberations, but not with jurors' overall satisfaction with their juries' verdicts. Although the authors do not consider whether their subjective measures vary by status characteristics, they do further find that variation in jurors' levels of satisfaction significantly relates to variations in civic outcomes, such as increased attention to news media and increased community group participation. In a study of civil juries in Arizona, Antonio and Hans (Reference Antonio, Hans, Roesch, Corrado and Dempster2001) find that racial minorities and Hispanics were less satisfied with their jury deliberations than whites. However, their study sample was not large enough to examine blacks' and Hispanics' satisfaction independently.
Our lack of knowledge regarding jurors' subjective experiences of deliberations and whether such experiences vary by status characteristics is a critical limitation of jury deliberations research. Research on formerly marginalized groups in other institutional contexts has revealed how formal incorporation does not always translate into feelings of inclusion (Jack Reference Jack2014; Evans and Moore Reference Evans and Moore2015). Such research has highlighted the emotional and psychological burdens carried by members of historically marginalized groups as they navigate perceived discrimination while, at the same time, they need to participate in dominant institutional cultures (Clair and Denis Reference Clair, Denis and Wright2015; Evans and Moore Reference Evans and Moore2015; Lamont et al. Reference Lamont, Silva, Welburn, Guetzkow, Mizrachi, Herzog and Reis2016). Given historical discrimination against nonwhite, nonmale, and poor citizens in jury selection (Fukurai and Krooth Reference Fukurai and Krooth2003), it is important to consider whether similar processes are at work in the context of jury deliberations. Furthermore, juries are often idealized as potential sites for democratic participation (Diamond and Rose Reference Diamond and Rose2005; Bradbury and Williams Reference Bradbury and Williams2013) and, as noted above, positive subjective experiences of deliberations have been found to shape subsequent civic engagement (Gastil et al. Reference Gastil, Pierre Deess, Weiser and Simmons2010). Disparate subjective experiences of jury deliberations by status characteristics could, therefore, carry consequences for disparate civic engagement.
Negative subjective experiences of jury deliberations might also contribute to jurors' legal cynicism. Legal cynicism refers to “a cultural orientation in which the law and the agents of its enforcement, such as the police and courts, are viewed as illegitimate, unresponsive, and ill equipped to ensure public safety” (Kirk and Papachristos Reference Kirk and Papachristos2011, 1191).Footnote 1 While legal cynicism is traditionally conceived of as arising from differential structural conditions as well as police interactions at the neighborhood level (Sampson and Bartusch Reference Sampson and Bartusch1998; Kirk and Papachristos Reference Kirk and Papachristos2011), it may be subsequently transmitted through interpersonal interaction (Kirk and Papachristos Reference Kirk and Papachristos2011). We contend that interactions with courthouse legal proceedings, including jury deliberations, are additional sites in which legal cynicism may arise.
Prior research has shown that, on average, relative to whites, blacks and Hispanics have increased perceptions of criminal injustice (Hagan, Shedd, and Payne Reference Hagan, Shedd and Payne2005) in relation to the police (Weitzer and Tuch Reference Weitzer and Tuch2005) and the courts (Brooks and Jeon-Slaughter Reference Brooks and Jeon-Slaughter2001; Overby et al. Reference Overby, Brown, Bruce, Smith and Winkle2005) and are more likely to perceive the criminal justice system as racially biased (Bobo and Johnson Reference Bobo and Johnson2004; Bobo and Thompson Reference Bobo and Thompson2006), largely due to greater contact with the legal system (Hagan, Shedd, and Payne Reference Hagan, Shedd and Payne2005; Weitzer and Tuch Reference Weitzer and Tuch2005; Muller and Schrage Reference Muller and Schrage2014). Jury deliberations may be yet another site in which these differential views are perpetuated (Diamond Reference Diamond and Litan1993), as blacks express less willingness to serve on a jury than whites, even controlling for prior jury experience (Musick et al. Reference Musick, Rose, Dury and Rose2015). In sum, a consideration of whether subjective experiences of jury deliberations vary by status characteristics contributes to our understandings of trust in legal institutions and of juries as an inclusionary deliberative body.
Hypotheses
Status characteristics theory suggests that members of lower-status social groups would be expected to have lower-quality subjective experiences of jury deliberations than their higher-status peers. Moreover, given that courthouses are largely structured by taken-for-granted middle-class norms (Feeley Reference Feeley1992) and the task-relevant competencies of deliberation involve verbal reasoning styles that have been found to favor higher-status groups in multiple other settings (Bourdieu Reference Bourdieu1984; Lareau Reference Lareau2002; Fiske and Markus Reference Fiske and Markus2012), the jury context would further suggest that those of lower status would have lower-quality subjective experiences.
We, therefore, hypothesize that women are less likely to feel positive about their experiences of jury deliberations relative to men, that blacks and Hispanics are less likely to feel positive about their experiences relative to whites, and that those with lower levels of education are less likely to feel positive about their experiences relative to those with higher levels of education. Education is one dimension of SES (Fiske and Markus Reference Fiske and Markus2012) that is read by others relatively quickly (Fiske Reference Fiske, Fiske, Gilbert and Lindzey2010).Footnote 2 While education level may be considered relevant to the task of deliberating on a jury, its relationship to jurors' subjective experiences may vary by gender and/or race/ethnicity, leading to our second set of hypotheses.
Given extant findings in the broader status characteristics theory literature regarding the joint effects of multiple status characteristics, we hypothesize that the negative effect of race/ethnicity is amplified among women. We also hypothesize that the negative effects of race/ethnicity and of being female are amplified among those with lower levels of education. Similarly, we would expect the effect of education to be stronger for minorities than for whites, since blacks have been shown to be stereotyped as lower income and less educated in experimental settings (Correll and Ridgeway Reference Correll, Ridgeway and Delamater2003).
Data, Measures, and Method
Data
To evaluate jurors' subjective experiences, we use the “Evaluation of Hung Juries in Bronx County, New York, Los Angeles County, California, Maricopa County, Arizona, and Washington, DC, 2000–2001” data set collected by the National Center for State Courts. The data set includes approximately 350 noncapital felony jury cases that are evenly distributed across the four named sites. The sites were selected based on their volume of cases, the willingness of court personnel to cooperate, and their relevance for the investigation of hung jury rates, which was the original purpose of the data collection (Hannaford-Agor et al. Reference Hannaford-Agor, Hans, Mott and Thomas Munsterman2002). Having data from four court districts allows us to improve on prior studies' reliance on single contexts. Moreover, having data from real-world juries improves on extant jury deliberation studies' reliance on experimental settings (Devine Reference Devine2012), which may lack external validity by failing to simulate settings that conjure the psychological states subjects would experience in real-world courtrooms (Diamond and Rose Reference Diamond and Rose2005).
The data set, despite its name, includes data collected from all courtrooms at each site hearing noncapital felony cases for a period of a few months. Researchers distributed questionnaire packets, which included a form, filled out by either the judge or a court officer, that asked for information regarding the characteristics of the case as well as survey questionnaires for the judge, attorneys, and jurors. Accordingly, the data set contains a wealth of information on each case, including the demographic characteristics of the victim(s), defendant(s), and jurors, and jurors' opinions regarding the cases and their juries' deliberations. The large and diverse sample of the “Hung Juries” data set allows us to examine differences by race/ethnicity, which previous studies have lacked the capacity to do (Sommers and Ellsworth Reference Sommers and Ellsworth2003). Additionally, the juror surveys were completed immediately following the juries' deliveries of their verdicts, improving the quality of the information collected relative to some other studies that have utilized surveys that were filled out days, if not weeks, later (Mills and Bohannon Reference Mills and Bohannon1980).
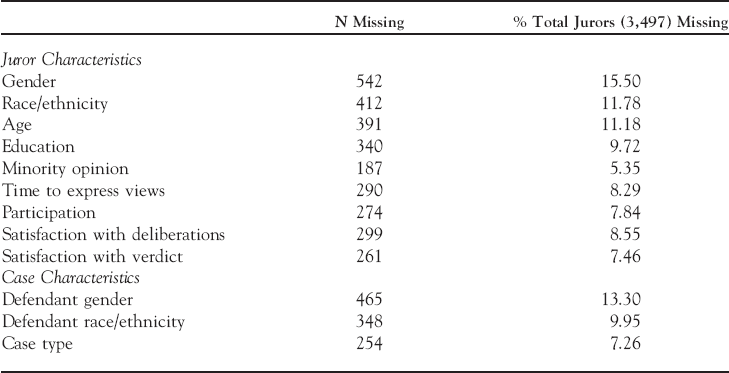
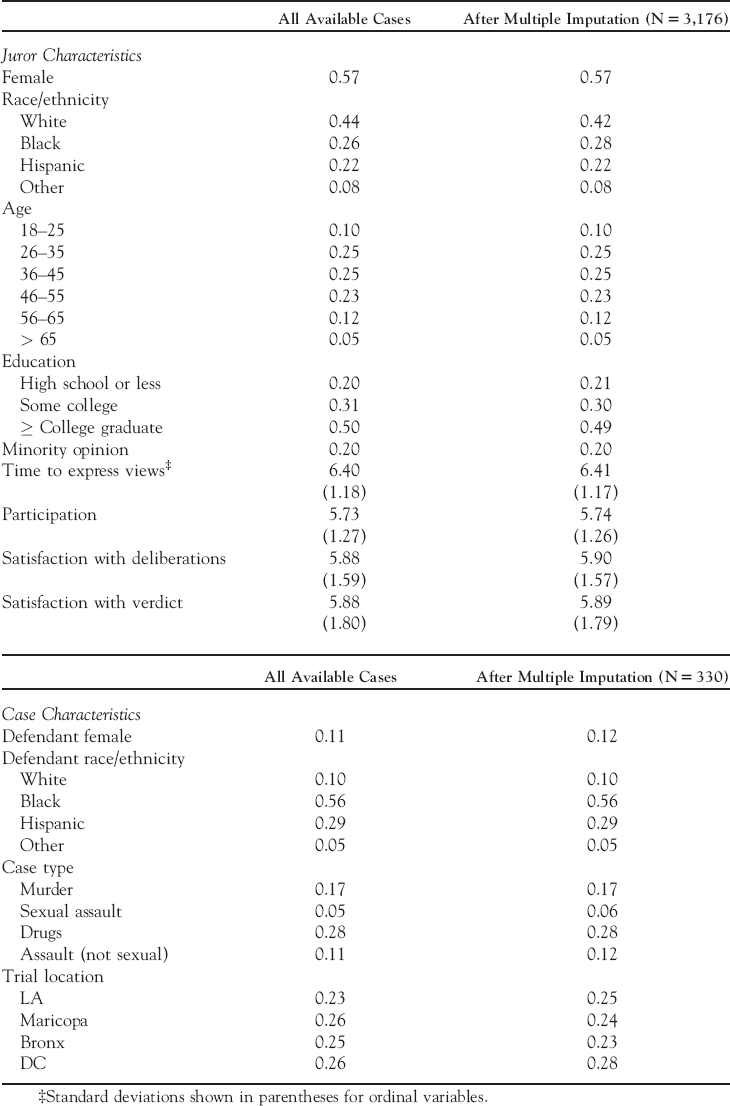
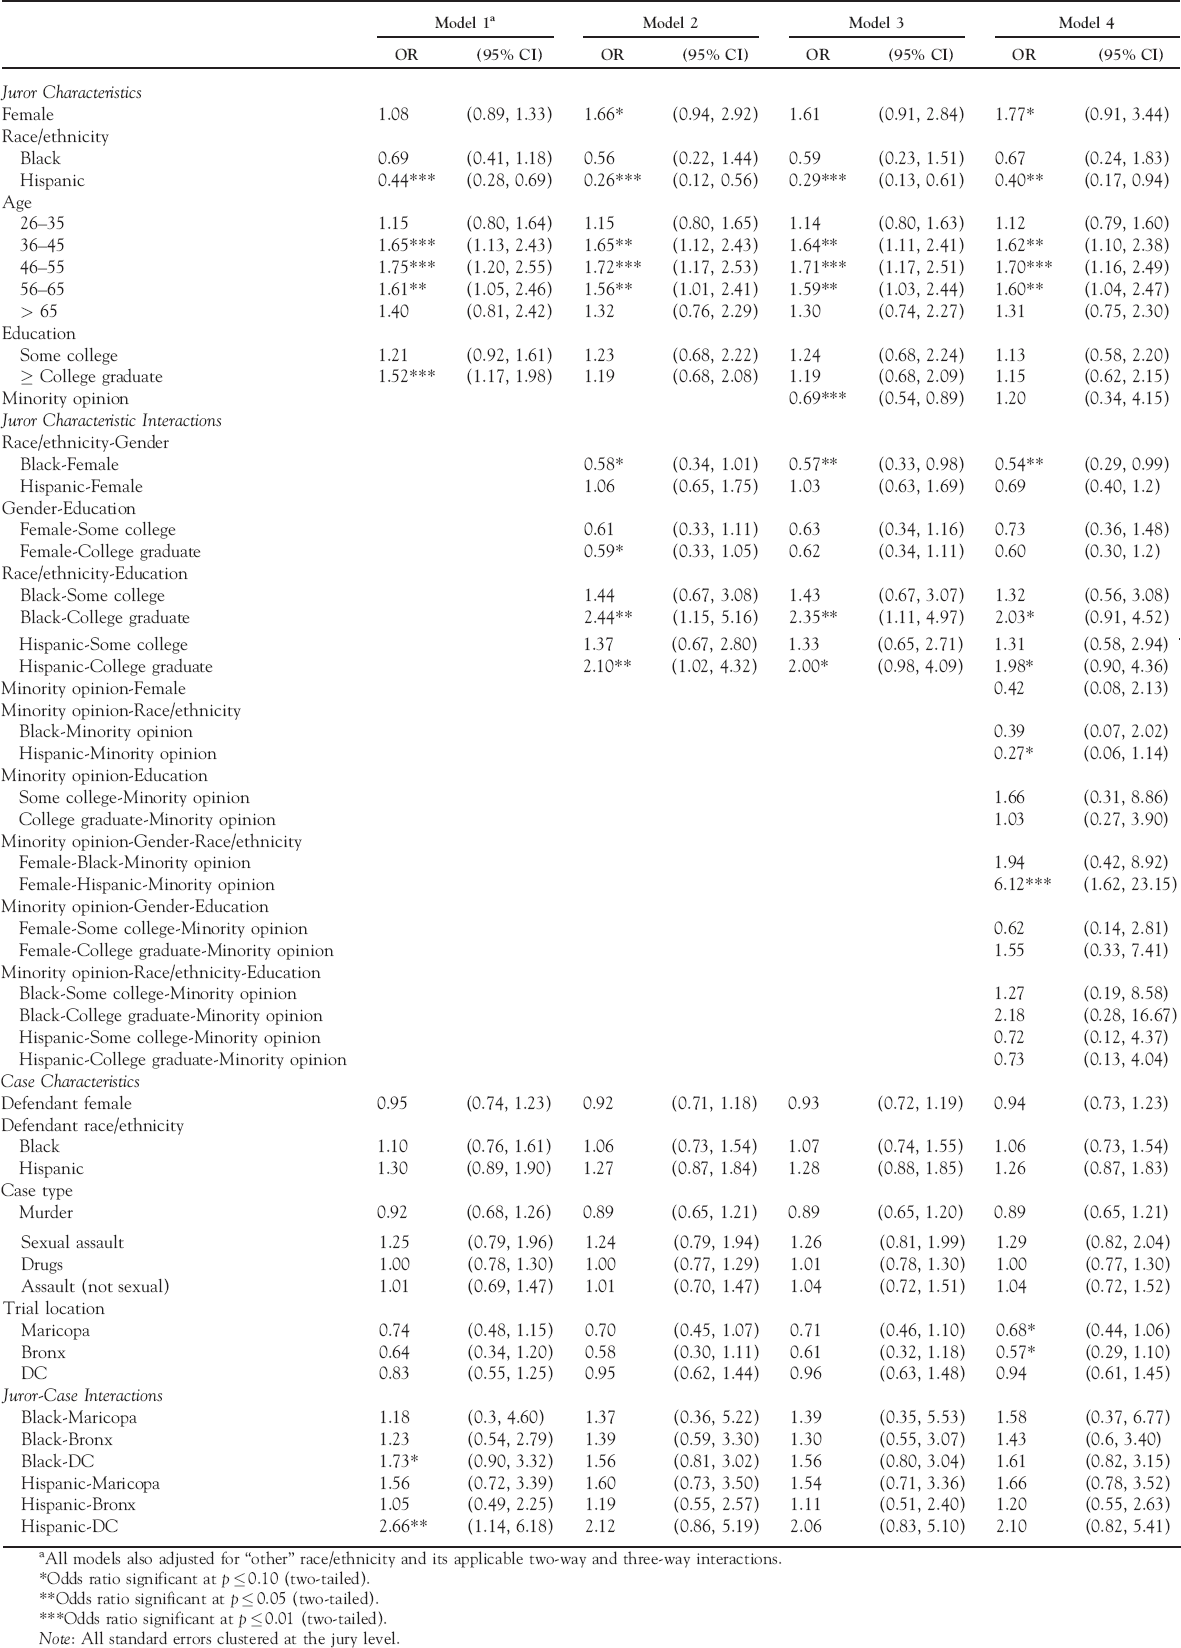
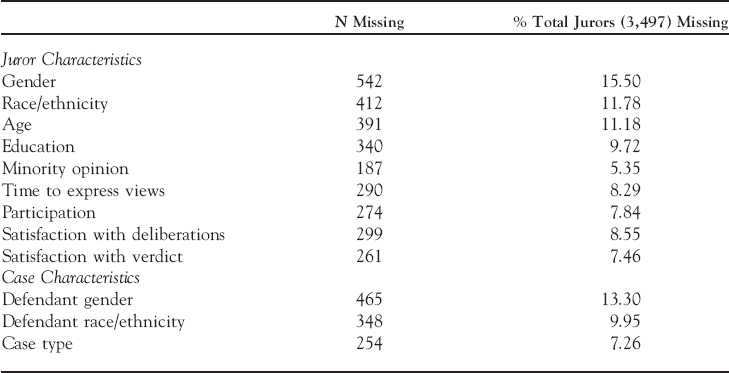
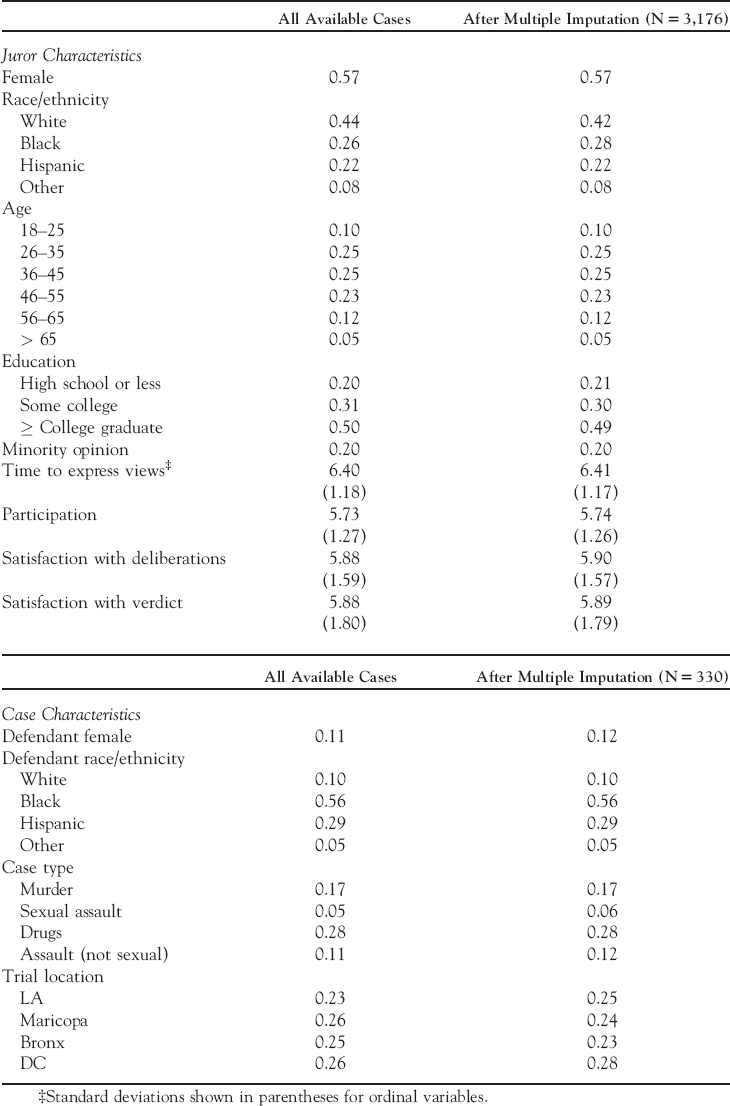
Missing data at the individual and case levels (Appendix Table A1) are not patterned by observable measures and were multiply imputed using chained equations (see the Appendix). Although our dependent variable of interest was included in the imputation model to avoid model misspecification, we do not use imputed values of the dependent variable in our analyses (White, Royston, and Wood Reference White, Royston and Wood2011), leaving us with a data set of 2,931 jurors from 328 cases (83.8 percent and 93.4 percent of the complete data set, respectively). These jurors very closely resemble the complete sample after multiple imputation as well as the samples of individuals and cases with available information for each variable prior to imputation (Appendix Table A2).
Variables
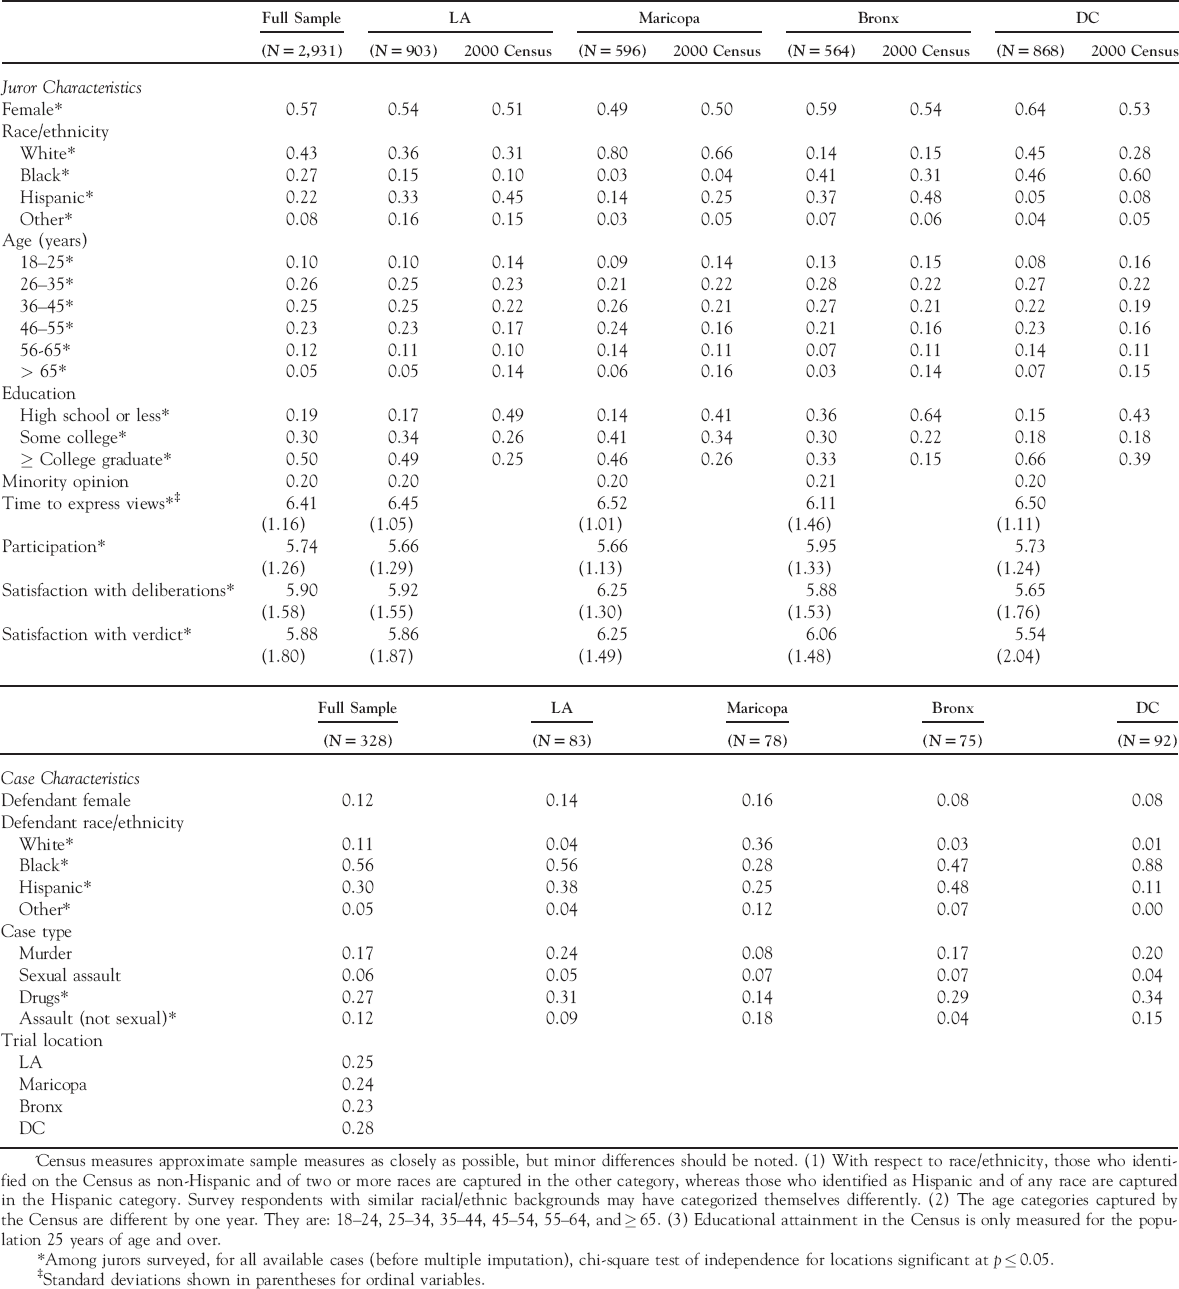
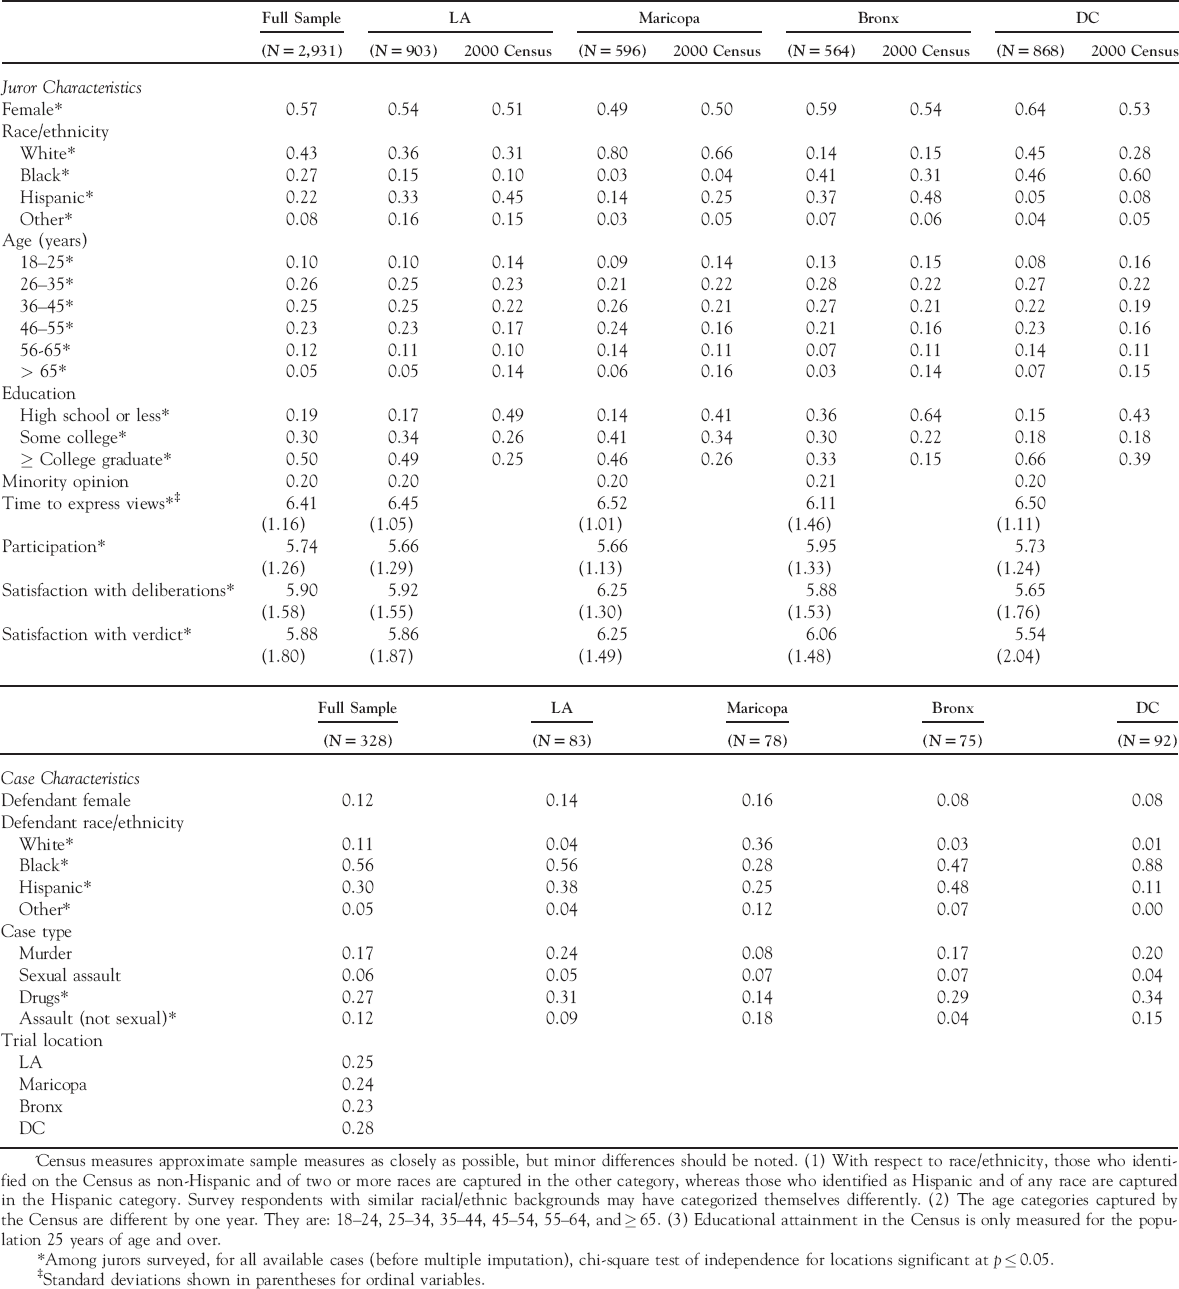
Table 1 provides descriptive statistics for our analytic sample stratified by location as well as comparable individual-level information for each location from the 2000 Decennial Census. Our dependent variable, self-expression, captures one aspect of subjective experience. This variable is based on the survey question: “Do you feel that you had enough time to express your views during jury deliberations?” Respondents recorded their answers on a scale ranging from 1, “definitely no,” to 7, “definitely yes.” Self-expression is different from overall satisfaction (a broader measure that may or may not capture jurors' feelings of having expressed themselves to the extent that they would have liked) as well as from self-rated participation (which may not reflect the quality of their participation, or the extent to which they feel they conveyed the information they desired to).Footnote 3
Descriptive Statistics (Means) for Jurors Surveyed After Multiple Imputation and from the 2000 Decennial Census^
| Full Sample | LA | Maricopa | Bronx | DC | |||||
|---|---|---|---|---|---|---|---|---|---|
| (N=2,931) | (N=903) | 2000 Census | (N=596) | 2000 Census | (N=564) | 2000 Census | (N=868) | 2000 Census | |
| Juror Characteristics | |||||||||
| Female* | 0.57 | 0.54 | 0.51 | 0.49 | 0.50 | 0.59 | 0.54 | 0.64 | 0.53 |
| Race/ethnicity | |||||||||
| White* | 0.43 | 0.36 | 0.31 | 0.80 | 0.66 | 0.14 | 0.15 | 0.45 | 0.28 |
| Black* | 0.27 | 0.15 | 0.10 | 0.03 | 0.04 | 0.41 | 0.31 | 0.46 | 0.60 |
| Hispanic* | 0.22 | 0.33 | 0.45 | 0.14 | 0.25 | 0.37 | 0.48 | 0.05 | 0.08 |
| Other* | 0.08 | 0.16 | 0.15 | 0.03 | 0.05 | 0.07 | 0.06 | 0.04 | 0.05 |
| Age (years) | |||||||||
| 18–25* | 0.10 | 0.10 | 0.14 | 0.09 | 0.14 | 0.13 | 0.15 | 0.08 | 0.16 |
| 26–35* | 0.26 | 0.25 | 0.23 | 0.21 | 0.22 | 0.28 | 0.22 | 0.27 | 0.22 |
| 36–45* | 0.25 | 0.25 | 0.22 | 0.26 | 0.21 | 0.27 | 0.21 | 0.22 | 0.19 |
| 46–55* | 0.23 | 0.23 | 0.17 | 0.24 | 0.16 | 0.21 | 0.16 | 0.23 | 0.16 |
| 56-65* | 0.12 | 0.11 | 0.10 | 0.14 | 0.11 | 0.07 | 0.11 | 0.14 | 0.11 |
| > 65* | 0.05 | 0.05 | 0.14 | 0.06 | 0.16 | 0.03 | 0.14 | 0.07 | 0.15 |
| Education | |||||||||
| High school or less* | 0.19 | 0.17 | 0.49 | 0.14 | 0.41 | 0.36 | 0.64 | 0.15 | 0.43 |
| Some college* | 0.30 | 0.34 | 0.26 | 0.41 | 0.34 | 0.30 | 0.22 | 0.18 | 0.18 |
| ≥ College graduate* | 0.50 | 0.49 | 0.25 | 0.46 | 0.26 | 0.33 | 0.15 | 0.66 | 0.39 |
| Minority opinion | 0.20 | 0.20 | 0.20 | 0.21 | 0.20 | ||||
| Time to express views* ‡ | 6.41 | 6.45 | 6.52 | 6.11 | 6.50 | ||||
| (1.16) | (1.05) | (1.01) | (1.46) | (1.11) | |||||
| Participation* | 5.74 | 5.66 | 5.66 | 5.95 | 5.73 | ||||
| (1.26) | (1.29) | (1.13) | (1.33) | (1.24) | |||||
| Satisfaction with deliberations* | 5.90 | 5.92 | 6.25 | 5.88 | 5.65 | ||||
| (1.58) | (1.55) | (1.30) | (1.53) | (1.76) | |||||
| Satisfaction with verdict* | 5.88 | 5.86 | 6.25 | 6.06 | 5.54 | ||||
| (1.80) | (1.87) | (1.49) | (1.48) | (2.04) | |||||
| Full Sample | LA | Maricopa | Bronx | DC | |
|---|---|---|---|---|---|
| (N=328) | (N=83) | (N=78) | (N=75) | (N=92) | |
| Case Characteristics | |||||
| Defendant female | 0.12 | 0.14 | 0.16 | 0.08 | 0.08 |
| Defendant race/ethnicity | |||||
| White* | 0.11 | 0.04 | 0.36 | 0.03 | 0.01 |
| Black* | 0.56 | 0.56 | 0.28 | 0.47 | 0.88 |
| Hispanic* | 0.30 | 0.38 | 0.25 | 0.48 | 0.11 |
| Other* | 0.05 | 0.04 | 0.12 | 0.07 | 0.00 |
| Case type | |||||
| Murder | 0.17 | 0.24 | 0.08 | 0.17 | 0.20 |
| Sexual assault | 0.06 | 0.05 | 0.07 | 0.07 | 0.04 |
| Drugs* | 0.27 | 0.31 | 0.14 | 0.29 | 0.34 |
| Assault (not sexual)* | 0.12 | 0.09 | 0.18 | 0.04 | 0.15 |
| Trial location | |||||
| LA | 0.25 | ||||
| Maricopa | 0.24 | ||||
| Bronx | 0.23 | ||||
| DC | 0.28 |
^ Census measures approximate sample measures as closely as possible, but minor differences should be noted. (1) With respect to race/ethnicity, those who identified on the Census as non-Hispanic and of two or more races are captured in the other category, whereas those who identified as Hispanic and of any race are captured in the Hispanic category. Survey respondents with similar racial/ethnic backgrounds may have categorized themselves differently. (2) The age categories captured by the Census are different by one year. They are: 18–24, 25–34, 35–44, 45–54, 55–64, and≥65. (3) Educational attainment in the Census is only measured for the population 25 years of age and over.
* Among jurors surveyed, for all available cases (before multiple imputation), chi-square test of independence for locations significant at p≤0.05.
‡ Standard deviations shown in parentheses for ordinal variables.
Our independent variables that indicate status characteristics are gender, race/ethnicity, and education level. Gender is operationalized as a dummy variable that indicates jurors who categorized themselves as female, as opposed to male. With respect to race/ethnicity, jurors were asked to choose between black/African American, white/Caucasian, white/Hispanic, nonwhite/Hispanic, Native American, Asian/Pacific Islander, and other. We group those who chose white/Hispanic and nonwhite/Hispanic into an Hispanic category and those who chose Native American, Asian/Pacific Islander, or other into an other category, due to the latter's small sample sizes.Footnote 4 Our sample is particularly diverse with regard to race/ethnicity, as only 43 percent of the overall sample identifies as non-Hispanic white. Education is measured categorically (high school graduate or less; some college; and college graduate or more), as is age (18–25 years; 26–35 years; 36–45 years; 46–55 years; 56–65 years; and greater than 65 years).Footnote 5
To account for the possibility that relationships between jurors' status characteristics and their self-expression are attributable to jurors' differential beliefs about the facts of cases, we also consider whether a juror held a minority opinion in relation to the verdict preferences of her fellow jurors at the start of deliberations. This variable is a constructed indicator based on the survey question: “Before you began deliberating with your fellow jurors at the end of the trial (after all of the evidence and the judge's instructions had been presented), which side did you favor?” Respondents recorded their answers on a scale ranging from 1, “prosecution strongly favored,” to 7, “defense strongly favored.” We first categorized jurors as proprosecution (ratings of 1 or 2), neutral (ratings of 3, 4, or 5), or prodefense (ratings of 6 or 7). Jurors were then categorized as having held a minority opinion if they held an opinion that differed from that of the majority of jurors on their jury (at least 50 percent).Footnote 6
We also include a number of control variables that are measured at the case level. First, we control for defendant gender and race/ethnicity to address the possibility that these characteristics influence which jurors lawyers choose to empanel and also those jurors' experiences during deliberations. Since cases may have multiple defendants, the defendant gender and race/ethnicity variables indicate whether at least one defendant of the given gender or racial/ethnic group was present.Footnote 7 Second, we control for the type of case because opinion formation with regard to crime and punishment tends to differ by race as well as by the nature of the crime (Bobo and Johnson Reference Bobo and Johnson2004) and may, therefore, relate to jurors' experiences regarding their abilities to express themselves. Dummy variables indicate whether each case involved murder, sexual assault or rape, drugs, or a nonsexual assault. These categories group together crimes for which jurors' biases or predisposed attitudes are likely to be similar. The reference category includes robbery, larceny, and driving under the influence.
Finally, in order to identify whether our dependent variable is a unique measure of subjective experience, we consider the relationships between our dependent variable and three other measures of jurors' subjective experiences of their jury service: self-rated participation during deliberations (“How much did you participate in the jury deliberations?”), overall satisfaction with the jury's deliberations (“How satisfied were you with the jury's deliberations?”), and satisfaction with the jury's verdict (“How satisfied were you with the jury's decision [guilty, not guilty, hung]?”). Respondents recorded their answers to each of these questions on a scale ranging from 1 to 7, with higher numbers indicating a more positive response.
Variation by Site
Table 1 reveals substantial variation across the four locations in the demographic compositions of both jurors and defendants in our sample. Maricopa has the lowest proportion of women jurors, the highest proportion of white jurors, and relatively few minority jurors, whereas the Bronx has the smallest proportion of white and greater proportions of black and Hispanic jurors. DC is predominantly comprised of white and black jurors, whereas Los Angeles (LA) is predominantly comprised of white and Hispanic jurors, but also has a substantial proportion of black jurors. Jurors in the Bronx have lower levels of education, whereas jurors in DC are more highly educated than jurors in the other locations. We address these differences between the sites in our regression models, as described below.
In general, the jurors in our sample appear more likely to be women, white, in their mid-forties to mid-fifties, and more highly educated relative to their local populations. Such discrepancies might arise at various stages of the jury selection process, including the composition of juror registries, the delivery of jury duty summonses, and the courtroom selection process (Fukurai and Krooth Reference Fukurai and Krooth2003).
Analytic Strategy
To examine the relationships between jurors' self-expression during deliberations and alternate measures of jurors' subjective experiences, we calculate correlations and Cronbach's alpha. Our dependent variable is measured on an ordinal scale and is not normally distributed. Therefore, after examining its bivariate relationships with our status characteristics of interest (gender, race/ethnicity, and education), our primary analyses consist of ordered logistic regression models. Since our data include jurors nested within juries, we cluster the standard errors to account for the nonindependence of jurors within juries.Footnote 8 The equation below presents our analytic model for testing our hypotheses.

We first examine the relationship between our dependent variable (y ij ), jurors' ratings of the extent to which they felt they had enough time to express themselves, and the additive effects of jurors' status characteristics (gender, race/ethnicity, and education) as well as age (x ij ), controlling, at the group level, for (w j ) the defendant's gender and race/ethnicity, the type of case, and the site at which the trial took place. The latter is a proxy for the differential demographic compositions of the different sites as well as any other between-site differences.Footnote 9 We also include a set of interaction terms (z ij g j ) between juror race/ethnicity and the locations in order to account for the possibility that the effects of race/ethnicity are different in different jurisdictions (Harris, Evans, and Beckett Reference Harris, Evans and Beckett2011).Footnote 10
We then run a second model to test our hypotheses that individuals' combinations of status characteristics affect their experiences as jurors. This model includes interaction terms (δijtij ) between race/ethnicity and gender, education and gender, and race/ethnicity and education.
Finally, we run a second set of models that incorporates an indicator for which jurors held minority opinions at the start of deliberations. We first simply add an individual-level indicator of minority opinion status to the second model described above, and then add interactions between minority opinion status and each of our measured status characteristics as well as three-way interactions between minority opinion status and the individual-level interaction terms described above. To facilitate interpretation of our results given the interaction terms, we calculate predicted probabilities of responding to whether one had enough time to express oneself with a “definitely yes” for select status groups.
Findings
Before proceeding with our primary analyses, we first test whether self-expression—our measure of subjective experience—is distinct from other measures of jurors' subjective experiences. We compare self-expression to jurors' self-rated participation, overall satisfaction with the jury's deliberations, and satisfaction with the jury's final verdict. Table 2 shows that the correlations between the extent to which jurors felt they had enough time to express themselves and each of these measures are relatively low. For example, of those who reported definitely (7) having had enough time to express themselves, only 39 percent reported having participated a great deal (7) (not shown), and of those who rated their self-expression with a 4, 21 percent rated their participation with a 7. Additionally, Cronbach's alpha between the extent to which jurors felt they had enough time to express themselves and each of these measures is quite low (Table 2), indicating that these measures are indeed measuring different constructs. Therefore, whereas each of these aspects of subjective jury experience is important to consider and they are positively associated with one another, they are each measuring a distinct aspect of jurors' subjective experiences.Footnote 11
Relationships Between Jurors' Self-Expression and Additional Measures of Jurors' Subjective Experiences

| Participation | Satisfaction with Deliberations | Satisfaction with Verdict | |
|---|---|---|---|
| Correlation | 0.20 | 0.31 | 0.21 |
| Cronbach's alpha | 0.32 | 0.46 | 0.31 |
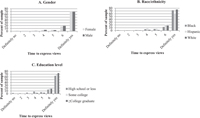
We now turn to our primary analyses and first look descriptively at the bivariate relationships between self-expression and our status characteristics of interest (Figure 1). Overall, the majority of jurors (71 percent) selected the highest possible rating, indicating that they felt they definitely had enough time to express their views during jury deliberations. This descriptive finding that most individuals feel they are able to express themselves within the context of jury deliberations is affirming.
Distributions of Jurors' Self-Report of Having Had Time to Express Their Views During Deliberations, by Status Characteristics
Note: Since it is not possible to calculate frequencies based on imputed data, frequencies were calculated for the full available sample for each status characteristic prior to multiple imputation.
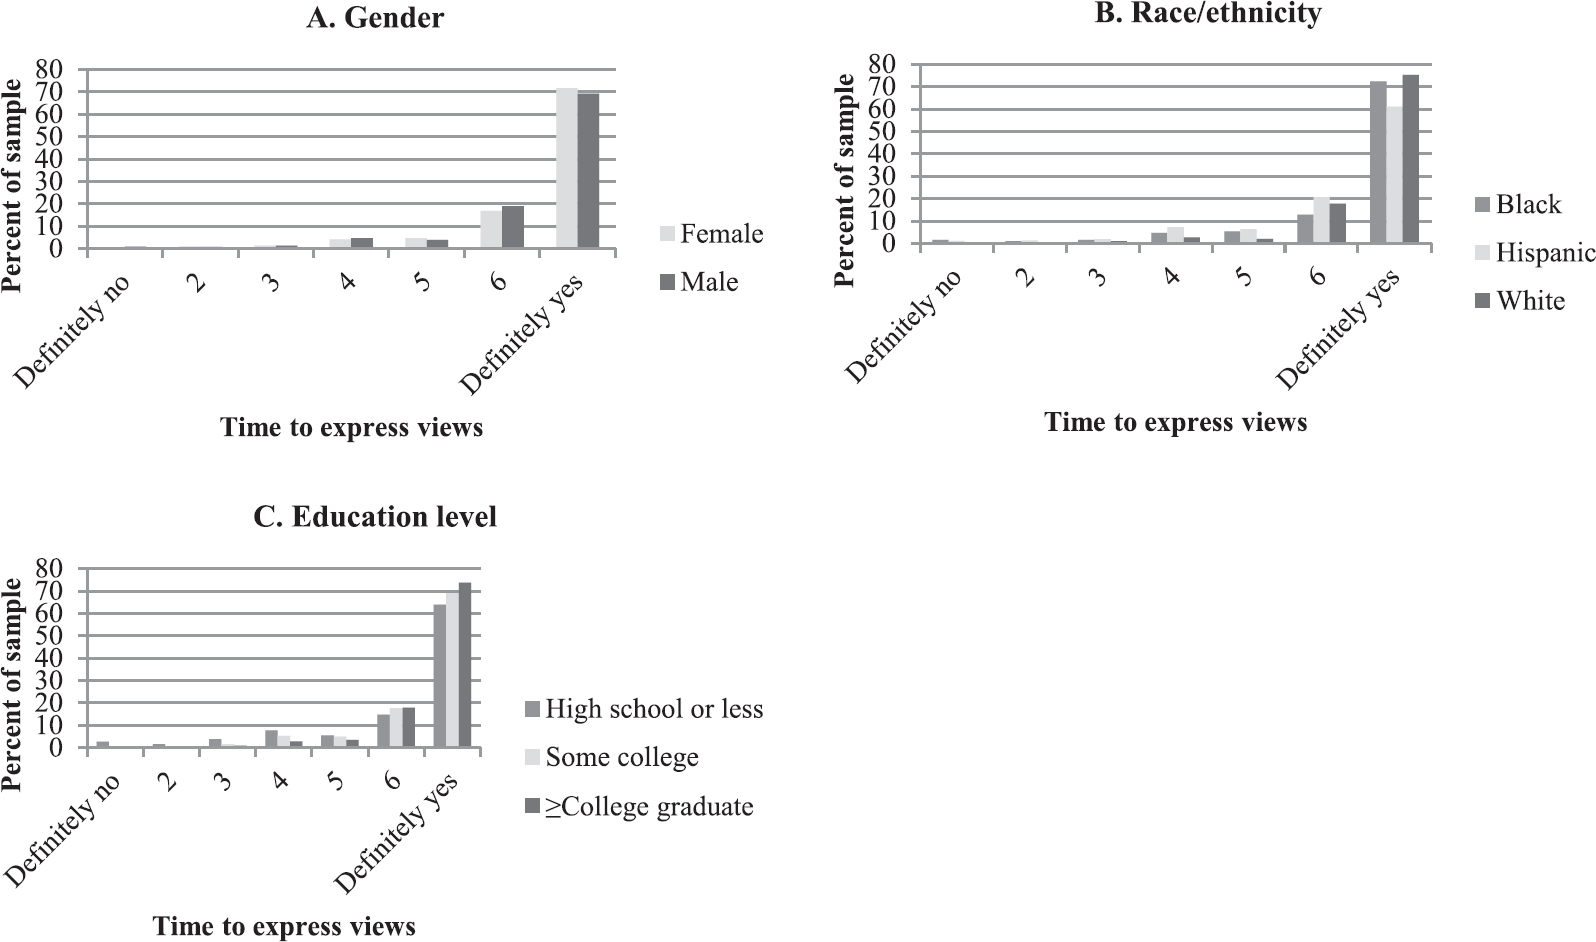
The difference between checking 7 versus a lower number on the scale might be conceptualized as the difference between a positively affirmative response and some amount of hesitance in whether one felt one had enough time to express oneself. In an ideal world, all respondents would have chosen the highest possible rating, or the distribution of those who did not would at least be unrelated to status characteristics. However, Figure 1 shows apparent differences between some status groups in who selected the highest option as well as in the distributions of respondents among the rest of the answer choices. With respect to gender, there do not appear to be large differences, as slightly more women than men selected the highest option, but slightly more men than women selected the next highest option. The rest of the distribution is fairly even (Panel A).
With respect to race/ethnicity, whereas blacks and whites selected the highest option in similar proportions, fewer Hispanics did (Panel B of Figure 1). Following from this observation, although the distribution for Hispanics is skewed in the same manner as it is for the full sample, more Hispanics are distributed throughout the tail relative to whites. This is also true of blacks, to a lesser extent. With respect to education, Panel C shows that education exhibits a clear gradient, with the greatest proportion of those with at least a college education feeling as if they had enough time to express themselves and those with a high school education or less more dispersed throughout the distribution. Chi-squared tests confirm that the observed differences in Panels B and C with respect to race/ethnicity and education level are statistically significant, whereas the gender distribution (Panel A) does not significantly vary. In sum, feeling that one had enough time to express one's views seems to be unevenly distributed by education and by race/ethnicity.
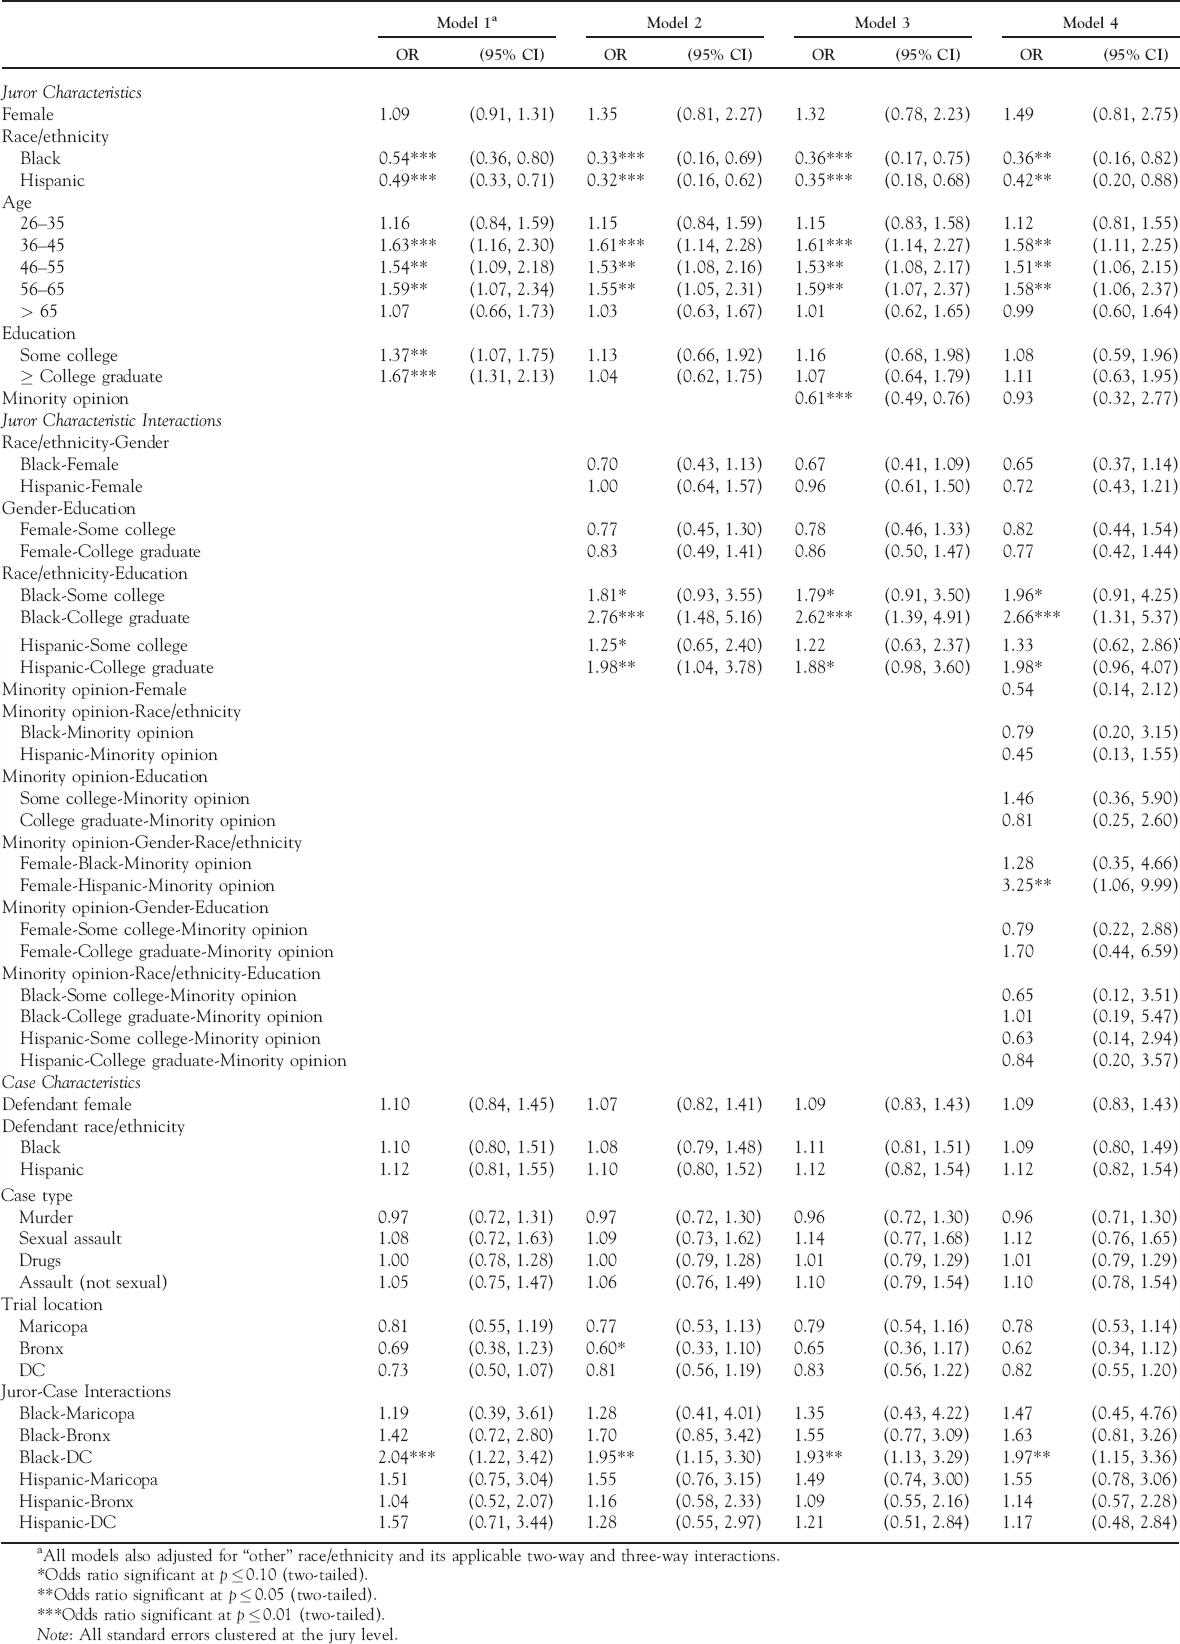
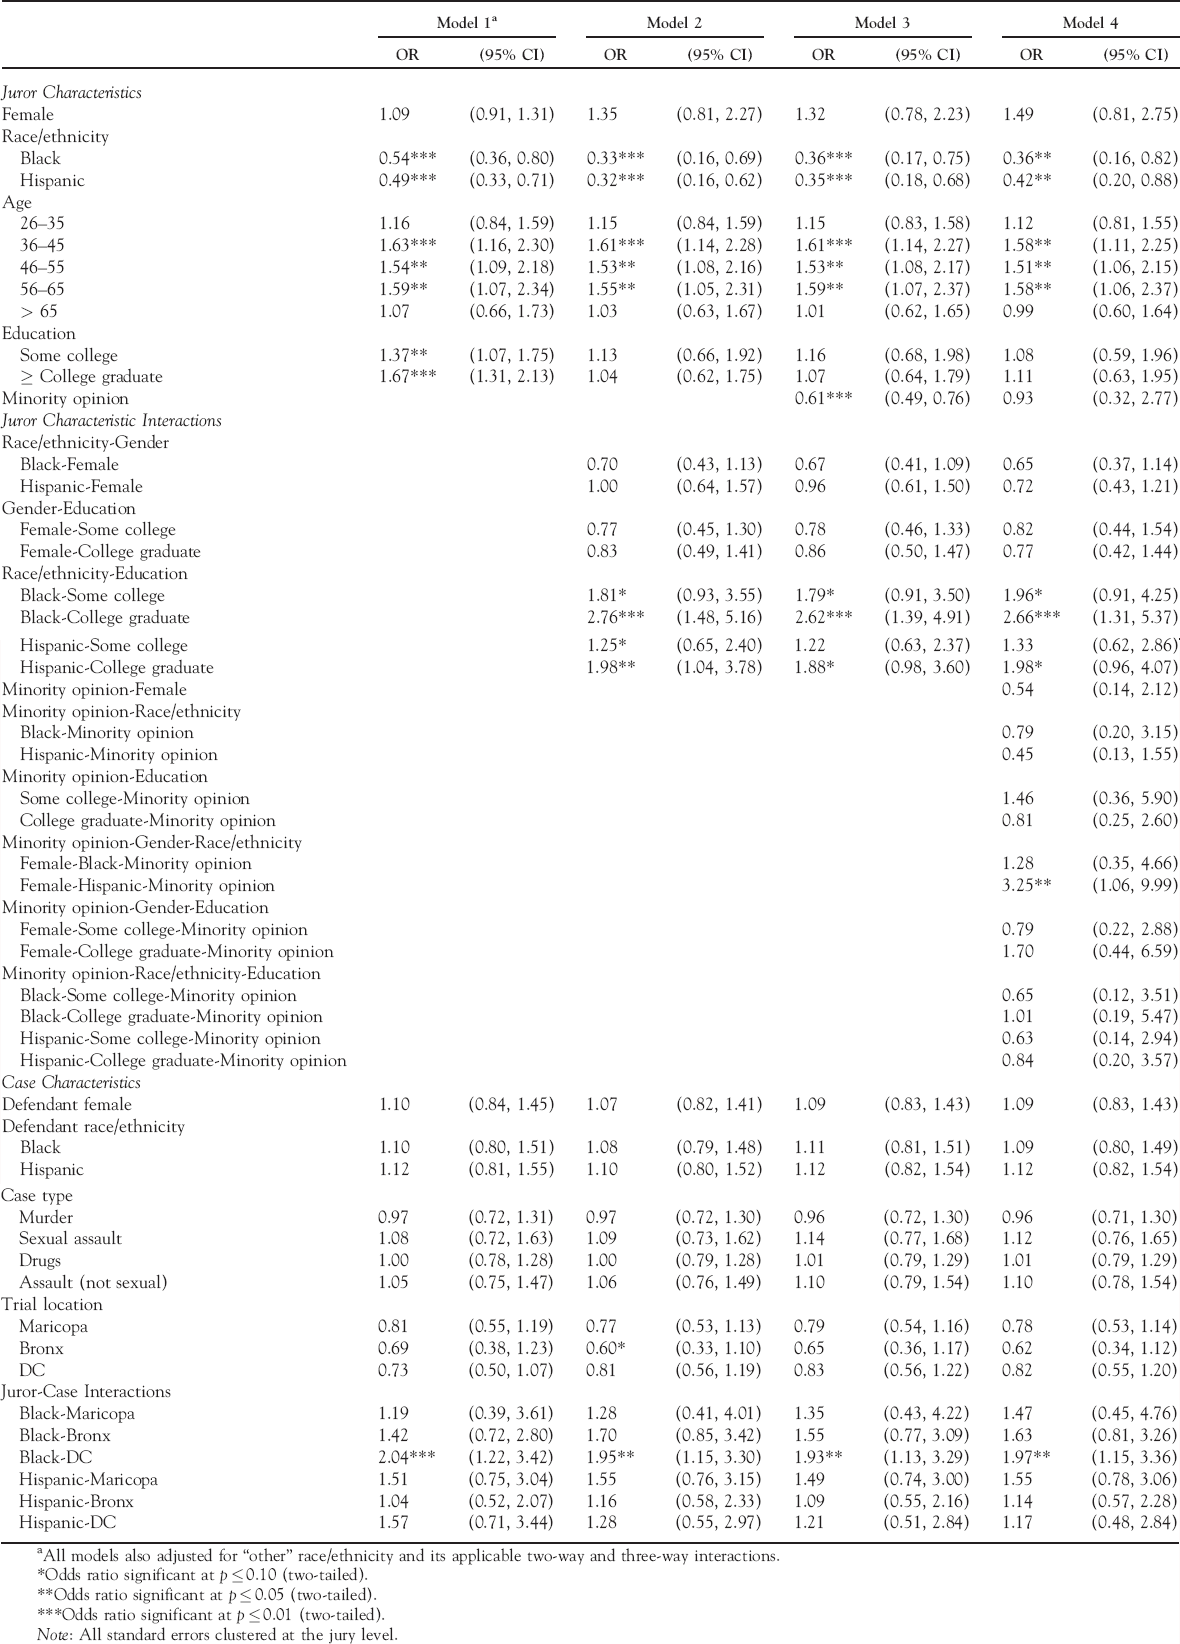
We next turn to multivariate analyses to determine whether these relationships persist when we control for potential confounders (Table 3). We first examine the relationships between the extent of jurors' feelings of self-expression and race/ethnicity, gender, and education, controlling for age and case-level characteristics. Contrary to our hypothesis but in line with contemporary jury studies, women do not significantly differ from men in the extent to which they feel they had enough time to express themselves, as illustrated in Figure 1. Meanwhile, blacks and Hispanics in LA are less likely to feel they were fully able to express themselves than whites,Footnote 12 whereas those with higher levels of education are more likely to feel they were fully able to express themselves relative to those with a high school education or less.Footnote 13
Odds Ratios (OR) and 95 Percent Confidence Intervals (95% CI) from Ordered Logistic Regressions Showing Associations with Jurors' Self-Expression, After Multiple Imputation
| Model 1 a | Model 2 | Model 3 | Model 4 | |||||
|---|---|---|---|---|---|---|---|---|
| OR | (95% CI) | OR | (95% CI) | OR | (95% CI) | OR | (95% CI) | |
| Juror Characteristics | ||||||||
| Female | 1.09 | (0.91, 1.31) | 1.35 | (0.81, 2.27) | 1.32 | (0.78, 2.23) | 1.49 | (0.81, 2.75) |
| Race/ethnicity | ||||||||
| Black | 0.54*** | (0.36, 0.80) | 0.33*** | (0.16, 0.69) | 0.36*** | (0.17, 0.75) | 0.36** | (0.16, 0.82) |
| Hispanic | 0.49*** | (0.33, 0.71) | 0.32*** | (0.16, 0.62) | 0.35*** | (0.18, 0.68) | 0.42** | (0.20, 0.88) |
| Age | ||||||||
| 26–35 | 1.16 | (0.84, 1.59) | 1.15 | (0.84, 1.59) | 1.15 | (0.83, 1.58) | 1.12 | (0.81, 1.55) |
| 36–45 | 1.63*** | (1.16, 2.30) | 1.61*** | (1.14, 2.28) | 1.61*** | (1.14, 2.27) | 1.58** | (1.11, 2.25) |
| 46–55 | 1.54** | (1.09, 2.18) | 1.53** | (1.08, 2.16) | 1.53** | (1.08, 2.17) | 1.51** | (1.06, 2.15) |
| 56–65 | 1.59** | (1.07, 2.34) | 1.55** | (1.05, 2.31) | 1.59** | (1.07, 2.37) | 1.58** | (1.06, 2.37) |
| > 65 | 1.07 | (0.66, 1.73) | 1.03 | (0.63, 1.67) | 1.01 | (0.62, 1.65) | 0.99 | (0.60, 1.64) |
| Education | ||||||||
| Some college | 1.37** | (1.07, 1.75) | 1.13 | (0.66, 1.92) | 1.16 | (0.68, 1.98) | 1.08 | (0.59, 1.96) |
| ≥ College graduate | 1.67*** | (1.31, 2.13) | 1.04 | (0.62, 1.75) | 1.07 | (0.64, 1.79) | 1.11 | (0.63, 1.95) |
| Minority opinion | 0.61*** | (0.49, 0.76) | 0.93 | (0.32, 2.77) | ||||
| Juror Characteristic Interactions | ||||||||
| Race/ethnicity-Gender | ||||||||
| Black-Female | 0.70 | (0.43, 1.13) | 0.67 | (0.41, 1.09) | 0.65 | (0.37, 1.14) | ||
| Hispanic-Female | 1.00 | (0.64, 1.57) | 0.96 | (0.61, 1.50) | 0.72 | (0.43, 1.21) | ||
| Gender-Education | ||||||||
| Female-Some college | 0.77 | (0.45, 1.30) | 0.78 | (0.46, 1.33) | 0.82 | (0.44, 1.54) | ||
| Female-College graduate | 0.83 | (0.49, 1.41) | 0.86 | (0.50, 1.47) | 0.77 | (0.42, 1.44) | ||
| Race/ethnicity-Education | ||||||||
| Black-Some college | 1.81* | (0.93, 3.55) | 1.79* | (0.91, 3.50) | 1.96* | (0.91, 4.25) | ||
| Black-College graduate | 2.76*** | (1.48, 5.16) | 2.62*** | (1.39, 4.91) | 2.66*** | (1.31, 5.37) | ||
| Hispanic-Some college | 1.25* | (0.65, 2.40) | 1.22 | (0.63, 2.37) | 1.33 | (0.62, 2.86) | ||
| Hispanic-College graduate | 1.98** | (1.04, 3.78) | 1.88* | (0.98, 3.60) | 1.98* | (0.96, 4.07) | ||
| Minority opinion-Female | 0.54 | (0.14, 2.12) | ||||||
| Minority opinion-Race/ethnicity | ||||||||
| Black-Minority opinion | 0.79 | (0.20, 3.15) | ||||||
| Hispanic-Minority opinion | 0.45 | (0.13, 1.55) | ||||||
| Minority opinion-Education | ||||||||
| Some college-Minority opinion | 1.46 | (0.36, 5.90) | ||||||
| College graduate-Minority opinion | 0.81 | (0.25, 2.60) | ||||||
| Minority opinion-Gender-Race/ethnicity | ||||||||
| Female-Black-Minority opinion | 1.28 | (0.35, 4.66) | ||||||
| Female-Hispanic-Minority opinion | 3.25** | (1.06, 9.99) | ||||||
| Minority opinion-Gender-Education | ||||||||
| Female-Some college-Minority opinion | 0.79 | (0.22, 2.88) | ||||||
| Female-College graduate-Minority opinion | 1.70 | (0.44, 6.59) | ||||||
| Minority opinion-Race/ethnicity-Education | ||||||||
| Black-Some college-Minority opinion | 0.65 | (0.12, 3.51) | ||||||
| Black-College graduate-Minority opinion | 1.01 | (0.19, 5.47) | ||||||
| Hispanic-Some college-Minority opinion | 0.63 | (0.14, 2.94) | ||||||
| Hispanic-College graduate-Minority opinion | 0.84 | (0.20, 3.57) | ||||||
| Case Characteristics | ||||||||
| Defendant female | 1.10 | (0.84, 1.45) | 1.07 | (0.82, 1.41) | 1.09 | (0.83, 1.43) | 1.09 | (0.83, 1.43) |
| Defendant race/ethnicity | ||||||||
| Black | 1.10 | (0.80, 1.51) | 1.08 | (0.79, 1.48) | 1.11 | (0.81, 1.51) | 1.09 | (0.80, 1.49) |
| Hispanic | 1.12 | (0.81, 1.55) | 1.10 | (0.80, 1.52) | 1.12 | (0.82, 1.54) | 1.12 | (0.82, 1.54) |
| Case type | ||||||||
| Murder | 0.97 | (0.72, 1.31) | 0.97 | (0.72, 1.30) | 0.96 | (0.72, 1.30) | 0.96 | (0.71, 1.30) |
| Sexual assault | 1.08 | (0.72, 1.63) | 1.09 | (0.73, 1.62) | 1.14 | (0.77, 1.68) | 1.12 | (0.76, 1.65) |
| Drugs | 1.00 | (0.78, 1.28) | 1.00 | (0.79, 1.28) | 1.01 | (0.79, 1.29) | 1.01 | (0.79, 1.29) |
| Assault (not sexual) | 1.05 | (0.75, 1.47) | 1.06 | (0.76, 1.49) | 1.10 | (0.79, 1.54) | 1.10 | (0.78, 1.54) |
| Trial location | ||||||||
| Maricopa | 0.81 | (0.55, 1.19) | 0.77 | (0.53, 1.13) | 0.79 | (0.54, 1.16) | 0.78 | (0.53, 1.14) |
| Bronx | 0.69 | (0.38, 1.23) | 0.60* | (0.33, 1.10) | 0.65 | (0.36, 1.17) | 0.62 | (0.34, 1.12) |
| DC | 0.73 | (0.50, 1.07) | 0.81 | (0.56, 1.19) | 0.83 | (0.56, 1.22) | 0.82 | (0.55, 1.20) |
| Juror-Case Interactions | ||||||||
| Black-Maricopa | 1.19 | (0.39, 3.61) | 1.28 | (0.41, 4.01) | 1.35 | (0.43, 4.22) | 1.47 | (0.45, 4.76) |
| Black-Bronx | 1.42 | (0.72, 2.80) | 1.70 | (0.85, 3.42) | 1.55 | (0.77, 3.09) | 1.63 | (0.81, 3.26) |
| Black-DC | 2.04*** | (1.22, 3.42) | 1.95** | (1.15, 3.30) | 1.93** | (1.13, 3.29) | 1.97** | (1.15, 3.36) |
| Hispanic-Maricopa | 1.51 | (0.75, 3.04) | 1.55 | (0.76, 3.15) | 1.49 | (0.74, 3.00) | 1.55 | (0.78, 3.06) |
| Hispanic-Bronx | 1.04 | (0.52, 2.07) | 1.16 | (0.58, 2.33) | 1.09 | (0.55, 2.16) | 1.14 | (0.57, 2.28) |
| Hispanic-DC | 1.57 | (0.71, 3.44) | 1.28 | (0.55, 2.97) | 1.21 | (0.51, 2.84) | 1.17 | (0.48, 2.84) |
a All models also adjusted for “other” race/ethnicity and its applicable two-way and three-way interactions.
* Odds ratio significant at p≤0.10 (two-tailed).
** Odds ratio significant at p≤0.05 (two-tailed).
*** Odds ratio significant at p≤0.01 (two-tailed).
9. Note: All standard errors clustered at the jury level.
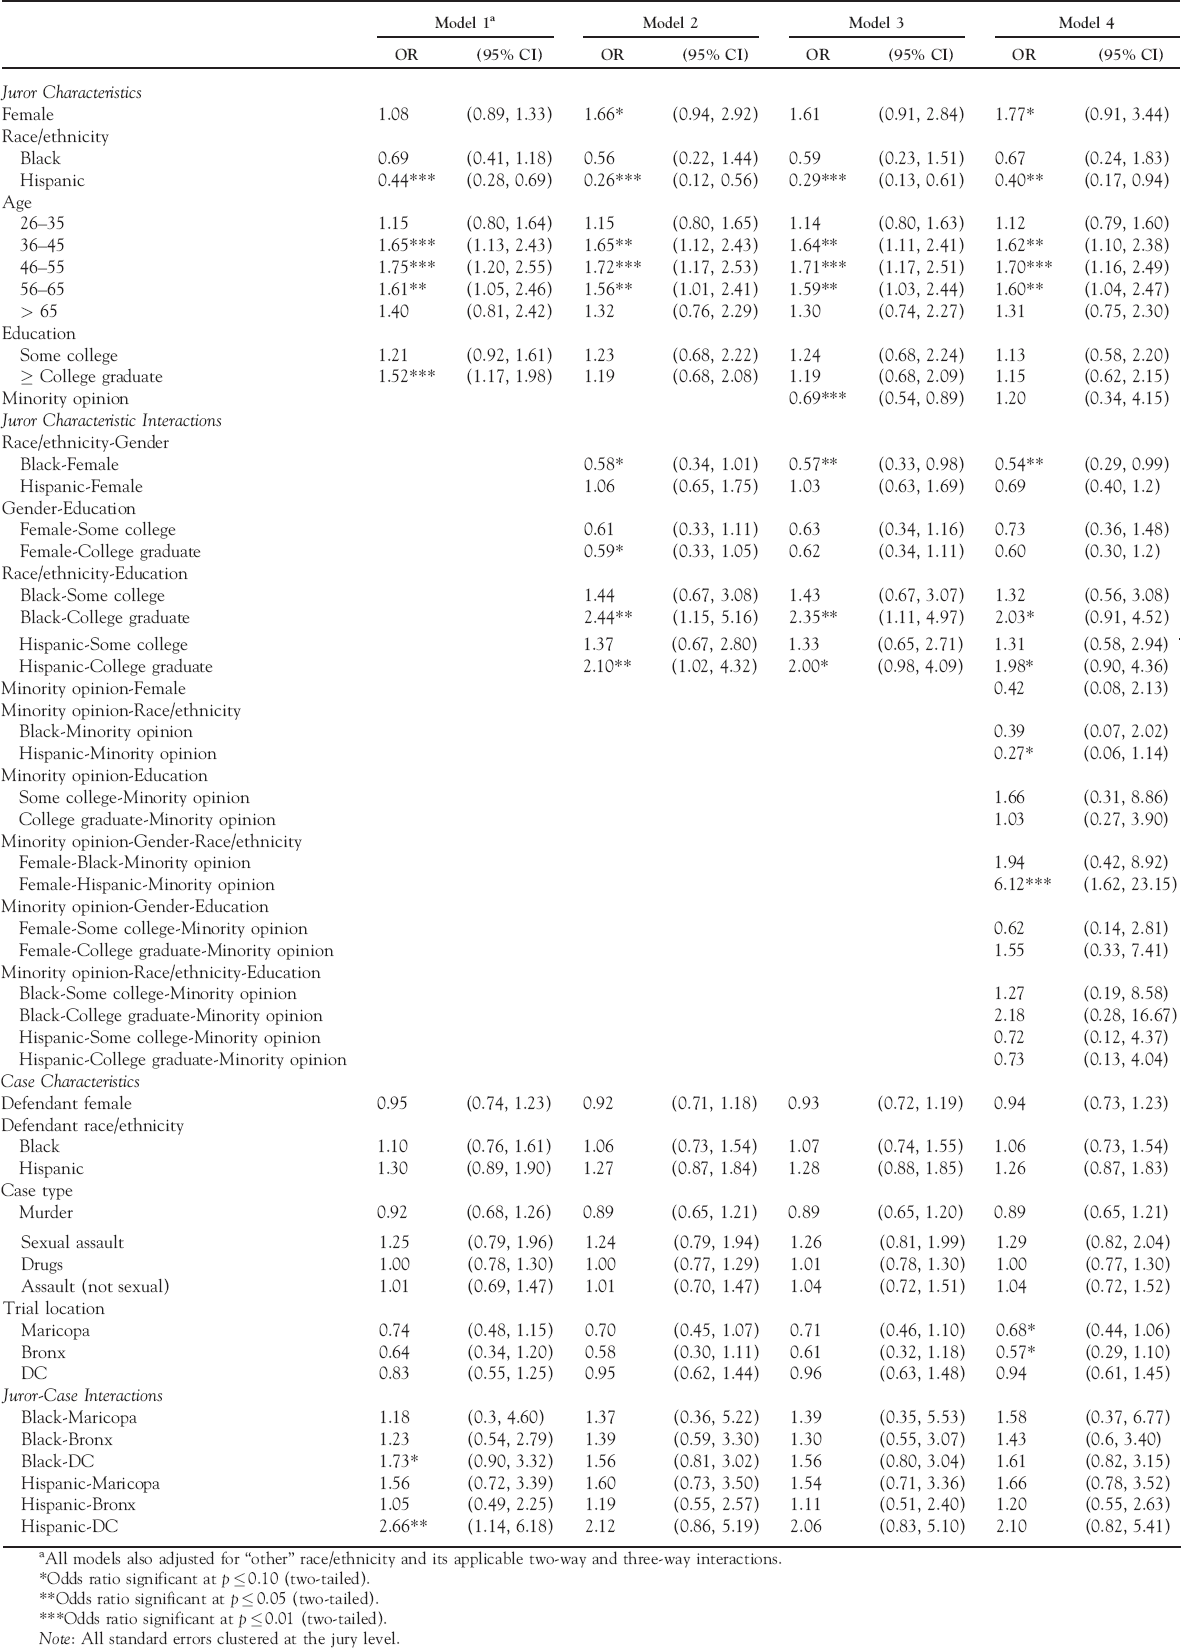
Model 2 of Table 3 adds interaction terms between juror race/ethnicity and gender, gender and education, and race/ethnicity and education. This model tests our hypotheses that the intersections of multiple status characteristics may result in different subjective experiences. Model 3 adds an indicator of whether jurors held minority opinions relative to their fellow jurors at the start of deliberations. Since jurors with minority opinions have previously been shown to be less satisfied with their jury's deliberations (Waters and Hans Reference Waters and Hans2009), this addresses the possibility that the results we observe are attributable to members of certain groups being more likely to hold minority opinions, given differing attitudes toward the legal system and proclivities for supporting the prosecution or defense (Farrell, Pennington, and Cronin Reference Farrell, Pennington and Cronin2013). Finally, Model 4 addresses this possibility with increased specificity by adding interaction terms between minority opinion status and our status characteristics of interest as well as three-way interaction terms between minority opinion status and the individual-level interaction terms in Model 2. When these models are run with the survey data following listwise deletion instead of multiple imputation, the results are very similar (Appendix Table A3).Footnote 14
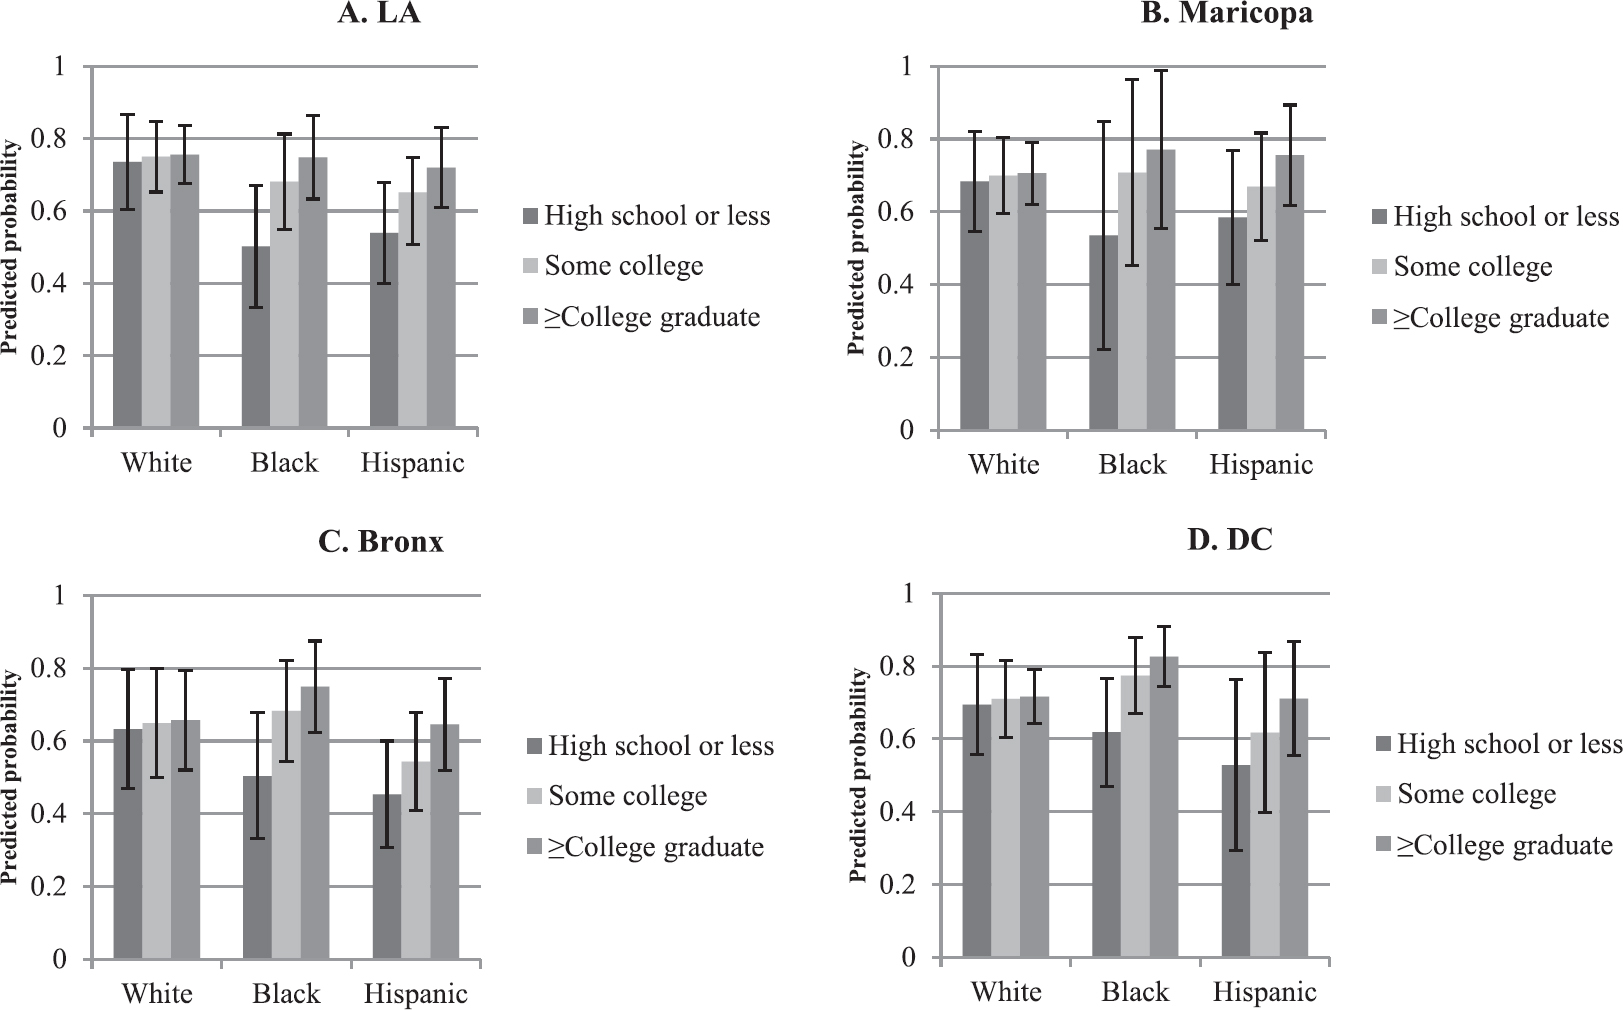
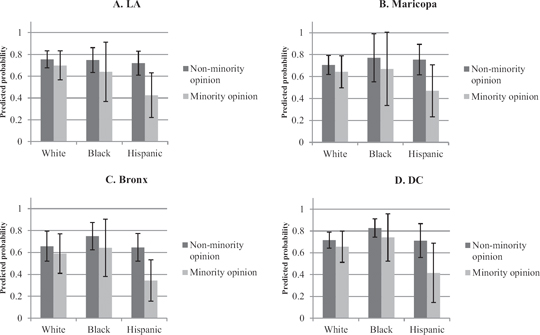
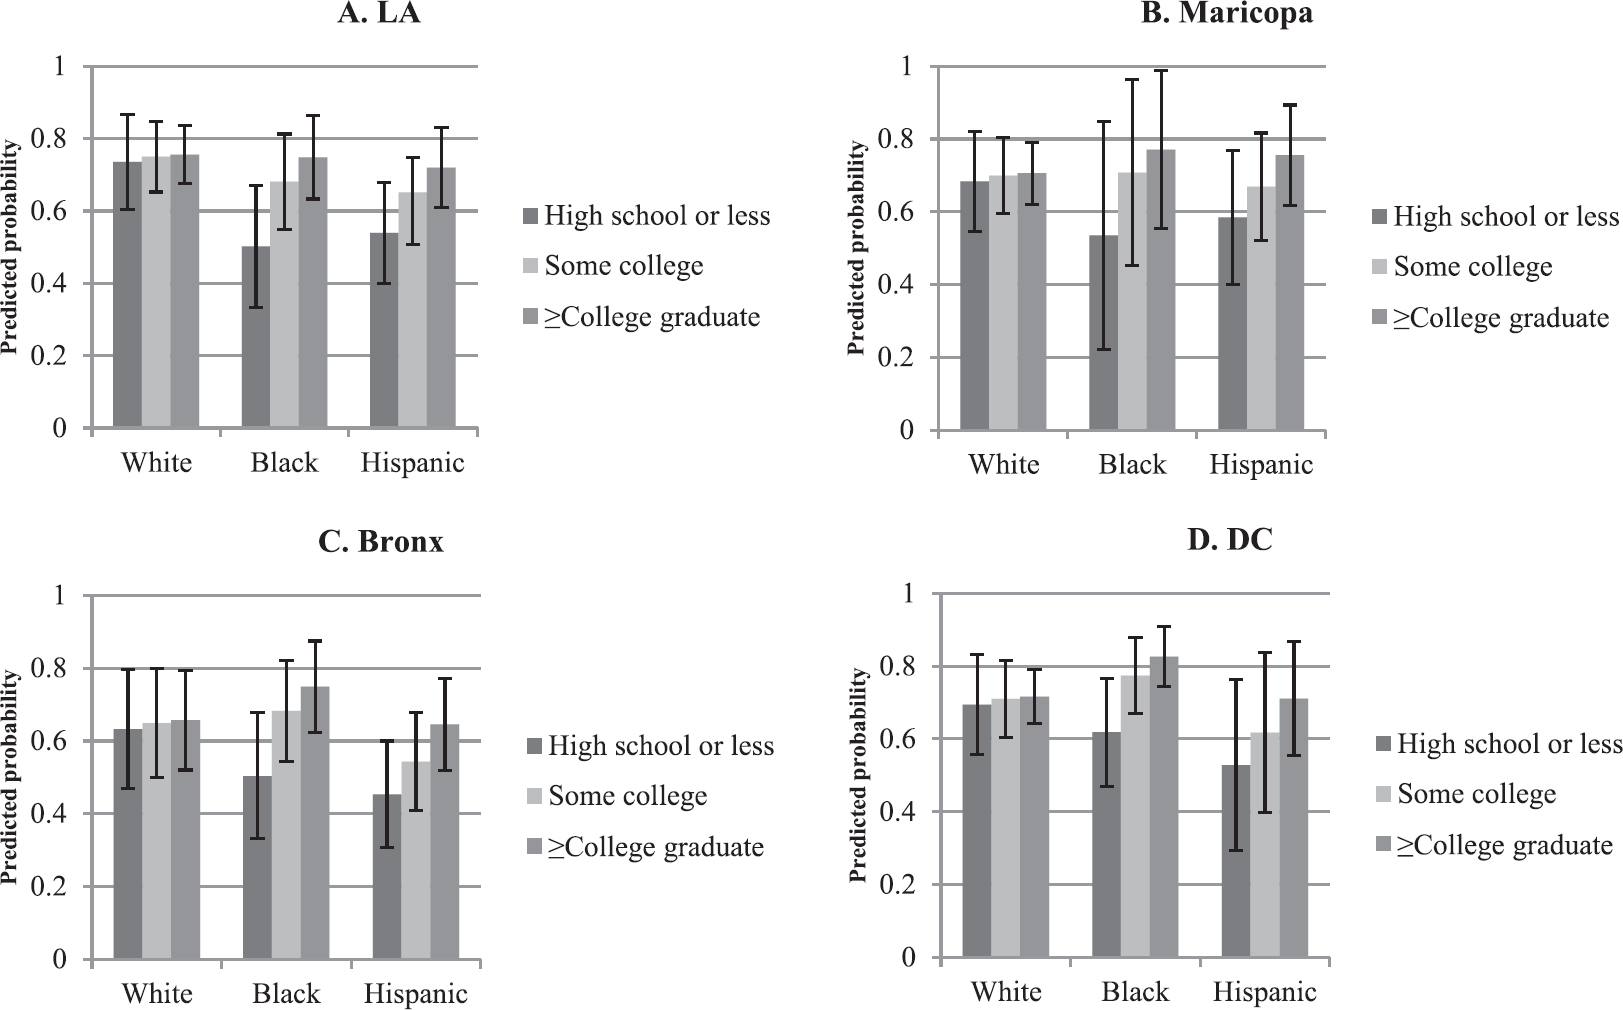
To facilitate interpretation of our results given the interaction terms, we use the coefficients from Table 3, Model 4 to calculate predicted probabilities of responding to whether one had enough time to express oneself with a 7 “definitely yes” by race/ethnicity. Figures 2 and 3 display these predicted probabilities and their 95 percent confidence intervals for each location for varying levels of education (Figure 2) and for minority opinion status (Figure 3) by race/ethnicity. We do not display predicted probabilities by gender, since the extent to which one felt one had enough time to express oneself does not significantly vary by gender or by gender in interaction with race/ethnicity, education, or minority opinion status. To calculate the predicted probabilities shown in Figure 2, gender and other variables were held constant as follows: male; age 26–35; nonminority opinion; black male defendant; and case involving drugs. To calculate the predicted probabilities shown in Figure 3, variables were similarly held constant as follows: male; age 26–35; at least a college graduate; black male defendant; and case involving drugs. Hence, the graphs in Figures 2 and 3 simulate ideal types with meaningful conditions to illustrate the implications of our results more clearly.Footnote 15 Although they focus on the probability of having checked the highest rating of definitely having had enough time to express oneself, they are based on ordered logistic regression models that utilize the full scale of jurors' ratings.
Predicted Probabilities and 95 Percent Confidence Intervals of Definitely (Option 7) Having Had Enough Time to Express One's Views During Deliberations Following Ordered Logistic Regression (Table 3, Model 4), by Race/Ethnicity and Education
Note: Predicted probabilities were calculated using coefficients for male; age 26–35; nonminority opinion; black male defendant; case involving drugs.
Predicted Probabilities and 95 Percent Confidence Intervals of Definitely (Option 7) Having Had Enough Time to Express One's Views During Deliberations Following Ordered Logistic Regression (Table 3, Model 4), by Race/Ethnicity and Minority Opinion Status
Note: Predicted probabilities were calculated using coefficients for: male; age 26–35;≥college graduate; black male defendant; case involving drugs.
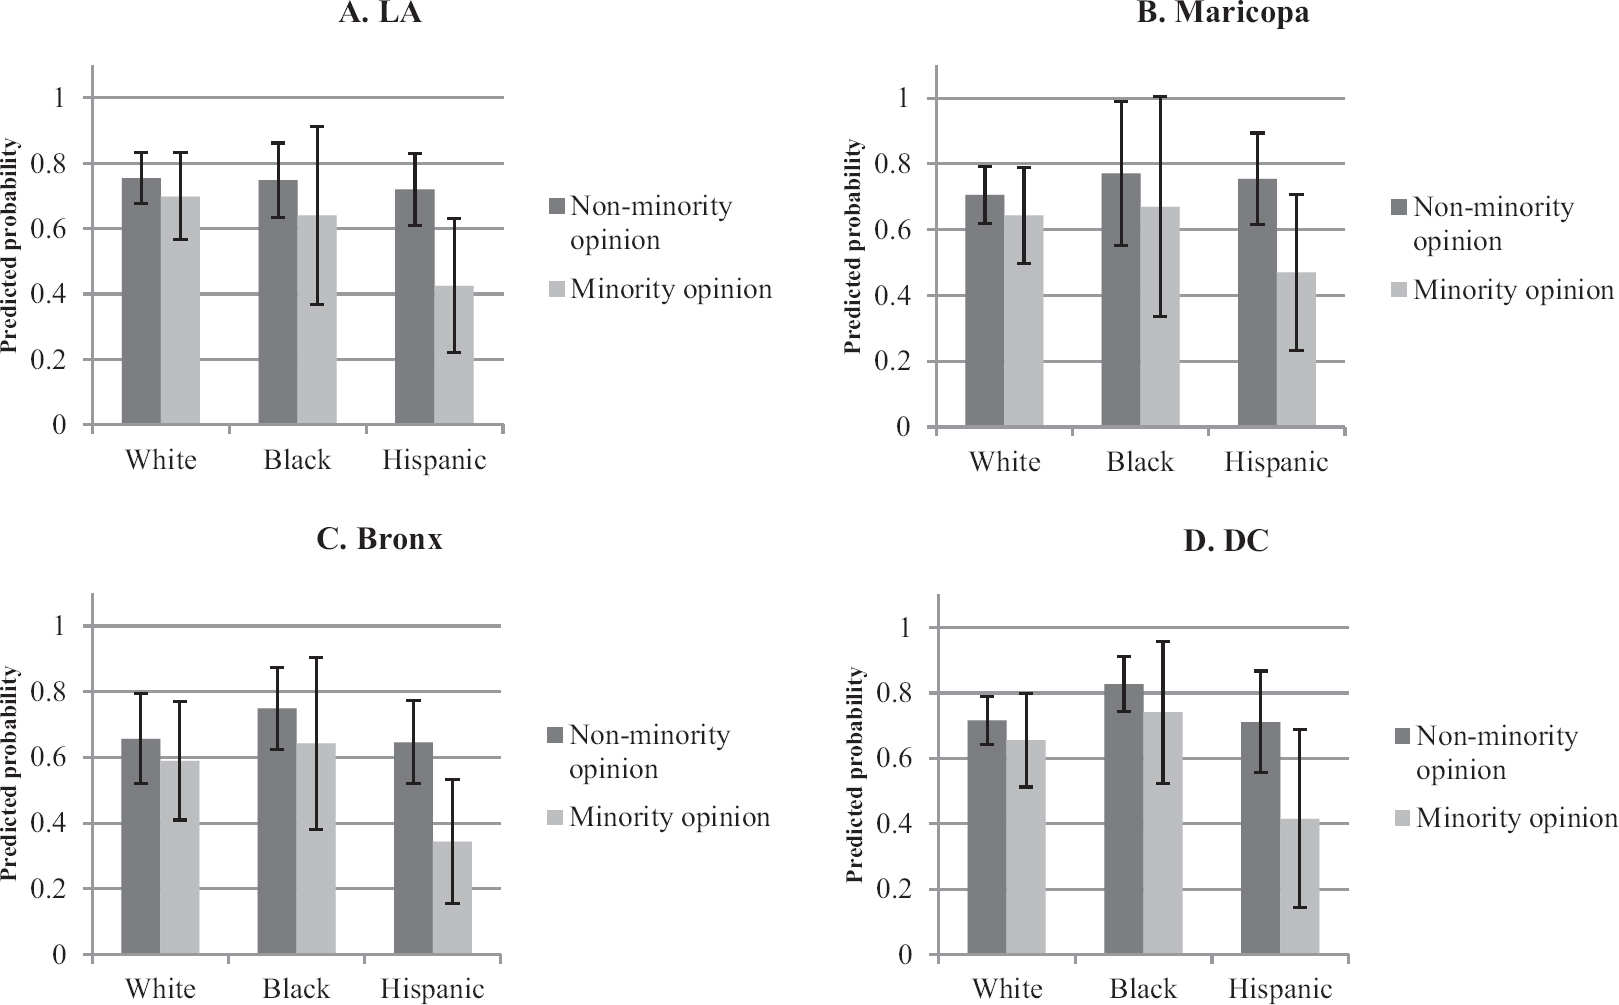
Figure 2 shows an education gradient for blacks and for Hispanics across all sites. Blacks and Hispanics with higher levels of education are more likely to feel they definitely had enough time to express themselves relative to blacks and Hispanics with lower levels of education, respectively—although the education gradient is stronger for blacks than it is for Hispanics. For whites, one's education does not matter; whites' likelihood of feeling that they had enough time to express themselves does not vary by education level in any of the sites.
These results are particularly striking because in Model 1 (Table 3), having higher levels of education was significantly, positively associated with feeling that one had enough time to express oneself, controlling for race/ethnicity. However, the interaction terms added in Model 2 reveal that the self-expressions of blacks and of Hispanics of differing education levels are different from those of whites of differing education levels. Whereas the experiences of expressing oneself for highly educated blacks and Hispanics appear to be relatively similar to those of their white peers in some locations (Figure 2), the experience of being black or Hispanic with lower education levels is different than the experiences of being white with lower education levels across all sites. In fact, the gaps between blacks and Hispanics with low levels of education and whites with low levels of education are substantial. However, the education gradient for Hispanics is not as steep as it is for blacks. Given that jury deliberations consist of verbal reasoning, it is not necessarily surprising that those with higher levels of education are more likely than those with lower levels to report having had enough time to express themselves, but our results reveal that this is true only for minorities.
Although whether one held a minority opinion at the start of deliberations significantly relates to self-expression (Table 3, Model 3), this relationship does not account for our findings with respect to race/ethnicity and education (Table 3, Models 3 and 4). Since the majority of jury verdicts tend to follow the majority opinion at the start of deliberations (Kalvin and Zeisel Reference Kalvin and Hans1966), this association could arise from jurors with minority opinions feeling that their fellow jurors did not seriously consider their viewpoints. However, like education, minority opinion status does not matter equally for everybody (Table 3, Model 4). Figure 3 reveals that although holding a minority opinion is associated with a smaller probability of having definitely felt one had enough time to express oneself for all racial/ethnic groups, the association is larger for minorities relative to whites, and particularly for Hispanics.
Discussion
Our results support our argument that researchers should consider jurors' subjective experiences independent of their influence on criminal defendants' outcomes. Using a survey of real-world jurors, we find that, overall, the majority of jurors of all status groups feel that they definitely had enough time to express themselves during jury deliberations. This suggests jury service as a potential pathway for positive contact with the legal system. Indeed, although one study found that whites are more likely than blacks or Hispanics to favor a jury over a judge if they imagine themselves as defendants, the study found the relationship to be attenuated for minorities with prior jury service (Rose, Ellison, and Diamond Reference Rose, Ellison and Diamond2008).
Despite our overall positive finding, our results simultaneously reveal that experiences of jury deliberations are less positive for members of lower-status social groups. Blacks and Hispanics with lower levels of education are less likely than their white peers to feel as positively that they had enough time to express themselves during jury deliberations, associations that are attenuated for blacks and Hispanics with higher levels of education. In contrast, being white appears to operate as a trumping “master status” (Hughes Reference Hughes1945, 357), shielding those with lower education levels from less positive experiences of self-expression. In this way, our results illustrate that in the context of jury deliberations, being black with a lower level of education is qualitatively different from being white with a lower level of education. This differing effect of class by race has previously been found with respect to incarceration (Western Reference Western2006) as well as with respect to residential neighborhoods (Sharkey Reference Sharkey2013), but we find that it is also the case in the context of interpersonal interaction.
Our findings contrast with those of Cornwell and Hans (Reference Cornwell and Hans2011), who, using the same data set, found that blacks report having participated more during deliberations than whites. Whereas the authors interpret jurors' self-reports of participation as a measure of objective participation rates (Cornwell and Hans Reference Cornwell and Hans2011, 692), such self-reports can also be understood as a measure of subjective feelings of engagement. We offer three possible explanations for these discrepant results, none of which are mutually exclusive. First, it may be that each set of findings is capturing a different aspect of jurors' feelings, highlighting the multidimensional nature of individuals' subjective experiences (see Table 2). Second, if we conceptualize self-reported participation as a measure of objective participation rates, more highly educated blacks may be more likely to attempt to convince others of their views (Lareau Reference Lareau2002), especially in the context of criminal jury deliberations, since blacks and whites tend to hold different explanatory accounts of law-breaking behavior (Thompson and Bobo Reference Thompson and Bobo2011). Third, status characteristics may operate more strongly when individuals conform more closely to their associated stereotypes (Ridgeway and Kricheli-Katz Reference Ridgeway and Kricheli-Katz2013). Whereas race is socially significant in its own right, it is also deeply associated with class (Saperstein and Penner Reference Saperstein and Penner2012), and so blacks with less education may have more negative subjective experiences of interpersonal interaction.
The nature of our data set prevents us from identifying the precise mechanisms through which our results arise, as we are unable to observe what happened in the jury rooms. Future research should combine observational data of jury deliberations with postdeliberation surveys intended to capture subjective self-reports. Such a research design could uncover the interactional processes that give rise to disparate subjective experiences. Researchers should also consider how objective factors, such as the process of foreperson selection, the gender and race/ethnicity of the foreperson, and whether each juror expresses an opinion before the first vote is taken, shape jurors' subjective experiences.
Additionally, building from our finding in Table 2 that different measures of jurors' subjective experiences are correlated but distinct from one another, future research should consider whether the determinants of each of these outcomes are unique or whether subjective experience across multiple dimensions tends to arise from similar processes. While tackling these and other questions related to jury deliberations, researchers should be sure to include the interactive effects of race and class in order to provide more precise accounts of the relationships between status characteristics and jurors' objective and subjective experiences. Finally, larger sample sizes from multiple jurisdictions would allow researchers to disentangle the effects of the jurisdictional context from those of the racial composition of the jury. Although we have laid out these recommendations for future research within the substantive context of jury deliberations, they might also be applied to the broader development of status characteristics theory across multiple, real-world contexts.
Although the impact of jury deliberations on defendants' outcomes is not our area of focus, our results have implications for understanding this relationship. Rose (Reference Rose and Sandefur2009) posits that further study of jurors' participation rates may help explain why there is not a stronger link between juries' racial compositions and their verdicts, given average racial differences in beliefs regarding crime and the criminal justice system at the individual level. However, our finding that blacks and Hispanics with lower education levels feel less positive about their self-expression during deliberations may be the missing link that helps explain this disconnect, rather than objective participation rates alone. Similarly, Hunt hypothesizes that “differences in cultural values and practices” (2015, 279) may help explain differences in participation rates by status characteristics and, by extension, persistent biases in juries' verdicts against minority defendants. Such an explanation makes assumptions about individuals' subjective experiences that we, instead, directly measure, finding that minority jurors with lower education levels feel less definitively than white jurors that they were able to fully express themselves, rather than having a cultural preference for less participation.
Returning to the significance of jury service for jurors themselves, our findings have implications for understandings of the jury as a democratic deliberative body and for legal cynicism. As in other institutional contexts (Jack Reference Jack2014; Evans and Moore Reference Evans and Moore2015), our findings reveal that the increased access of marginalized status groups to serving on a jury does not necessarily translate into feelings of inclusion, potentially leading to lower levels of civic participation (Gastil et al. Reference Gastil, Pierre Deess, Weiser and Simmons2010). Additionally, our results indicate that jury deliberations may reinforce racial/ethnic minorities' more negative perceptions of the legal system relative to whites' (Weitzer and Tuch Reference Weitzer and Tuch2005; Bobo and Thompson Reference Bobo and Thompson2006), potentially increasing legal cynicism (Sampson and Bartusch Reference Sampson and Bartusch1998) and decreasing confidence in the legal system for protection might one need it (Bobo and Thompson Reference Bobo and Thompson2006). Differences in subjective experiences of deliberations may have ramifications not only for jurors' own views (Farrell, Pennington, and Cronin Reference Farrell, Pennington and Cronin2013), but also for the views and subsequent civic engagement of their family members and peers to whom they are likely to relay their experiences (Kirk and Papachristos Reference Kirk and Papachristos2011). Women with previously incarcerated partners have been shown to be less likely to participate politically following incarceration (Sugie Reference Sugie2015), and similar spillover effects may result from subjective experiences of jury deliberations.
Overall, this study moves jury research and status characteristics theory toward a greater consideration of the subjective feelings—not just the objective contributions—of minorities, women, and those of lower SES. In particular, we have shown that jurors' feelings of self-expression vary by individuals' race/ethnicity and education level, and that these variations are not accounted for by which jurors held minority opinions at the start of jury deliberations. Our findings have implications for minorities' social inclusion and are significant given that juries are meant to be paradigmatic of US democracy (Diamond and Rose Reference Diamond and Rose2005; Gastil et al. Reference Gastil, Pierre Deess, Weiser and Simmons2010).
Appendix Multiple Imputation Method
Missing data at the individual and case levels were multiply imputed using chained equations with the mi impute chained procedure in Stata 13. To address our need to multiply impute data at two levels of analysis in a context in which the higher-level groups are relatively small (juries do not consist of more than twelve people), missing data at the individual and case levels were imputed separately. To avoid model misspecification, variables from each level of analysis were used as auxiliary variables at the other level and then discarded before merging the two imputed data sets. For example, dummy variables indicating whether the case involved a murder, sexual assault, drugs, or nonsexual assault were included in the juror-level imputation, but the imputed values of these variables were then thrown out and replaced by their imputed values from the case-level imputation. Similarly, our dependent variable of interest was included in the imputation model to avoid model misspecification, but imputed values of the dependent variable were not used in analyses (White, Royston, and Wood 2011). Additionally, data were not imputed for individuals who are fully missing from the data set, indicated by a jury with fewer than the lawful number of jurors, or for individuals or cases when no case-level information was available.
The imputation model at each level of analysis included all variables included in our analysis models as well as additional auxiliary variables that relate to these variables or might theoretically be thought to help predict whether the variables used in analyses are missing (White, Royston, and Wood 2011). For example, at the juror level, such auxiliary variables included jurors' attitudes toward the criminal justice system and a categorical measure of jurors' incomes. At the case level, such variables included the length of the trial and whether a victim was present.
Missing data for each variable were imputed using the proper model specification given the variable type. Namely, logistic regression was used to impute binary variables, ordered logistic regression was used to impute ordinal variables, and multinomial logistic regression was used to impute multinomial variables, such as race. Continuous variables were imputed using predictive mean matching.
To avoid perfect prediction, the data were augmented by adding a few extra observations with small weights (White, Royston, and Wood 2011) and certain variables were omitted from the imputation of specific other variables. For example, the interactions between whether jurors are Hispanic and location and between whether jurors are of another race/ethnicity and location were omitted from the imputations of the interactions between whether jurors were black and location. Finally, given that our analysis models use ordered logistic regression, although interactions were included in the imputation models to avoid misspecification, they were recalculated passively for use in analysis (Seaman, Bartlett, and White Reference Seaman, Bartlett and White2012).
Missing Data
| N Missing | % Total Jurors (3,497) Missing | |
|---|---|---|
| Juror Characteristics | ||
| Gender | 542 | 15.50 |
| Race/ethnicity | 412 | 11.78 |
| Age | 391 | 11.18 |
| Education | 340 | 9.72 |
| Minority opinion | 187 | 5.35 |
| Time to express views | 290 | 8.29 |
| Participation | 274 | 7.84 |
| Satisfaction with deliberations | 299 | 8.55 |
| Satisfaction with verdict | 261 | 7.46 |
| Case Characteristics | ||
| Defendant gender | 465 | 13.30 |
| Defendant race/ethnicity | 348 | 9.95 |
| Case type | 254 | 7.26 |
Descriptive Statistics (Means) for All Available Cases and After Multiple Imputation
| All Available Cases | After Multiple Imputation (N=3,176) | |
|---|---|---|
| Juror Characteristics | ||
| Female | 0.57 | 0.57 |
| Race/ethnicity | ||
| White | 0.44 | 0.42 |
| Black | 0.26 | 0.28 |
| Hispanic | 0.22 | 0.22 |
| Other | 0.08 | 0.08 |
| Age | ||
| 18–25 | 0.10 | 0.10 |
| 26–35 | 0.25 | 0.25 |
| 36–45 | 0.25 | 0.25 |
| 46–55 | 0.23 | 0.23 |
| 56–65 | 0.12 | 0.12 |
| > 65 | 0.05 | 0.05 |
| Education | ||
| High school or less | 0.20 | 0.21 |
| Some college | 0.31 | 0.30 |
| ≥ College graduate | 0.50 | 0.49 |
| Minority opinion | 0.20 | 0.20 |
| Time to express views‡ | 6.40 | 6.41 |
| (1.18) | (1.17) | |
| Participation | 5.73 | 5.74 |
| (1.27) | (1.26) | |
| Satisfaction with deliberations | 5.88 | 5.90 |
| (1.59) | (1.57) | |
| Satisfaction with verdict | 5.88 | 5.89 |
| (1.80) | (1.79) |
| All Available Cases | After Multiple Imputation (N=330) | |
|---|---|---|
| Case Characteristics | ||
| Defendant female | 0.11 | 0.12 |
| Defendant race/ethnicity | ||
| White | 0.10 | 0.10 |
| Black | 0.56 | 0.56 |
| Hispanic | 0.29 | 0.29 |
| Other | 0.05 | 0.05 |
| Case type | ||
| Murder | 0.17 | 0.17 |
| Sexual assault | 0.05 | 0.06 |
| Drugs | 0.28 | 0.28 |
| Assault (not sexual) | 0.11 | 0.12 |
| Trial location | ||
| LA | 0.23 | 0.25 |
| Maricopa | 0.26 | 0.24 |
| Bronx | 0.25 | 0.23 |
| DC | 0.26 | 0.28 |
‡Standard deviations shown in parentheses for ordinal variables.
Odds Ratios (OR) and 95 Percent Confidence Intervals (95% CI) from Ordered Logistic Regressions Showing Associations with Jurors' Self-Expression, After Listwise Deletion
| Model 1 a | Model 2 | Model 3 | Model 4 | |||||
|---|---|---|---|---|---|---|---|---|
| OR | (95% CI) | OR | (95% CI) | OR | (95% CI) | OR | (95% CI) | |
| Juror Characteristics | ||||||||
| Female | 1.08 | (0.89, 1.33) | 1.66* | (0.94, 2.92) | 1.61 | (0.91, 2.84) | 1.77* | (0.91, 3.44) |
| Race/ethnicity | ||||||||
| Black | 0.69 | (0.41, 1.18) | 0.56 | (0.22, 1.44) | 0.59 | (0.23, 1.51) | 0.67 | (0.24, 1.83) |
| Hispanic | 0.44*** | (0.28, 0.69) | 0.26*** | (0.12, 0.56) | 0.29*** | (0.13, 0.61) | 0.40** | (0.17, 0.94) |
| Age | ||||||||
| 26–35 | 1.15 | (0.80, 1.64) | 1.15 | (0.80, 1.65) | 1.14 | (0.80, 1.63) | 1.12 | (0.79, 1.60) |
| 36–45 | 1.65*** | (1.13, 2.43) | 1.65** | (1.12, 2.43) | 1.64** | (1.11, 2.41) | 1.62** | (1.10, 2.38) |
| 46–55 | 1.75*** | (1.20, 2.55) | 1.72*** | (1.17, 2.53) | 1.71*** | (1.17, 2.51) | 1.70*** | (1.16, 2.49) |
| 56–65 | 1.61** | (1.05, 2.46) | 1.56** | (1.01, 2.41) | 1.59** | (1.03, 2.44) | 1.60** | (1.04, 2.47) |
| > 65 | 1.40 | (0.81, 2.42) | 1.32 | (0.76, 2.29) | 1.30 | (0.74, 2.27) | 1.31 | (0.75, 2.30) |
| Education | ||||||||
| Some college | 1.21 | (0.92, 1.61) | 1.23 | (0.68, 2.22) | 1.24 | (0.68, 2.24) | 1.13 | (0.58, 2.20) |
| ≥ College graduate | 1.52*** | (1.17, 1.98) | 1.19 | (0.68, 2.08) | 1.19 | (0.68, 2.09) | 1.15 | (0.62, 2.15) |
| Minority opinion | 0.69*** | (0.54, 0.89) | 1.20 | (0.34, 4.15) | ||||
| Juror Characteristic Interactions | ||||||||
| Race/ethnicity-Gender | ||||||||
| Black-Female | 0.58* | (0.34, 1.01) | 0.57** | (0.33, 0.98) | 0.54** | (0.29, 0.99) | ||
| Hispanic-Female | 1.06 | (0.65, 1.75) | 1.03 | (0.63, 1.69) | 0.69 | (0.40, 1.2) | ||
| Gender-Education | ||||||||
| Female-Some college | 0.61 | (0.33, 1.11) | 0.63 | (0.34, 1.16) | 0.73 | (0.36, 1.48) | ||
| Female-College graduate | 0.59* | (0.33, 1.05) | 0.62 | (0.34, 1.11) | 0.60 | (0.30, 1.2) | ||
| Race/ethnicity-Education | ||||||||
| Black-Some college | 1.44 | (0.67, 3.08) | 1.43 | (0.67, 3.07) | 1.32 | (0.56, 3.08) | ||
| Black-College graduate | 2.44** | (1.15, 5.16) | 2.35** | (1.11, 4.97) | 2.03* | (0.91, 4.52) | ||
| Hispanic-Some college | 1.37 | (0.67, 2.80) | 1.33 | (0.65, 2.71) | 1.31 | (0.58, 2.94) | ||
| Hispanic-College graduate | 2.10** | (1.02, 4.32) | 2.00* | (0.98, 4.09) | 1.98* | (0.90, 4.36) | ||
| Minority opinion-Female | 0.42 | (0.08, 2.13) | ||||||
| Minority opinion-Race/ethnicity | ||||||||
| Black-Minority opinion | 0.39 | (0.07, 2.02) | ||||||
| Hispanic-Minority opinion | 0.27* | (0.06, 1.14) | ||||||
| Minority opinion-Education | ||||||||
| Some college-Minority opinion | 1.66 | (0.31, 8.86) | ||||||
| College graduate-Minority opinion | 1.03 | (0.27, 3.90) | ||||||
| Minority opinion-Gender-Race/ethnicity | ||||||||
| Female-Black-Minority opinion | 1.94 | (0.42, 8.92) | ||||||
| Female-Hispanic-Minority opinion | 6.12*** | (1.62, 23.15) | ||||||
| Minority opinion-Gender-Education | ||||||||
| Female-Some college-Minority opinion | 0.62 | (0.14, 2.81) | ||||||
| Female-College graduate-Minority opinion | 1.55 | (0.33, 7.41) | ||||||
| Minority opinion-Race/ethnicity-Education | ||||||||
| Black-Some college-Minority opinion | 1.27 | (0.19, 8.58) | ||||||
| Black-College graduate-Minority opinion | 2.18 | (0.28, 16.67) | ||||||
| Hispanic-Some college-Minority opinion | 0.72 | (0.12, 4.37) | ||||||
| Hispanic-College graduate-Minority opinion | 0.73 | (0.13, 4.04) | ||||||
| Case Characteristics | ||||||||
| Defendant female | 0.95 | (0.74, 1.23) | 0.92 | (0.71, 1.18) | 0.93 | (0.72, 1.19) | 0.94 | (0.73, 1.23) |
| Defendant race/ethnicity | ||||||||
| Black | 1.10 | (0.76, 1.61) | 1.06 | (0.73, 1.54) | 1.07 | (0.74, 1.55) | 1.06 | (0.73, 1.54) |
| Hispanic | 1.30 | (0.89, 1.90) | 1.27 | (0.87, 1.84) | 1.28 | (0.88, 1.85) | 1.26 | (0.87, 1.83) |
| Case type | ||||||||
| Murder | 0.92 | (0.68, 1.26) | 0.89 | (0.65, 1.21) | 0.89 | (0.65, 1.20) | 0.89 | (0.65, 1.21) |
| Sexual assault | 1.25 | (0.79, 1.96) | 1.24 | (0.79, 1.94) | 1.26 | (0.81, 1.99) | 1.29 | (0.82, 2.04) |
| Drugs | 1.00 | (0.78, 1.30) | 1.00 | (0.77, 1.29) | 1.01 | (0.78, 1.30) | 1.00 | (0.77, 1.30) |
| Assault (not sexual) | 1.01 | (0.69, 1.47) | 1.01 | (0.70, 1.47) | 1.04 | (0.72, 1.51) | 1.04 | (0.72, 1.52) |
| Trial location | ||||||||
| Maricopa | 0.74 | (0.48, 1.15) | 0.70 | (0.45, 1.07) | 0.71 | (0.46, 1.10) | 0.68* | (0.44, 1.06) |
| Bronx | 0.64 | (0.34, 1.20) | 0.58 | (0.30, 1.11) | 0.61 | (0.32, 1.18) | 0.57* | (0.29, 1.10) |
| DC | 0.83 | (0.55, 1.25) | 0.95 | (0.62, 1.44) | 0.96 | (0.63, 1.48) | 0.94 | (0.61, 1.45) |
| Juror-Case Interactions | ||||||||
| Black-Maricopa | 1.18 | (0.3, 4.60) | 1.37 | (0.36, 5.22) | 1.39 | (0.35, 5.53) | 1.58 | (0.37, 6.77) |
| Black-Bronx | 1.23 | (0.54, 2.79) | 1.39 | (0.59, 3.30) | 1.30 | (0.55, 3.07) | 1.43 | (0.6, 3.40) |
| Black-DC | 1.73* | (0.90, 3.32) | 1.56 | (0.81, 3.02) | 1.56 | (0.80, 3.04) | 1.61 | (0.82, 3.15) |
| Hispanic-Maricopa | 1.56 | (0.72, 3.39) | 1.60 | (0.73, 3.50) | 1.54 | (0.71, 3.36) | 1.66 | (0.78, 3.52) |
| Hispanic-Bronx | 1.05 | (0.49, 2.25) | 1.19 | (0.55, 2.57) | 1.11 | (0.51, 2.40) | 1.20 | (0.55, 2.63) |
| Hispanic-DC | 2.66** | (1.14, 6.18) | 2.12 | (0.86, 5.19) | 2.06 | (0.83, 5.10) | 2.10 | (0.82, 5.41) |
a All models also adjusted for “other” race/ethnicity and its applicable two-way and three-way interactions.
* Odds ratio significant at p≤0.10 (two-tailed).
** Odds ratio significant at p≤0.05 (two-tailed).
*** Odds ratio significant at p≤0.01 (two-tailed).
Note: All standard errors clustered at the jury level.