Implications
Knowledge of degradation characteristics associated with starch (ST) in cereal grains is a prerequisite for its appropriate use in ruminant nutrition and the maintenance of animal health. Regarding the ruminal effective degradability (ED) of ST, the results indicated significant differences between rye, triticale and barley grains. The degradation rate of rye ST was especially high, and it should be considered when rye grain is included in ruminant rations. Slight variations in the ED were detected between the genotypes of a single-grain species. The grain species rankings based on in vitro gas production kinetics and in situ incubations were equivalent.
Introduction
The milk yield of dairy cows has increased continuously for several years, leading to increased energy and protein requirements. To meet the nutritional requirements, large proportions of grains are included in dairy cow rations. Cereal grains contain large quantities of readily degradable ST, which is why excessive usage in ruminant rations can lead to negative consequences, such as ruminal acidosis (Kleen et al., Reference Kleen, Hooijer, Rehage and Noordhuizen2003). Knowledge of the characteristics of ruminal ST degradation of cereal grains is needed to avoid a significant drop in the pH of the rumen content and the resulting negative consequences for animal health and performance. Currently available feed table values were obtained more than a decade ago, and are based on the results of a few studies (Deutsche Landwirtschaftsgesellschaft, 1997; Centraal Veevoederbureau, 2011). However, there have been advances in plant breeding, which were encouraged by novel findings and developments in molecular methodologies and plant genetics. For instance, Seifried et al. (Reference Seifried, Steingass, Hoffmann and Rodehutscord2016a), Silveira et al. (Reference Silveira, Oba, Yang and Beauchemin2007) and Zhao et al. (Reference Zhao, Yan, He, Anele, Swift, McAllister and Yang2016) identified variation in the ruminal degradation of cereal grains from different cultivars. Silveira et al. (Reference Silveira, Oba, Yang and Beauchemin2007) found differences in the ruminal pH, ruminal propionate and acetate concentrations and total tract digestibility of ST between two barley cultivars. A comparison between barley genotypes with different ST concentrations showed significant differences in the ruminal ED of ST (Zhao et al., Reference Zhao, Yan, He, Anele, Swift, McAllister and Yang2016). Variation in ruminal (in situ) degradation parameters was also shown for wheat genotypes (Seifried et al., Reference Seifried, Steingass, Hoffmann and Rodehutscord2016a). Corresponding differences between genotypes can be also expected for other widely cultivated cereal grains such as rye and triticale, but data describing the ruminal ST degradation of defined genotypes of these grains are scarce. Variation between the different genotypes of a single-grain species suggests that the genetic modification of cereal grains by breeding might have altered the nutritive value, leading to possible changes after the current feed table values were obtained. The aforementioned studies also indicated variation between the different genotypes of a single-grain species, but available data are mostly based on studies that utilised small sample sizes.
The comparability between different studies is limited when they are based on different methodological approaches (Vanzant et al., Reference Vanzant, Cochran and Titgemeyer1998; López et al., Reference López, France, Dhanoa, Mould and Dijkstra1999). López et al. (Reference López, France, Dhanoa, Mould and Dijkstra1999) concluded that the use of different non-linear models to describe ruminal degradation leads to similar results, whereas changes in the experimental part of in situ investigations could lead to great differences between studies (Seifried et al., Reference Seifried, Steingaß and Rodehutscord2015). Thus, variation in methodology limits the comparability between the results of different studies (Vanzant et al., Reference Vanzant, Cochran and Titgemeyer1998) and a standardised procedure should be used when grains are compared. Hence, the first objective of the present study was to characterise and compare the in situ degradation of ST and dry matter (DM) using a well-defined set of rye, triticale and barley samples.
In vitro systems are often used as an alternative to in situ experiments for the characterisation of ruminant feeds. Analogous to in situ experiments, methodological variation leads to limited comparability of results between in vitro studies that use different approaches. The authors are not aware of any study that investigated different genotypes of rye, triticale and barley (based on standardised in situ and in vitro methodologies), which generated directly comparable results. Hence, the second objective was to compare in situ and in vitro degradation characteristics of grains and to estimate the metabolisable energy (ME) and digestibility of organic matter (dOM) metrics based on in vitro characteristics.
Material and methods
Grain samples
In total, 20 samples each of barley, triticale and rye grain were generated within the framework of the collaborative research project ‘GrainUp’ (Rodehutscord et al. Reference Rodehutscord, Rückert, Maurer, Schenkel, Schipprack, Bach Knudsen, Schollenberger, Laux, Eklund, Siegert and Mosenthin2016). The cereals were grown under standardised environmental and agronomic conditions at the Agricultural Experiment Station of the University of Hohenheim. All samples were analysed for DM, ash, CP, ether extract (EE), crude fibre, NDF assayed with a heat stable amylase exclusive of residual ash (aNDFom), ADF exclusive residual ash (ADFom), amino acids (AA), minerals and gross energy. Each sample was physically characterised based on the thousand seed weight, test weight, falling number and extract viscoelasticity. The results of all analyses were reported by Rodehutscord et al. (Reference Rodehutscord, Rückert, Maurer, Schenkel, Schipprack, Bach Knudsen, Schollenberger, Laux, Eklund, Siegert and Mosenthin2016) using the same genotype numbering scheme as the present study, including chemical analysis reported herein.
In situ and in vitro procedures
The in situ and in vitro trials were conducted according to Seifried et al. (Reference Seifried, Steingass, Hoffmann and Rodehutscord2016a) using a randomly assigned repeated measures design. The in situ incubations were conducted using three lactating ruminally fistulated Jersey cows. The total mixed ration provided during the experiments consisted of 41% concentrate (25% maize, 25% rapeseed cake, 20% barley, 20% field beans and 10% peas), 21% maize silage, 16% meadow hay, 15% grass silage, 3% rapeseed meal, 2% of barley straw and 2% mineral mixture (on DM basis). The trials were conducted in a period of 4 months. The average milk yield was 24 l/day, and the average DM intake of the cows was 18 kg/day.
In preparation for the in situ studies, grain samples were ground through a 2-mm sieve (cutting mill SM 100 comfort, Retsch GmbH, Haan, Germany). Approximately 7 g of the respective sample (on DM basis) were then ruminally incubated over 0, 1, 2, 4, 8, 16, 24 and 48 h in polyester bags (pore size: 50 µm, 10×20 cm; ANKOM Technology, Macedon, NY, USA). The 0 h samples were not incubated, but washed to determine the loss occurring without incubation. Each genotype was incubated in three animals over each timespan, resulting in ~1400 samples of feed and bag residues. Three bags were incubated per animal, timespan and genotype for incubations up to 4 h. Regarding incubations of 8 h and longer, five replicates per animal, timespan and genotype were used. For chemical analyses, the bags were pooled by animal, incubation time and genotype. Samples that were incubated for 24 and 48 h were pooled by genotype and incubation time, because little residue was present in the bags at these time points.
The ST and CP concentrations of grains and the ST concentration of the incubated residues were estimated using NIRS. To record NIR spectra with a SpectraStarTM 2500x (Unity Scientific, Brookfield CT, USA; Software: InfoStar V3.11.1), the samples and their residues were pulverised after in situ incubation (Pulverisette, Fritsch GmbH, Idar-Oberstein, Germany). In total, 408 samples were used to compute the ST calibration (
 $R_{{{\rm validation}}}^{2} $
=0.99; standard error of prediction=2.29%; biasvalidation=−0.03%). The CP calibration was computed based on 425 samples (
 $R_{{{\rm validation}}}^{2} $
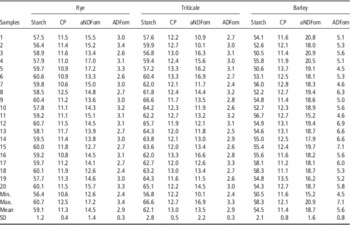
=1.00; standard error of prediction=0.43%; biasvalidation=0.01%). The validation set consisted of 134 and 136 samples for ST and CP, respectively. The ST concentrations of samples used for calibration and validation were analysed using the hexokinase method as described by Seifried et al. (Reference Seifried, Steingass, Schipprack and Rodehutscord2016b), and the CP concentration was also determined (Verband Deutscher Landwirtschaftlicher Untersuchungs- und Forschungsanstalten (VDLUFA), 2007, method 4.1.1). The ST and CP concentrations of the grain samples that were estimated by NIRS and the chemically analysed aNDFom and ADFom concentrations are shown in Table 1.
Starch, CP, NDF assayed with a heat stable amylase exclusive of residual ash (aNDFom) and ADF exclusive residual ash (ADFom) concentrations of 20 genotypes of rye, triticale and barley grainsFootnote 1 (% in dry matter)

1 Predicted by NIRS using the calibrations described in the Material and methods section. Other fractions originally published by Rodehutscord et al. (Reference Rodehutscord, Rückert, Maurer, Schenkel, Schipprack, Bach Knudsen, Schollenberger, Laux, Eklund, Siegert and Mosenthin2016).
The following exponential model, suggested by Ørskov and McDonald (Reference Ørskov and McDonald1979) was fitted to the degradation data in order to describe the ruminal degradation of ST and DM depending on the time (separately for every animal; n=3 replicates/grain genotype):
 $$y\,{\equals}\,a{\plus}b{\times}\left( {1{\rm }-{\rm }e^{{-c{\times}t}} } \right)$$
This model differentiates between the washout fraction a (%), the potentially degradable fraction b (%) and the degradation rate c (%/h). The sum of fractions a and b equates to the plateau value of the curve or the maximal degradable fraction, which will be referred to as the a + b fraction. The a+b fraction was constrained to not exceed 100%. The ST degradation parameters will be referred to as aST, a + bST and cST. The parameters describing DM degradation kinetics will be referred to as aDM, a+bDM and cDM. The ED (%) was calculated using equation (2) (Ørskov and McDonald, Reference Ørskov and McDonald1979) exemplary for a ruminal passage rate (k) of 8%/h (ED8). The ED can be calculated for any other passage rate using the data presented in Supplementary Tables S1 to S3.
 $${\rm ED}_{8} \,{\equals}\,a{\plus}\left( {\left( {b{\times}c} \right)/\left( {c{\plus}k} \right)} \right)$$
The in vitro experiments were based on the Hohenheim Gas Test as described by Menke and Steingass (Reference Menke and Steingass1988), and were performed according to Seifried et al. (Reference Seifried, Steingass, Hoffmann and Rodehutscord2016a). Briefly, ~200 mg (on DM basis) of the grains were ground through a 1-mm screen and were then weighed in glass syringes (100 ml). The rumen fluid of two cannulated lactating cows (collected before the morning feeding) was mixed (~1 : 1), filtered through gauze and subsequently mixed with a buffer solution (bicarbonate buffer). The buffered rumen fluid was dispensed into glass syringes under continuous flushing with CO2. The incubations were conducted in an air forced oven for 72 h at 39°C. In addition, standard samples with known gas formation and blanks (containing the incubation medium only) were incubated in triplicate. For each sample, a curve following equation (3) was fitted to the cumulative gas production data after 2, 4, 6, 8, 12, 24, 48 and 72 h incubation periods, and six replicates per genotype were initiated. Syringes with leakages were discarded, resulting in a minimum number of four values per time point and sample.
The potential gas production (b gas, ml/200 mg DM) and the gas production rate (c gas, %/h) were calculated as follows:
 $$y\,{\equals}\,b_{{{\rm gas}}} {\times}{\rm }\left( {1{\hbox -}e\hskip 1pt^{{\hbox-c}} \hskip 1pt_{{{\rm gas}}} ^{{\hskip 5pt\hskip 3pt{\times}{\rm }t}} } \right)$$
Gas production after 24 h of incubation (Gp24, ml/200 mg DM) was used to estimate ME and dOM. The ME content of the samples was estimated using a modified equation of Menke and Steingass (Reference Menke and Steingass1988), which was calibrated using the ME from digestible nutrients in vivo with equation 3.38 of Schiemann et al. (Reference Schiemann, Nehring, Hoffmann, Jentsch and Chudy1971) as the reference values (ME71vivo). Because Gesellschaft für Ernährungsphysiologie (1995) modified the calculation of ME from digestible nutrients in vivo (ME95vivo), the equation of Menke and Steingass (Reference Menke and Steingass1988) was adapted to the new reference ME95vivo. For cereals and cereal by-products that were rich in ST (n=24), a linear regression for the calculation of ME95vivo from ME71vivo was generated:
 $${\rm ME}95_{{{\rm vivo}}} \,{\equals}\,0.9065\,{\rm ME}71_{{{\rm vivo}}} {\plus}0.6214{\rm }\left( {R^{2} \,{\equals}\,0.99} \right)$$
By inserting the slope and intercept of this equation into the original equation of Menke and Steingass (Reference Menke and Steingass1988), based on Gp24, the grain ME content was calculated as follows:
 $$\eqalignno {{\rm ME}\,\left( {{\rm MJ}/{\rm kg}\,{\rm DM}} \right) &\,{\equals}\, 0.9065\,( {1.681{\plus}0.157\,{\rm Gp}24} \cr & \,{\plus}0.0084 \,{\rm CP} {\plus}0.022\,{\rm EE}{\minus}0.0081\,{\rm ash} \right)$$
where Gp24 is the cumulative gas production after 24 h of incubation (ml/200 mg DM).
The dOM was estimated using the following equation (Menke and Steingass, Reference Menke and Steingass1988):
 $${\rm dOM}\,\left( \,\%\, \right)\,{\equals}\,9{\plus}9.991\,{\rm Gp}24{\plus}0.595\,{\rm CP}{\plus}0.181\,{\rm ash}$$
Statistical analysis
The exponential regression of in vitro gas production and in situ degradation data, depending on incubation time, were calculated using GraphPad Prism (version 5.00 for Windows, GraphPad Software Inc., San Diego, CA, USA). For in situ data the regressions were performed for each animal, using the incubated bags at each time point as repeated measurements. This resulted in three values (one per animal) for each parameter and genotype. The comparison of in situ degradation and gas production parameters between the grain species was performed using the mixed procedure and pairwise t-test using SAS version 9.3 of the SAS system for Windows (SAS Institute Inc., Cary, NC, USA). For the comparison of in situ degradation parameters and the ED between the grain species the animal was considered a random effect leading to the model y ij =µ+grain_species i +animal j +e ij .
At least four repeated measures per time point were used for the estimation of gas production kinetics (three runs, two repetitions in each run), resulting in one value per genotype and parameter. For the comparison of the in vitro gas production between the grain species the statistical model y i =µ+grain_species i +e i was used. The correlations between the parameters estimated from the in situ and in vitro data and the chemical composition (ST, CP, EE, aNDFom, ADFom and ADL) of the grains were computed for all samples and for each species separately using GraphPad Prism (version 5.00 for Windows, GraphPad Software Inc., San Diego, CA, USA). The significance of Pearson-correlations was tested by computing two-tailed t-test. All statistical tests were performed at a level of significance of α=0.05.
Results
In situ degradation
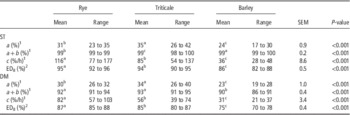
The estimated parameters describing in situ ST and DM degradation kinetics are shown in Table 2. In addition, the estimated degradation parameters of each single genotype are shown in Supplementary Tables S1 to S3. All ST degradation parameters differed significantly between the grain species (P<0.001).
Estimated parameters describing the ruminal starch (ST) and dry matter (DM) degradation of rye, triticale and barley grains in situ (n=20 genotypes/species; least square mean and SEM).

The aST-fraction was highest for triticale, followed by rye and barley, which exhibited the lowest aST-fraction (Table 2). The a+b fraction differed significantly between the grain species, but only varied between 98% and 100% for all grains. The mean cST was significantly higher for rye than for triticale and barley. Among the estimated parameters, the cST value varied most within a single-grain species, and the highest absolute difference in cST within a single species was detected in rye, which had cST values that differed up to 100%/h. When samples of all grain species are considered, the cST ranged from 28%/h (barley) to 177%/h (rye). However, ED8 values were less variable than cST, and ranged from 82% (barley) to 96% (rye). The ED8 values of the grain species followed the same order as the cST values.
The DM degradation parameters, with the exception of the a+b fraction, were in the same order as the ST degradation parameters (Table 2). Barley had the significantly lowest a+bDM fraction, whereas rye and triticale did not differ significantly. Compared with the cDM-values, cST values were higher for all species. Furthermore, the aDM-fraction was at the same level as the corresponding aST-fraction.
In vitro measures
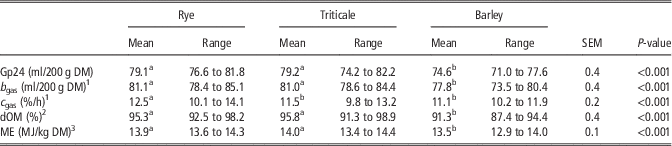
The lowest mean estimate of b gas was found in barley (Table 3). Rye and triticale differed significantly in their c gas values, but no differences were detected in all other in vitro parameters that were tested in those species. The Gp24 measurements of all samples ranged from 71.0 (barley) to 82.2 ml/200 mg DM (triticale) and were significantly lower for barley than for rye and triticale. The estimated dOM and ME values were significantly higher for rye and triticale than for barley. The dOM values varied between 91% and 99%, and ME ranged between 12.9 and 14.4 MJ ME/kg DM. The gas production data and the estimated dOM and ME values for single genotypes are presented in Supplementary Table S4.
Gas production after 24 h of incubation (Gp24), gas production kinetics, estimated digestibility of organic matter (dOM) and estimated metabolisable energy (ME) concentrations of different cereal grains (n=20 genotypes per species; least square means).

Correlations
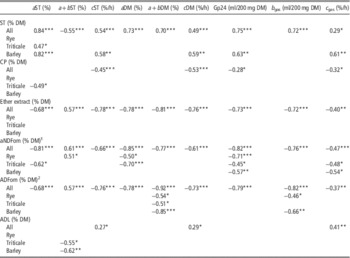
Pearson product-moment correlation coefficients for selected combinations of traits are shown in Table 4. The ST concentration was significantly positively correlated with aST fractions and cST values when calculated for all species and within barley, but it was not significant within rye and triticale. The ST concentration was negatively correlated with the a+bST fraction when calculated for all species, but not when calculated for each species separately. The ST concentration was also significantly positively correlated with Gp24 and c gas estimates, whereas the CP concentration was negatively correlated with Gp24 and c gas estimates. The EE, aNDF and ADFom concentrations were significantly negatively correlated to all in vitro gas production parameters. The aNDFom concentration was also significantly negatively correlated with Gp24 values when calculated for each grain species separately. ADL concentration was positively correlated with c gas values.
Significant Pearson correlation coefficients between nutrients and ruminal in situ degradation characteristics of starch (ST) and dry matter (DM) and the in vitro gas production parameters of rye, triticale and barley grains (n=20 genotypes per species).
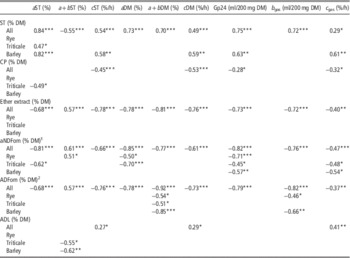
a=washout fraction; a+b=maximal degradable fraction; c=degradation rate; Gp24=cumulative gas production after 24 h incubation; b gas=potential in vitro gas production per 200 mg DM; all=rye, triticale and barely samples.
1 NDF analysed using a heat stable amylase, exclusive residual ash.
2 ADF exclusive residual ash.
*P<0.05, **P<0.01, ***P<0.001.
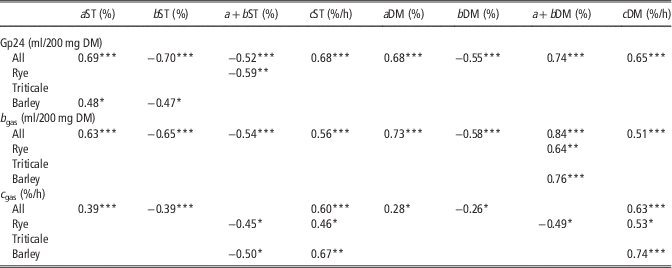
Correlations between the in situ degradation and in vitro gas production kinetics are shown in Table 5. The b gas and the Gp24 values were significantly negatively correlated with the a+bST fraction, but were positively correlated with the a+bDM fraction. Gp24 measurements were also significantly negatively correlated with the a+bST fraction when calculated within rye (P=0.006).
Pearson correlation coefficients between the in situ ruminal degradation of starch (ST) and dry matter (DM) and the in vitro gas production of rye, triticale and barley grains (n=20 genotypes per species).

Gp24=cumulative gas production after 24 h incubation; b gas=maximal gas production per 200 mg DM; c gas=gas production rate; a=washout fraction; a+b=maximal degradable fraction; c=degradation rate.
P<0.05, **P<0.01, ***P<0.001.
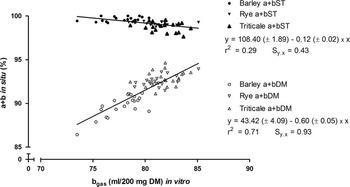
The correlation between a+bST and b gas parameters was negative (Figure 1). However, this relationship was not significant when barley was excluded from the calculation (P=0.06). The a+bDM fraction was positively correlated with b gas when calculated for all samples, when calculated without barley (P=0.003), and when separately calculated within rye (P=0.002) and barley (P<0.001). The c gas parameter was significantly positively correlated with cST and cDM for all grain species (P<0.001) as well as within rye (P=0.04 and 0.02, respectively) and barley (P<0.001 and P=0.001, respectively).
Relationship between the in vitro potential gas production (b gas) and the ruminal in situ asymptotic maximum of starch (a+bST) and dry matter (a+bDM) degradation for triticale, rye and barley grains (n=20 genotypes per species).

Discussion
Variation within a single-grain species
In contrast to the relatively homogenous values for the a+bST-fraction, the variation of cST was high within grain species, especially in rye, and the a-fraction also varied within the grain species. Different protein fractions have been found to influence the solubility and ruminal degradation of cereal grain proteins (Nikokyris and Kandylis, Reference Nikokyris and Kandylis1997). Because of interactions of the protein matrix with ST granules, variation in the properties of cereal grain proteins could contribute to differences in the in ST degradation kinetics. Highly soluble albumins and globulins are high in Lys but low in Pro and Glu, whereas poorly soluble prolamins are high in Pro and Glu but low in Lys. Seifried et al. (Reference Seifried, Steingass, Schipprack and Rodehutscord2016b) showed that the concentrations of Pro and Glu were negatively correlated with the ST degradation of maize grains in the rumen, whereas the Lys concentration was positively correlated with the ED of ST. These results indicated that the distribution of different protein fractions in maize grains influenced in situ degradation measurements. Therefore, a corresponding connection between protein fractions and estimated parameters of in situ degradation could be hypothesised for other grains. However, for the grain species investigated in the present study, corresponding correlations between in situ degradation parameters and the AA pattern were not detected (data not shown), and this is consistent with previous findings for wheat grains (Seifried et al., Reference Seifried, Steingass, Hoffmann and Rodehutscord2016a). The missing interactions could be due to low variation in AA concentrations and the ST degradation parameters of soft grains (compared with maize).
The high cST values led to small differences in the ED of ST within grain species. Second to the relatively small variation in nutrient concentrations, this might be one reason why correlations between nutrient concentrations and in situ degradation parameters were low, and it might also explain why these data could not be used to clarify the variation of the ED of ST within grain species. Regarding the application in feed formulation, the low variation and weak correlations with nutrient concentrations suggest the utilisation of mean values for the ED of ST and the ED of DM for each grain species. The degradation parameters estimated in the present study for barley were in the same range as previously reported values (Khorasani et al., Reference Khorasani, Helm and Kennelly2000; Ramsey et al., Reference Ramsey, Mathison and Goonewardene2001). The authors of the present study are not aware of similar comprehensive studies that investigated rye and triticale. Offner et al. (Reference Offner, Bach and Sauvant2003) described the ruminal degradation of two triticale samples, and reported an ED6 of 93.4±4.7% and a c-value of 58±7.6%/h) for ST, which is similar to the findings of the present study. However, variation in the a-fraction was higher (45.3±39.5). Liu et al. (Reference Liu, McKinnon, Thacker and Yu2012) investigated the ruminal degradation of triticale DM using three varieties, and found lower values for all parameters and ED6 (74.5%) as compared with the present findings. For rye ST, degradation parameters and ED reported by Benninghoff et al. (Reference Benninghoff, Paschke-Beese and Südekum2015) were lower compared with the present data. Besides variation of the incubation procedure (e.g. the usage of smaller pore sizes by Benninghoff et al., Reference Benninghoff, Paschke-Beese and Südekum2015), the differences between studies might be related to the fact that grains used in the present study were all grown under the same agronomic conditions and at the same locality, which lowers the possibility of compositional variation. Differences in grain characteristics in a single cultivar, resulting from different cultivation conditions, have been shown for rye (Hansen et al., Reference Hansen, Møller, Andersen, Jørgensen and Hansen2004) and triticale grains (Lestingi et al., Reference Lestingi, Bovera, De Giorgio, Ventrella and Tateo2010). The relatively small differences in gas production found within a single species in the present study might also have resulted from standardised cultivation, which led to a relatively little variation in the chemical composition of the cereal grains. Therefore, the results of the present study indicate that under the prevailing environmental conditions, genetic differences within the species have little effect on ruminal fermentation characteristics that were determined in vitro and in situ. Hansen et al. (Reference Hansen, Møller, Andersen, Jørgensen and Hansen2004) found more similarities between different rye cultivars that were cultivated in the same year than between the same cultivar harvested in different years. These results, in combination with the results from the present study, suggest that agricultural and environmental conditions might play an important role in the in vitro fermentation behaviour of different grain cultivars.
Variation between grain species
Major differences were found for the aST- and the cST-fractions between the grain species. The molecular structure of ST granules appears to have only a minor influence on the degradation characteristics of ST as compared with the effects of the protein matrix (McAllister et al., Reference McAllister and Cheng2006; Stevnebø et al., Reference Stevnebø, Seppälä, Harstad and Huhtanen2009). Differences between the species in the structure of the protein matrix embedding the ST granules seem to be a major reason for differences observed in in situ degradation (McAllister et al., Reference McAllister, Phillippe, Rode and Cheng1993). It is known that the ST degradation of maize grains is slower and less extensive than in other cereals, and this characteristic is due to the proteins in its endosperm that impede the adhesion of and degradation by rumen microorganisms (McAllister and Cheng, Reference McAllister, Gibb, Beauchemin and Wang1996). The protein matrix and its interaction with ST granules could also have influenced the ruminal degradation of the grains in the present study. Aufrère et al. (Reference Aufrère, Graviou, Demarquilly, Vérité, Michalet-Doreau and Chapoutot1991) found a higher solubility of rye proteins compared with those of barley and triticale. Under the assumption that the protein matrix influences ST degradation, this could be a possible explanation for the high cST of rye in the present study.
However, other factors could be involved in the remarkable high cST of rye. For instance, one possible explanation could be the high concentration of alkylresorcinols in rye as compared with other grains (Kozubek and Tyman, Reference Kozubek and Tyman1999; Ziegler et al., Reference Ziegler, Steingass, Longin, Würschum, Carle and Schweiggert2015), which are capable of modifying enzymatic activity (Kozubek and Tyman, Reference Kozubek and Tyman1999; Nikolaev et al., Reference Nikolaev, Loiko, Stepanenko, Shanenko, Martirosova, Plakunov, Kozlova, Borzenkov, Korotina, Rodin, Krupyanskii and El-Registan2008).
Although in vitro gas production can be used as an indicator for ruminal degradation results presented in Table 5 shows a significantly negative correlation between the a+bST fraction and b gas when all samples are used for calculation. Figure 1 shows that the reason for the significantly negative correlation is the lower b gas and higher a+bST fraction of barley samples compared with samples from other grain species. Accordingly, the significant correlation between b gas and a+bST fraction does no longer exist when barley is excluded from the calculations. The low b gas value of barley can be explained by the relatively lower ST concentration caused by the hull content of barley samples. Therefore, the significantly negative correlation and the negative slope of the regression between the a+bST fraction and b gas do not indicate a causal relationship between the b gas and a+bST fraction of the investigated grains, but can be seen as an effect of the specific properties of barley.
Other aspects
The estimated ME contents for all species were at the same levels as the corresponding values reported in in vivo digestibility studies conducted with a subset of the samples used in the present study (Priepke, A., personal communication). If the results of the present study are combined with other findings from the GrainUp project (Seifried et al., Reference Seifried, Steingass, Hoffmann and Rodehutscord2016a and Reference Seifried, Steingass, Schipprack and Rodehutscord2016b), the grain species can be ranked according to their ruminal the ED of ST as follows: rye (95%)>triticale (93%)>wheat (91%)>barley (85%)>maize (55%).
In some studies, in situ degradation is corrected for small particle losses, which are defined as the differences between the washout fraction and the water soluble fraction (Weisbjerg et al., Reference Weisbjerg, Bhargava, Hvelplund and Madsen1990). As untreated ST of cereal grains is considered insoluble in water (BeMiller and Whistler, Reference BeMiller and Whistler2009), it was assumed that the washout fraction of ST consisted only of small, non-soluble particles in the present study. If the degradation is corrected for particle loss, the same degradation kinetics are assumed for small, washed out particles and larger particles that remained inside of the polyester bag. The degradation rate increases with decreasing particle size (Anele et al., Reference Anele, Refat, Swift, Zhao, Doublier, McAllister and Yang2015), so washed out particles should be degraded faster than particles inside of the polyester bag. On the other hand, small particles have the potential to escape the rumen undegraded via the liquid phase. Assuming the same degradation kinetics for small washed out particles and for particles remaining inside of the polyester bags appears inadequate in both cases. Therefore, a correction for particle loss was not conducted in the present study.
The results of the present study suggest that the ED of ST and the ED of DM variation within genotypes of rye, triticale and barley was only minor or moderate. Regarding ration formulation, it is suggested that the mean ED values of each grain species are used, and that variation among genotypes is neglected. However, possible effects on ruminal degradation caused by location, year and agronomic conditions still need to be investigated. Rye ST is rapidly degraded in the rumen, and this should be considered when using high proportions of rye in dairy cow rations because of the possible development of rumen acidosis.
The c gas value in vitro and the cDM and cST values in situ were positively correlated, and they led to the same ranking of the grain species. Furthermore, the a+bDM-fraction and b gas values were positively correlated, indicating consistency amongst the methods. On the other hand, the differences between grain species and the ranking of genotypes within grain species deviated between in situ and in vitro methodologies. To correctly determine which method describes the actual variability in ruminal degradation, additional studies using in vivo methods are necessary. Hence, which approach leads to more accurate estimations cannot be concluded. The methods used in the present study should be seen as complementary and not as replacements for each other as in vitro incubations allow fast and relatively easy estimations of dOM and ME and in situ studies can be used for more detailed descriptions of ruminal degradation kinetics.
Acknowledgements
This project was supported by funds from the Federal Ministry of Food and Agriculture (BMEL) based on a decision by the Parliament of the Federal Republic of Germany via the Federal Office for Agriculture and Food (BLE) under the innovation support programme. J.K. was supported by a graduate scholarship granted by the state of Baden-Württemberg via the Faculty of Agricultural Sciences of Hohenheim University. The authors also like to thank H. Schenkel and E. Koenzen for the support during establishment of the NIRS calibrations.
Supplementary Material
To view supplementary material for this article, please visit https://doi.org/10.1017/S1751731117000337