



I. INTRODUCTION
Many metal triflourides, MF3 including GaF3, crystallize in the VF3-type structure (Leblanc et al., Reference Leblanc, Pannetier, Ferey and de Pape1985; Roos and Meyer, Reference Roos and Meyer2001). The VF3 structure is composed of corner sharing MF6 octahedra and therefore is structurally related to perovskite-type compounds AMX
3 as well as to the ReO3 structure (Meisel, Reference Meisel1932). The non-distorted perovskite-type compounds are cubic with space group
 $Pm\overline {\rm 3} \,m{\rm,} $
while the VF3 structure, which is derived from the ReO3 structure by coupled rotations of the MF6 octahedra around one of the cubic body diagonals, is rhombohedral with space group is
 $R {\bar {\rm 3}}\, c $
, which is a subgroup of
 $Pm\overline {\rm 3} \,m$
. Structural changes of VF3-type compounds are conveniently described as a rhombohedral deformation of a sphere packing of type 8/3/c2 (Sowa and Ahsbahs, Reference Sowa and Ahsbahs1998). The spheres of the 8/3/c2 sphere packing form octahedral and cubooctahedral voids, and each sphere has eight nearest-neighbour contacts and the smallest mesh has three edges (Fischer, Reference Fischer1973). The volume of the octahedral voids remains constant during a rhombohedral deformation of the 8/3/c2 sphere packing while the volume of the cubooctahedral voids is diminished. The anions of the VF3-type compounds are in this model considered as hard spheres and the trivalent cations are located in the octahedral voids. The A-cation site is vacant in the VF3-type structure and the simplest conceivable compression mechanism of compounds belonging to this structure type is a coupled rotation of the MF6 octahedra around the c-axis (hexagonal setting), which will shorten the length of the a-axis and diminish the volume of the cubooctahedral voids while leaving the length of the c-axis unchanged. The linear compressibility of the a-axis is expected to be high as the restoring force is because of the bending of the M–F–M bonds, and a 30° rotation around one of the body diagonals of the
 $Pm\overline {\rm 3} \,m$
structure leads to the hexagonal close packing of the framework atoms X. The ∠M–F–M bond angle decreases from 180° in the cubic
 $Pm\overline {\rm 3} \,m$
structure to 131.8° when hexagonal close packing of the F atoms is achieved.
Several studies of the compression mechanism of VF3-type compounds have been performed using both X-ray and neutron diffraction techniques. TiF3 and FeF3 were studied by high-pressure X-ray diffraction and both compounds were found to exhibit pressure-induced octahedral strain at elevated pressures. The compression mechanism was found to be anisotropic as the volume reduction was achieved through shortening of the hexagonal a lattice parameter, while c-lattice parameter was found to exhibit a small elongation for increasing pressures (Sowa and Ahsbahs, Reference Sowa and Ahsbahs1998). In addition, CrF3 and FeF3 have been studied by time-of-flight neutron powder diffraction and these studies showed that the ∠Cr–F–Cr bond angle was reduced from 144.80(7)° to 133.9(4)° at p max = 8.56 GPa, while the corresponding ∠Fe–F–Fe bond angle was reduced from 152.5(2)° to 134.8(3)° at p max = 8.28 GPa and both compounds were observed to develop pressure-induced octahedral strain (Jørgensen et al., Reference Jørgensen, Marshall and Smith2004, Jørgensen and Smith, Reference Jørgensen and Smith2006). The aim of the present experiment was to obtain detailed structural information on GaF3 at elevated pressures.
II. EXPERIMENTAL
High-pressure X-ray diffractograms were measured on a powdered GaF3 sample (Aldrich) loaded in a diamond anvil cell with methanol/ethanol (4:1) mixture as a pressure-transmitting medium. The sample was loaded into a hole of 200 µm in diameter drilled in a stainless steel gasket preindented to 70 µm. The measurements were performed at the Swiss-Norwegian Beam Lines (BM1A) of the European Synchrotron Radiation Facility (ESRF, Grenoble, France) using a wavelength of 0.69775 Å and MAR345 image plate detector. The wavelength, sample-to-detector distance (250 mm) and parameters of the detector were calibrated using NIST standard LaB6. The beam was slit collimated to 100 × 100 µm2. Pressure was determined on a ruby crystal with ~0.1 GPa precision (Forman et al., Reference Forman, Piermarini, Barnett and Block1972; Mao et al., Reference Mao, Xu and Bell1986). The recorded powder patterns were first integrated in the FIT2D software and then analysed by the Rietveld method using the FullProf program suite (Rodríguez-Carvajal, Reference Rodríguez-Carvajal1993). CrystalExplorer (Version 3.1) was used for illustrating void spaces (Wolff et al., Reference Wolff, Grimwood, McKinnon, Jayatilaka and Spackman2012).
III. RESULTS AND DISCUSSION
Powder diffraction profiles of GaF3 were recorded in the pressure range from 0.0001 to 10 GPa and inspection of the peak profiles gave no indication of any change of symmetry. Rietveld refinements of the measured powder diffraction profiles were therefore performed in space group
 $R {\bar {\rm 3}}\, c $
. Small Bragg peaks originating from a minor impurity of GaF3.3H2O were visible in powder patterns recorded for p ≤ 3 GPa. The GaF3.3H2O phase was included in the Rietveld refinements for p ≤ 3 GPa using structural parameters from the isostructural fluoro-hydrate CrF3.3H2O (Herbstein et al., Reference Herbstein, Kapon and Reisner1985). The refined structural parameters of GaF3 are given in Table 1 and Figure 1 shows, as a representative example, the measured and calculated X-ray powder diffraction profiles of GaF3 at 10 GPa. The pressure dependence of the lattice parameters a and c (hexagonal setting) is shown in Figure 2. The a-axis decreases monotonically with the pressure and it is reduced by 8.8% at the highest measured pressure of 10 GPa and a change in the linear compressibility is observed at ≈4 GPa. The pressure dependence of the c-axis is much smaller and non-monotonous as it exhibits a maximum at ≈3 GPa (0.17% increase), while the overall reduction is 0.4% at 10 GPa. The insert of Figure 2 shows the √3/3·c/a ratio vs. pressure. This ratio is equal to 1.633 at ≈7.9 GPa corresponding to hexagonal close packing of the fluorine atoms. The volume of the unit cell is plotted as a function of pressure in Figure 3 and a change in the compressibility is again observed at ≈4 GPa where the compressibility is seen to decrease. The unit-cell volume is reduced by 10.6% at 4 GPa and the reduction increases to 17.2% at 10 GPa. The data measured for p ≤ 4 GPa were used for the determination of the bulk modulus B
0 of GaF3 by use of the third-order Birch–Murnaghan equation of state:
 $$P = \displaystyle{{\rm 3} \over 2}{.}B_{\rm 0} (x^{ - {\rm 7}/{\rm 3}} - x^{ - {\rm 5}/{\rm 3}} )\left[ {{\rm 1} - \displaystyle{{\rm 3} \over 4}{.}({\rm 4} - B^{\prime}_{\rm 0} )(x^{ - {\rm 2}/{\rm 3}} - {\rm 1})} \right],$$
where x denotes the volume ratio V/V 0 (with V 0 being the volume at zero pressure) while B 0 and B′0 are the isothermal bulk modulus at ambient pressure and its pressure derivative, respectively. The least-squares fit to the measured data yielded the following value for the bulk modulus: B 0 = 28(1) GPa with B′0 and fixed at the values of 4 and V 0 = 282(2) Å3.
(Color online) Observed (red dots) and calculated (black curve) X-ray powder diffraction profiles of GaF3 at 10 GPa. Green vertical bars mark the positions of the Bragg reflections and the lower blue curve represents the difference between the observed and calculated intensities.

(Color online) Lattice parameters a and c plotted as a function of pressure. The a- and c-axes are reduced by 8.8 and 0.4%, respectively, at 10 GPa and the c-axis expands slightly up to ≈3 GPa. An anomalous change in compressibility is observed at ≈4 GPa. The insert shows the √3/3·c/a ratio vs. pressure. This ratio is equal to 1.633 at ≈7.9 GPa corresponding to hexagonal close packing of the fluorine atoms.

(Color online) Unit-cell volume of GaF3 plotted as a function of pressure. The solid red line represents a fit to third-order Birch–Murnaghan equation of state yielding bulk modulus B 0 = 28(1) GPa (see text). The dash-dotted line is a guide to the eye.

Refined structural parameters for GaF3.

Space group:
 $R {\bar {\rm 3}}\, c $
#167, Ga: 6b (0 0 0), F: 18e (x 0 ¼).
The simplest description of the compression mechanism of VF3-type compounds is in terms of deformation of an 8/3/c2 sphere-packing model in space group
 $R {\bar {\rm 3}}\, c $
as mentioned above and the x-coordinate of the spheres (F atoms) is in this model determined by c/a ratio and given by Sowa and Ahsbahs (Reference Sowa and Ahsbahs1998):
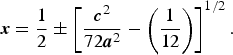 $${\bi x} = \displaystyle{1 \over 2} \pm \left[ {\displaystyle{{{\bi c}^2} \over {72{\bi a}^2}} - \left( {\displaystyle{1 \over {12}}} \right)} \right]^{1/2}. $$
Figure 4 shows the c/a ratio plotted as function of the fluorine x-coordinates. The deformation of the 8/3/c2 sphere-packing model gives a reasonable description of the compression mechanism of GaF3 as the observed linear compressibility the a-axis is substantially larger than that of the c-axis. However, minor but significant deviations from the sphere-packing model are observed and the refined c/a and x-values for GaF3 show an increasing deviation from the sphere packing model at elevated pressures and the non-monotonous pressure dependence of the length of the c-axis is also at variance with the predictions of the 8/3/c2 sphere-packing model, which predicts a constant length of this axis during compression.
(Color online) The c/a ratio plotted as function of the refined fluorine x-coordinates. The solid line is calculated from the 8/3/c2 sphere-packing model (see text). An increasing deviation from the sphere packing model is observed for increasing values of x (corresponding to increasing pressure).

The pressure-induced structural changes of the GaF6 octahedra are depicted in Figures 5 and 6. The Ga–F bond length and the two independent F–F distances d 1 and d 2 within the GaF6 octahedra are plotted as function of pressure in Figure 5, which shows that the Ga–F bond length is reduced by 0.8% at 10 GPa, while the F–F distances d 1 and d 2 decrease monotonically by 2.1 and 1.0%, respectively, up to ≈4 GPa and become constant above this pressure. Figure 6 shows the volume of the GaF6 octahedra and the octahedral strain [ε = |d 1 − d 2|/(d 1 + d 2)] plotted as a function of pressure. The volume of the GaF6 octahedra is reduced by 4.6% at ≈4 GPa and stays constant above this pressure. The octahedral strain ε initially also increases and saturates at a constant value for pressures higher than ≈3 GPa. The initial volume reduction of 4.6% of the GaF6 octahedra therefore accounts for ≈43% of the total volume reduction at 4 GPa and the increasing degree of distortion reflects an increasing elongation of the GaF6 octahedra along the c-axis (d 1 < d 2). The elongation of the GaF6 octahedra also explains the fact that the √3/3·c/a ratio exceeds 1.633 for p ≳ 7.9 GPa as shown in the insert of Figure 2. The above-mentioned coupled rotation angle ω of the GaF6 octahedra around the c-axis is calculated from the refined fluorine x-coordinates. A calculation of ω shows that it increases from 19.0(1)° at ambient pressure to 24.5(2)° at 4 GPa, and it is therefore concluded that compression of GaF3 is achieved through reduction of the volume of the GaF6 octahedra as well as through reduction of the volume of the cubooctahedral voids for p ≤ 4 GPa. The observed constant values of volume and strain of the GaF6 octahedra for p ≥ 4 GPa show that they become almost rigid polyhedra at elevated pressures. Compression of GaF3 is therefore almost entirely achieved through reduction of the volume of the cubooctahedral voids in this pressure range where ω increases to 28.2(2)° at 10 GPa, showing that the fluorine atoms are almost hexagonally close packed at this pressure. The corresponding ∠Ga–F–Ga bond angle was found to decrease from 145.01(5)° to 135.00(8)° within the pressure range from 0.0001 to 10 GPa and thereby approaching the value of 131.8° predicted by the 8/3/c2 sphere-packing model in the limit of hexagonally close packed spheres.
(Color online) Ga–F bond length and intra octahedral F–F distances d 1 and d 2 plotted as a function of pressure. The intra-octahedral F–F distances d 1 and d 2 are defined in the insert, which shows the GaF3 structure at ambient pressure viewed along the c-axis.

(Color online) Volume of the GaF6 octahedra and octahedral strain ε = |d 1 − d 2|/(d 1 + d 2) plotted as a function of pressure.

The reduction of the volume of the cubooctahedral voids is visualized in Figure 7, which shows the crystal structures of GaF3 and the cubooctahedral voids at ambient pressure, 5 and 10 GPa. The cubooctahedral voids are visualized as isosurfaces of the procrystal electron density (Turner et al., Reference Turner, McKinnon, Dylan Jayatilaka and Spackman2011). The three isosurfaces are drawn for isovalues of 0.005 e(Å−3) and cubooctahedral voids are seen to shrink for increasing pressures as predicted by the 8/3/c2 sphere-packing model. The volume of the cubooctahedral voids is reduced by 79% at 5 GPa and almost absent (99% reduction) at 10 GPa consistent with the proximity to close packing of the F− ions at this pressure as described above.
(Color online) Crystal structure of GaF3, including cubooctahedral voids at 0.0001, 5, and 10 GPa. Small yellow spheres and large grey spheres represent Ga and F, respectively. The isosurfaces of the cubooctahedral voids are drawn for isovalues of 0.005 e(Å−3). The volume of cubooctahedral voids are reduced by 79 and 99% at 5 and 10 GPa, respectively.

A comparison of the high-pressure behaviour TiF3, CrF3, FeF3, and GaF3 shows that their compression mechanisms are very similar although with minor differences. The c-axis of all four compounds exhibits negative linear compressibility at lower pressures and the octahedral strain ε increases at elevated pressures for all four compounds. The c-axis of TiF3 is elongated by 2.9% between 0.0001 and 5 GPa (Sowa and Ahsbahs, Reference Sowa and Ahsbahs1998), which is substantially larger than the corresponding values of 0.17% observed for GaF3 and CrF3 (Jørgensen et al., Reference Jørgensen, Marshall and Smith2004). In the case of FeF3 intermediate elongations of 0.77 and 1.1% of the c-axis have been observed (Sowa and Ahsbahs, Reference Sowa and Ahsbahs1998; Jørgensen and Smith, Reference Jørgensen and Smith2006). The octahedral stain ε of GaF3 saturates at ≈0.009 for p ≳ 3 GPa, which is comparable with the corresponding ε values of 0.005 and 0.008 for CrF3 and FeF3, respectively (Jørgensen et al., Reference Jørgensen, Marshall and Smith2004, Jørgensen and Smith, Reference Jørgensen and Smith2006). In addition, analysis of the results of Sowa and Ahsbahs (Reference Sowa and Ahsbahs1998) for TiF3 and FeF3 shows that the octahedral strain ε increases linearly up to about 3 GPa and saturates at values of 0.014 and 0.0063 for TiF3 and FeF3, respectively. However, in contrast to the high-pressure neutron diffraction studies of CrF3 and FeF3 (Jørgensen et al., Reference Jørgensen, Marshall and Smith2004, Jørgensen and Smith, Reference Jørgensen and Smith2006), no structural refinement was done in this study (Sowa and Ahsbahs, Reference Sowa and Ahsbahs1998), which was based on the assumption that the metal–fluorine bond length is independent of the pressure. Most interestingly, the observed change in the compressibility of GaF3 at ≈4 GPa as well as the initial reduction of volume of the GaF6 octahedra seems to be unique to this compound. The change in compressibility and the initial reduction of the volume of the GaF6 octahedra is mainly because of changes in the Ga–F bond length and d 1 F–F distance. The Ga–F bond length and d 1 F–F distance decreases up to about 4 GPa and becomes constant above this pressure and similar behaviour is not observed in the earlier high-pressure studies of CrF3 and FeF3 (Jørgensen et al., Reference Jørgensen, Marshall and Smith2004, Jørgensen and Smith, Reference Jørgensen and Smith2006).
IV. CONCLUSION
The compression mechanism of GaF3 was found to be highly anisotropic with the lengths of a- and c-axes being reduced by 8.8 and 0.4%, respectively, at the highest measured pressure of 10 GPa. The initial compression up to about 4 GPa is achieved through coupled rotations of the GaF6 octahedra around the c-axis, which is accompanied by volume reduction and distortion of the GaF6 octahedra, which become rigid polyhedral for pressures higher than 4 GPa. Compression at higher pressures is entirely achieved through the coupled rotation of the GaF6 octahedra which reduces the volume of the cubooctahedral voids. In addition, our work shows the usefulness of isosurfaces of the procrystal electron density for illustrating changes in void space in crystals at elevated pressures.
ACKNOWLEDGEMENT
The corresponding author JEJ gratefully acknowledge the beam time granted on at the Swiss-Norwegian Beam Lines (BM1A) at the European Synchrotron Radiation Facility (ESRF, Grenoble, France).



