

1. Introduction
Basalts are important rocks in orogenic settings because they can be related to past sutures between different terranes. However, they can be linked to a wide variety of tectonic settings; geochemistry and isotope geology are therefore powerful tools to obtain information about the tectonic origin of basaltic rocks (e.g. Pearce, Reference Pearce2008). In particular, subcontinental and sub-oceanic mantle sources can be evaluated in the generation of magmas derived from continental rifting and break-up. Processes of continental rifting initiation can produce continental flood basalts (CFBs) and enriched mid-ocean-ridge basalts (E-MORBs) related to passive and/or active upwelling events in the mantle (e.g. Bosworth et al. Reference Bosworth, Stockli and Helgeson2015).
CFBs and E-MORBs studied worldwide are typical tholeiites with low- and high-Ti content, relative high concentration of light rare earth elements (LREEs) and large-ion lithophile elements (LILEs) (De Min et al. Reference De Min, Piccirillo, Marzoli, Bellieni, Renne, Ernesto, Marques, Hames, Mchone, Renne and Ruppel2003). Even though MORBs and CFBs derive from partial melting of upwelling mantle, geochemical differences between them are the result of primary mantle composition, depth of partial melting, magmatic processes involved or the interaction with continental crust and/or lithosphere components.
MacDougall (Reference MacDougall1988) suggests that the generation of CFBs is directly related to a documented hotspot, whereas the generation of E-MORBs is not necessarily linked to hotspots. Pearce (Reference Pearce2008) states that this signature characterizes plume-distal ridges together with some incipient oceans and some small basins in long transform segments. Donnelly et al. (Reference Donnelly, Goldstein, Langmuir and Spiegelman2004) postulate that E-MORBs can be generated by: (1) low-degree melts that metasomatize the upper mantle to create an enriched source, which later undergoes large extents of melting; or (2) continuous processes of formation and destruction of enriched mantle sources by melting and convective mixing.
E-MORB magmatism is widespread in central-western Argentina, where a mafic–ultramafic belt is exposed over 400 km north–south along the western margin of the Precordillera (Fig. 1). This belt has been traditionally interpreted as the suture zone between the Chilenia and Cuyania terranes, both accreted during early Palaeozoic time to the western Gondwana margin (Ramos et al. Reference Ramos, Jordan, Allmendinger, Mpodozis, Kay, Cortés and Palma1986). Although some geochemical and petrogenetic studies have been carried out on the mafic rocks (Haller & Ramos, Reference Haller and Ramos1984; Kay et al. Reference Kay, Ramos and Kay1984; Boedo et al. Reference Boedo, Vujovich, Kay, Ariza and Pérez Luján2013; González-Menéndez et al. Reference González-Menéndez, Gallastegui, Cuesta, Heredia and Rubio-Ordóñez2013), many aspects still remain unknown such as precise age, tectonic setting of origin, mantle source composition and their implications on how this sector of the Precordillera has evolved.
Map of central-western Argentina showing the different terranes accreted to the western Gondwana margin during early Palaeozoic time and the Río de la Plata craton (modified from Ramos et al. Reference Ramos, Dallmeyer, Vujovich, Pankhurst and Rapela1998). Dashed pink lines represent terrane boundaries and the pink area represents the Argentine Precordillera fold-and-thrust belt. Location of the Precordillera mafic-ultramafic belt (PMUB) localities are divided into a northern and a southern sector.

Borrello (Reference Borrello1969) and Haller & Ramos (Reference Haller and Ramos1984) suggested that the belt belongs to an almost complete and dismembered ophiolite sequence. Based on whole-rock geochemistry, some studies have postulated an oceanic within-plate, plume-related environment, unevolved oceanic rift next to a continental margin and a retro-arc basin as possible geological settings for the Precordillera mafic–ultramafic belt (PMUB) (Cortelezzi et al. Reference Cortelezzi, Furque and Paulicevic1982; Kay et al. Reference Kay, Ramos and Kay1984; Cortés & Kay, Reference Cortés and Kay1994). Others argue that the gabbros and pillow basalts originated in an evolved continental rift margin with poor crustal contamination (González-Menéndez et al. Reference González-Menéndez, Gallastegui, Cuesta, Heredia and Rubio-Ordóñez2013). In this context, Boedo et al. (Reference Boedo, Vujovich, Kay, Ariza and Pérez Luján2013) proposed that the whole-rock geochemical imprint of the mafic rocks of the PMUB could be related to a Continental Margin Ophiolite, according to the classification of Dilek & Furnes (Reference Dilek and Furnes2011).
This work includes the geochemical study of mafic and ultramafic rocks exposed in the northern sector of the Western Argentine Precordillera belt (Rodeo, Alto del Colorado, Sierra del Tigre and Sierra de la Invernada localities; Figs 1, 2). New mineral analyses of pyroxene from the northern (Calingasta area) and southern (Peñasco, Pozos, Cerro Redondo and Cortaderas; Figs 1, 2) sectors are also included. In addition, we report neodymium (Nd)–strontium (Sr) isotope analyses of the same mafic and ultramafic rock samples, providing valuable information to discuss the source of the magmatism and its geotectonic origin. New geochemical analyses are integrated with previously published data of the PMUB. The integrated database is compared with hotspot-related mafic rocks from southern Laurentia to test for a similar Neoproterozoic – early Palaeozoic evolution of the western Gondwana margin.
Geological map of the Argentine Precordillera (modified from Baldis et al. Reference Baldis, Beresi, Bordonaro and Vaca1982). Black named squares show the location of the Precordillera mafic-ultramafic belt areas (see Fig. 1). Black squares with red border indicate U–Pb crystallization ages on zircon (Davis et al. Reference Davis, Roeske, McClelland and Kay2000; Fauqué & Villar, Reference Fauqué and Villar2003). Location of studied samples are also shown (Table 1).

2. Geological framework
2.a. The Western Argentine Precordillera
The basement of the Central Andean Cordillera and back-arc region (27–33.5° S) consists of different terranes that were accreted to the western Gondwana margin during the Palaeozoic Era (e.g. Ramos et al. Reference Ramos, Jordan, Allmendinger, Mpodozis, Kay, Cortés and Palma1986) (Fig. 1). In particular, the Argentine Precordillera of central-western Argentina is a Miocene fold-and-thrust belt, located at the front of the Andean Orogen, where lower Palaeozoic rocks belonging to the composite Cuyania terrane (Pie de Palo block + Precordillera) are exposed. Its basement is indirectly known by xenoliths hosted in Neogene volcanic rocks that yield U–Pb zircon ages of 1000–1100 Ma (Leveratto, Reference Leveratto1968; Kay et al. Reference Kay, Orrell and Abruzzi1996; Rapela et al. Reference Rapela, Pankhurst, Casquet, Baldo, Galindo, Fanning and Dahlquist2010).
The lower Palaeozoic stratigraphy of the Precordillera mainly consists of a Cambrian – Lower Ordovician carbonate platform to the east, and Middle–Upper Ordovician marine siliciclastic rocks intercalated with mafic and ultramafic bodies affected by a complex synmetamorphic deformation to the west. Lower Palaeozoic layers are overlain by Silurian–Devonian siliciclastic facies (Haller & Ramos, Reference Haller and Ramos1984; Astini et al. Reference Astini, Benedetto and Vaccari1995; Thomas & Astini, Reference Thomas and Astini2003).
The mafic and ultramafic studied bodies, referred to here as the western PMUB, include basaltic pillow lavas, gabbros, diorites and wehrlites that are intruded and/or tectonically juxtaposed in marine siliciclastic metasedimentary successions that occasionally host platform carbonate and siliciclastic olistoliths (Thomas & Astini, Reference Thomas and Astini2003). According to lithological aspects and metamorphic grade, the PMUB can be separated into two sectors (Fig. 1). The northern sector (28–32° S) comprises the Jagüé-Bonete (at La Rioja province), Rodeo, Alto del Colorado, Sierra de la Invernada, Sierra del Tigre, Calingasta and Leoncito areas (located in San Juan province). It comprises basalts and gabbros interbedded with thick siliciclastic successions of Sandbian–Katian–Hirnantian age grouped in the Yerba Loca, Sierra de la Invernada and Alcaparrosa formations (Furque, Reference Furque1983; Ortega et al. Reference Ortega, Albanesi, Banchig and Peralta2008). The siliciclastic sequence from the Sierra de la Invernada Formation has been interpreted as turbidites deposited in a storm-dominated shallow-marine shelf (Basilici et al. Reference Basilici, Cutolo, Gomes Borges, Henrique, Moretti, Pankhurst and Veiga2005; Gomes et al. Reference Gomes, Basilici, Cutolo, Henrique and Moretti2005; Moretti, Reference Moretti2009). The southern sector (32–33° S; Fig. 1) includes the Peñasco, Pozos, Cerro Redondo, Cortaderas and Bonilla localities (all located in Mendoza province). This sector is characterized by serpentinites, ultramafic cumulates, mafic granulites and orthogneisses that are not exposed in the north. Gabbros, basaltic dykes and/or sills, pillow basalts and metahyaloclastite bodies are also interbedded in marine siliciclastic successions (Davis et al. Reference Davis, Roeske, McClelland, Snee, Ramos and Keppie1999; Boedo et al. Reference Boedo, Vujovich, Kay, Ariza and Pérez Luján2013, Reference Boedo, Luján, Naipauer, Vujovich, Pimentel, Ariza and Barredo2020). Radiometric ages and palaeontological data suggest that sedimentation and basaltic magmatism in a marine basin occurred in this region during late Neoproterozoic – Early Devonian time (Davis et al. Reference Davis, Roeske, McClelland and Kay2000; Rubinstein & Steemans, Reference Rubinstein and Steemans2007; Boedo et al. Reference Boedo, Luján, Naipauer, Vujovich, Pimentel, Ariza and Barredo2020). This sector of the PMUB can be correlated with the Frontal Cordillera mafic–ultramafic belt, exposed S-wards in the Sierra de Guarguaraz, Argentine Frontal Cordillera (Fig. 1). There, serpentinites, metaperidotites, orthoamphibolites, metagabbros, metabasaltic dykes and pillow metabasalts are in contact with marble and schist (López & Gregori, Reference López and Gregori2004; López de Azarevich et al. Reference López de Azarevich, Escayola, Azarevich, Pimentel and Tassinari2009; Gargiulo et al. Reference Gargiulo, Bjerg and Mogessie2011). The Argentine Frontal Cordillera mafic bodies have an N-MORB to E-MORB chemical signature, and the whole sequence is strongly deformed and metamorphosed. Massonne & Calderón (Reference Massonne and Calderón2008) and Willner et al. (Reference Willner, Gerdes, Massonne, Schmidt, Sudo, Thomson and Vujovich2011) estimated a P-T-t clockwise metamorphic path in metapelites and metabasites, where high-pressure conditions were followed by decompression with slight heating.
The northern sector of the PMUB exhibits very-low- to low-temperature and pressure metamorphic conditions (0.2–0.3 GPa and 200–350°C; Rubinstein et al. Reference Rubinstein, Bevins, Robinson and Morrello1997; Robinson et al. Reference Robinson, Bevins and Rubinstein2005), whereas low- to medium-temperature and high-pressure conditions have affected the southern sector (0.7–0.9 GPa and 345–395°C; Boedo et al. Reference Boedo, Willner, Vujovich and Massonne2016). High-temperature and high-pressure conditions have been estimated for mafic granulites exposed in the Peñasco and Cortaderas areas (1.1–1.8 GPa and 650–910°C; Davis et al. Reference Davis, Roeske, McClelland, Snee, Ramos and Keppie1999; Boedo et al. Reference Boedo, Willner, Vujovich and Massonne2016). Dating of the low-grade metamorphic event registered in the PMUB and in the Frontal Cordillera belt generally yields a Middle–Late Devonian age (Cucchi, Reference Cucchi1971; Davis et al. Reference Davis, Roeske, McClelland, Snee, Ramos and Keppie1999; Willner et al. Reference Willner, Gerdes, Massonne, Schmidt, Sudo, Thomson and Vujovich2011).
Most interpretations agree that the Cuyania terrane rifted away from southern Laurentia (i.e. the Ouachita embayment) during early Cambrian time and drifted across the Iapetus Ocean until it collided against the Gondwana margin during the Late Ordovician Epoch (e.g. Ramos et al. Reference Ramos, Jordan, Allmendinger, Mpodozis, Kay, Cortés and Palma1986; Astini et al. Reference Astini, Benedetto and Vaccari1995; Thomas et al. Reference Thomas, Tucker, Astini and Denison2012). Alternative models consider a more oblique movement along the Gondwana margin that controlled the accretion of the Pie de Palo and Precordillera blocks (Finney, Reference Finney2007; Casquet et al. Reference Casquet, Pankhurst, Rapela, Galindo, Fanning, Chiaradia, Baldo, González-Casado and Dahlquist2008).
The PMUB has been interpreted as a dissected ophiolite (Haller & Ramos, Reference Haller and Ramos1984) exposed by the collision of the Chilenia terrane against the Gondwana margin (Ramos et al. Reference Ramos, Jordan, Allmendinger, Mpodozis, Kay, Cortés and Palma1986). Davis et al. (Reference Davis, Roeske, McClelland, Snee, Ramos and Keppie1999, Reference Davis, Roeske, McClelland and Kay2000) have shown that this belt comprises rocks from different tectonic settings such as mid-ocean-ridge and volcanic-arc environments.
2.b. Previous geochronological and geochemical studies of the PMUB
Although there are many studies of the geochemistry of the PMUB, ages of the mafic magmatism are poorly constrained. In the northern sector, some ages have been indirectly interpreted from basalts interbedded with metasedimentary rocks bearing fossil fauna of Sandbian–Hirnantian age (Ortega et al. Reference Ortega, Albanesi, Banchig and Peralta2008). A crystallization age of 454 ± 35 Ma (U–Pb on zircon) from basalts is available for the Jagüé–Bonete area (Fig. 2) (Fauqué & Villar, Reference Fauqué and Villar2003). In addition, estimations from a basic sill for the same locality provided a depleted mantle (DM) Nd model age (T DM) of 510 Ma (Martina et al. Reference Martina, Astini and Pimentel2014).
In the southern PMUB sector, Davis et al. (Reference Davis, Roeske, McClelland and Kay2000) obtained two crystallization ages of 576 ± 17 Ma and 418 ± 10 Ma (U–Pb on zircon) on basaltic rocks from the Cortaderas area (Fig. 2), suggesting that the magmatic activity developed from late Neoproterozoic time to the Silurian–Devonian boundary.
Whole-rock geochemistry from basalts and gabbros of the PMUB have an E-MORB signature (Haller & Ramos, Reference Haller and Ramos1984; Kay et al. Reference Kay, Ramos and Kay1984; Cortés & Kay, Reference Cortés and Kay1994; Boedo et al. Reference Boedo, Vujovich, Kay, Ariza and Pérez Luján2013; González-Menéndez et al. Reference González-Menéndez, Gallastegui, Cuesta, Heredia and Rubio-Ordóñez2013) and positive ϵ Nd values that suggest both an oceanic and/or a transitional affinity (extended continental margin) (Cortés & Kay, Reference Cortés and Kay1994; Kay et al. Reference Kay, Godoy and Kurtz2005).
3. Data and methods
This study presents new whole-rock, mineral chemical and Nd and Sr isotopic analyses for samples from different locations of the PMUB (Table 1). Representative mafic and ultramafic rock (basalts, gabbros, diorite and wehrlites) samples were collected in the Jagüé–Bonete, Rodeo, Sierra del Tigre, Sierra de la Invernada, Alto del Colorado, Calingasta Cerro Redondo, Peñasco, Pozos and Cortaderas areas (Figs 1, 2; Table 1). Each sample taken for analyses consisted of around 5 kg of unaltered material.
Summary table showing the dataset presented in this work, including analysed rock type, sample name, location, field relationship and study performed in each case

* Whole-rock major elements used for P-T estimations from Boedo et al. (Reference Boedo, Vujovich, Kay, Ariza and Pérez Luján2013)
A total of 17 mafic–ultramafic rock samples from the Rodeo, Alto del Colorado, Sierra del Tigre and Sierra de la Invernada areas (Fig. 1) were analysed for whole-rock major-element oxides (SiO2, TiO2, Al2O3, FeOt, MnO, MgO, CaO, Na2O, K2O and P2O5) and minor and trace elements (Li, Sc, V, Cr, Co, Ni, Cu, Zn, Ga, Rb, Sr, Y, Zr and Nb) (Table 2). The complete analytical procedure was performed in ALS Laboratory Group SL. It consisted of crushing, powder reduction and a lithium borate fusion of a minor fraction, prior to acid dissolution. Final dissolutions were analysed by X-ray fluorescence (XRF), major elements by inductively coupled plasma atomic emission spectroscopy (ICP-AES) and minor and trace elements by inductively coupled plasma mass spectrometry (ICP-MS).
Whole-rock major-element (wt %) calculated anhydrous and trace-element(ppm) analyses of basalts, gabbros, diorite and wehrlite from the Rodeo, Alto del Colorado, Sierra del Tigre and Sierra de la Invernada areas (Figs 1, 2; Table 1)

Primary texture: aporphyritic-intersertal; bhipidiomorphic inequigranular subophitic; chipidiomorphic inequigranular ophitic; dhipidiomorphic equigranular; ehipidiomorphic equigranular ophitic–subophitic; fhipidiomorphic inequigranular poikilitic.
In addition, mineral chemical analyses were performed on a total of 275 points (229 in clinopyroxene, 42 in plagioclase and 4 in ilmenite crystals) on 18 representative mafic samples (diorite, leuco-gabbronorite, microgabbros and gabbros) from the Sierra de la Invernada, Alto del Colorado, Sierra del Tigre, Calingasta and Peñasco areas (Figs 1, 2; online Supplementary Tables S1–S3, available at http://journals.cambridge.org/geo). The major-element composition of each mineral phase analysed was obtained using a JEOL JXA-8230 electron probe micro-analyser (EPMA) in the Laboratorio de Microscopía Electrónica y Análisis de Rayos X (LAMARX) of the Universidad Nacional de Córdoba (Argentina). Operating conditions involved a constant voltage intensity of 15 kV, a beam current of 20 nA and a beam diameter of 1–5 μm. For mineral phases, qualitative determinations were obtained using energy-dispersive spectrometers (EDS), and quantitative determinations were acquired by wavelength-dispersive spectrometers (WDS). In the last case, a combination of natural silicates and oxides were used for calibration: wollastonite (Si and Ca); anorthite (Si); anorthoclase (Na); orthoclase (Si, Al, K); sodalite (Cl); celestine (Sr); rutile (Ti); rhodonite (Mn); topaz (F), apatite (F, P and Ca); diopside (Mg, Si and Ca); chromite (Mg, Cr and Al); ilmenite (Ti and Fe2+); hematite (Fe); vanadinite (V); nickeline (Ni); fayalite (Si and Fe2+); forsterite (Si and Mg); and hornblende (Mg, Al, Si, Ti and Ca). Other used standard oxides included MgO (Mg) and ZnO (Zn).
Whole-rock Nd and Sr isotopic analyses were performed on 28 mafic rock samples from the Jagüé–Bonete, Rodeo, Sierra del Tigre, Sierra de la Invernada, Calingasta, Cerro Redondo, Peñasco, Pozos and Cortaderas areas (Figs 1, 2; Table 3). From this dataset, 15 samples were analysed at the Laboratório de Geoquímica Isotópica e Geocronologia of the Universidade de Brasília (Brazil) following the method described by Gioia & Pimentel (Reference Gioia and Pimentel2000). For the remaining 13 samples, 87Sr/86Sr and 143Nd/144Nd ratios were obtained in the Keck Isotope Laboratory at Cornell University (USA) by thermal ionization mass spectrometry (TIMS) on a VG Sector 54 system. All errors in measured samples and standards are 2σ. The constant decay of 147Sm is 6.54 × 10⁻¹² a–1 (Lugmair & Marti, Reference Lugmair and Marti1978). ϵ Sr and ϵ Nd values were calculated using the chondritic uniform reservoir (CHUR) parameters of 87Sr/86Sr = 0.7045 and 143Nd/144Nd = 0.512638 (DePaolo & Wasserburg, Reference DePaolo and Wasserburg1976). ϵ Nd,i and (87Sr/86Sr)i contents were calculated at 418, 454 and 576 Ma. The criteria followed were based on two features: (1) maximum depositional ages and palynological and/or conodont-graptolite biostratigraphy; and (2) field observations and the proximity between the mafic intrusions studied in the Pozos and Cortaderas areas, and basalts with crystallization age of 418 Ma and 576 Ma (U–Pb on zircons) reported by Davis et al. (Reference Davis, Roeske, McClelland and Kay2000). In (1), the crystallization age of 454 Ma estimated by Fauqué & Villar (Reference Fauqué and Villar2003) is consistent with siliciclastic successions of Sandbian–Katian–Hirnantian fossil fauna hosted in the Yerba Loca, Sierra de la Invernada and Alcaparrosa formations from the northern PMUB (Furque, Reference Furque1983; Ortega et al. Reference Ortega, Albanesi, Banchig and Peralta2008); and the crystallization age of 418 Ma assumed for samples from Cerro Redondo and Peñasco areas is based on flora findings reported by Cortés (Reference Cortés1992) and estimated in basalts (U–Pb on zircons) by Davis et al. (Reference Davis, Roeske, McClelland and Kay2000).
Nd and Sr isotope data of mafic rocks from different localities of the PMUB (Figs 1, 2; Table 1). ϵ Nd(i) values are calculated using crystallization ages obtained in basalts (U–Pb on zircon) from the Jagüé-Bonete and Cortaderas areas (Davis et al. Reference Davis, Roeske, McClelland and Kay2000; Fauqué & Villar, Reference Fauqué and Villar2003)

a Crystallization ages of 576 ± 17 Ma and 418 ± 10 Ma (U–Pb on zircon) obtained by Davis et al. (Reference Davis, Roeske, McClelland and Kay2000)
When the crystallization age is unknown, the Nd model age represents the time at which the isotopic composition of the sample was identical to that of a certain model reservoir (CHUR or depleted mantle; DePaolo, Reference DePaolo1988). In our study, depleted mantle Nd model ages were obtained using a single-stage model and 143Nd/144Nd = 0.51313 and 147Sm/144Nd = 0.24835 ratios (Workman & Hart, Reference Workman and Hart2005). Nevertheless, care must be taken when using trace-element concentrations estimated by ICP-MS. The analytical uncertainty on this technique can lead to up to 10% error, and is propagated when determining the isotopic 147Sm/144Nd ratio (Lin et al. Reference Lin, Liu, Yang and Hu2016). Calculated model ages can therefore be lower or higher than expected.
In order to better characterize the entire extension of the PMUB, we compiled a dataset of 80 published whole-rock geochemical analyses of mafic and ultramafic rocks from the northern and southern sectors of this belt. The combination of already published and new geochemical data presented in this work constitute a more robust database, representative of the 400-km-long PMUB, allowing us to correlate and compare different localities throughout it.
4. Results
4.a. Petrography
Mafic and ultramafic rocks studied in this contribution consist of N-trending sills, lenses, dykes or lava flows with widths dependent on the type of intrusion and its structure. These bodies are interlayered with siliciclastic rocks (Fig. 3a) that show thin (< 5 cm) dark chilled margins, or are in tectonic contact with greenish shale and metapelites (Fig. 3b) from the Yerba Loca, Alcaparrosa and Sierra de la Invernada formations.
Field relationship between igneous and metasedimentary rocks. (a) Yerba Loca Formation at the Sierra del Tigre area. Diorite and wehrlite sills interlayered with metagraywacke. (b) Yerba Loca Formation at the Sierra del Tigre area. Thick gabbro sill in tectonic contact with metapelitic layers. (c) Yerba Loca Formation at the Rodeo area. Basaltic lava flows (view from the top-side) with pillow-shaped structure. (d) Yerba Loca Formation at the Rodeo area. Thick basaltic flow with columnar-jointing. (e) Detail of the columnar-shaped jointing shown in (d). (f) Yerba Loca Formation at the Rodeo area. Sulphide-bearing metapelite layers. (g) Detailed view of sulphide-bearing metapelite. Sulphide layers consist of euhedral Py ± Ccp ± Po (mineral abbreviations after Whitney & Evans, Reference Whitney and Evans2010). (h) Sierra de la Invernada Formation at the homonymous area. Gabbro sill dissected by quartz-feldspathic vein. The yellow dashed lines in (a, b, d, f) separate mafic from metasedimentary units. The yellow dotted line in (h) separates a quartz-feldspathic vein corresponding to a gabbroic sill. See location areas in Figures 1 and 2.

Mafic dykes and basaltic lava flows are the major bodies in the Rodeo, Alto del Colorado and Calingasta areas (Fig. 2). They exhibit columnar jointing and a pillow-shaped structure (Fig. 3c–e) with thicknesses ranging over 3–20 m. Volcanic textures are microgranular to porphyritic with a microcrystalline or partly glassy matrix containing a few phenocrysts of plagioclase and clinopyroxene. These mafic flows are interbedded with sulphide-bearing metapelites, with parageneses consisting of disseminated or thin massive layers (< 4 mm) of euhedral Py ± Ccp ± Po (mineral abbreviations after Whitney & Evans, Reference Whitney and Evans2010) (Fig. 3f, g). Similar sulphide concentrations comprising Py, Ccp, Gn, Sp, Ttr, Mrc, Apy, Au and Mol have been found in the Calingasta area by Brodtkorb et al. (Reference Brodtkorb, Herrmann, Pezzutti, Leal, González and Meissl2015). In basaltic lava flows from the Rodeo and Calingasta areas, spaces between the individual pillows and their vesicles are filled with chert and calcium carbonate.
Mafic and ultramafic sills and lenses are the dominant intrusions in the Sierra del Tigre and Sierra de la Invernada areas (Fig. 2). They consist of massive layers with granular texture, of thicknesses 10–150 m, and exhibit onion-skinned weathering depending on grain size, which varies over 2–10 mm. Mafic sills studied in the Sierra de la Invernada area consist of dark-green fine- to coarse-grained gabbros with cross-cutting veins of quartz-feldspathic composition (Fig. 3h). It is worth noting that thicker bodies display magmatic layering of thickness from a few centimetres up to 2 m, alternating pyroxene- and plagioclase-rich bands, with variably modal crystal concentrations. The Sierra del Tigre mafic rocks (Fig. 2) exhibit a wider textural and compositional range. Basaltic lava flows exposed at the western flank of the range exhibit massive and pillow structure, whereas the eastern flank of the range is dominated by massive diorite (Fig. 4a, b), dark-green fine-grained gabbros, coarse-grained gabbros (Fig. 4c, d) and wehrlite lenses (Fig. 4e, f) interbedded with metasandstone and metagreywacke.
(a) Fine- to medium-grained diorite hand specimen showing dark-green acicular hornblende and tabular plagioclase crystals. (b) Cross-polarized light photomicrograph showing the diorite of (a). Subidiomorphic fine-grained texture consists of partially altered plagioclase, potassium feldspar, clinopyroxene and hornblende crystals. (c) Greenish coarse-grained gabbro hand specimen. (d) Cross-polarized light photomicrograph of the gabbro shown in (c), which shows subidiomorphic ophitic–subophitic texture. (e) Coarse-grained wehrlite outcrop showing onion-skinned weathering. (f) Cross-polarized light photomicrograph of the wehrlite shown in (e) exhibiting coarse-grained texture with partially serpentinized olivine and clinopyroxene crystals. Mineral abbreviations after Whitney & Evans (Reference Whitney and Evans2010).

Thin-section analyses in mafic and ultramafic rocks from the Sierra de la Invernada and Sierra del Tigre areas show a primary mineral association characterized by idiomorphic to hypidiomorphic 2–10-mm-long crystals with fine- to medium-grained (Fig. 4b), ophitic to subophitic (Fig. 4d) and, in some cases, poikilitic texture. Gabbros exhibit augite oikocrysts enclosing smaller crystals of Ca-rich plagioclase (Fig. 4d). Poikilitic texture suggests that plagioclase grew simultaneously or slightly earlier than clinopyroxene. Recognized skeletal texture supports the simultaneous growing of both minerals. Primary modal composition in these mafic rocks consists of clinopyroxene (Aug) varying over 4–48%, Ca-rich plagioclase (An66–86) of up to 58%, accessory minerals (Mag ± Ttn ± Ilm) of up to 13%, quartz of up to 10%, olivine of up to 17%, hornblende of up 6% and biotite of up to 5%.
Two partially serpentinized wehrlite sills exposed in Rodeo and Sierra del Tigre (Figs 1, 2) consist of euhedral to subhedral olivine relics (in a modal concentration of c. 70%), replaced by serpentine-group minerals and clinopyroxene (sample ST55 in Fig. 4f).
Mafic intrusions show partial pervasive alteration of the primary mineral assemblage mentioned above. Plagioclase is variably saussuritized to epidote, albite, calcite, white mica (sericite) and clay minerals. Clinopyroxene is mainly fresh but sometimes presents embayed texture due to the replacement of minerals with a groundmass of secondary mineral assemblage. Many gabbros exhibit uralitized (Act + Chl) clinopyroxene rims. Olivine is mostly present as relict crystals with an almost complete alteration to serpentine-group minerals.
All recognized textures are magmatic with no sub-solidus deformation patterns identified. The secondary mineral assemblage mentioned above indicates a prehnite-pumpellyite to greenschist facies metamorphism and is consistent with previous observations in the Rodeo, Calingasta and Sierra del Tigre areas (Rubinstein et al. Reference Rubinstein, Bevins, Robinson and Morrello1997; Robinson et al. Reference Robinson, Bevins and Rubinstein2005; González-Menéndez et al. Reference González-Menéndez, Gallastegui, Cuesta, Heredia and Rubio-Ordóñez2013).
4.b. Mineral chemistry
4.b.1. Clinopyroxene
Clinopyroxene composition yields Ti2O and Al2O3 contents in the ranges 0.12–1.74 wt% and 0.4–4.5 wt%, respectively. Magnesium no. (= 100×Mg/(Mg + Fe)) is 16–74 and correlates positively with the Al2O3 content. Wollastonite (Wo), Enstatite (En) and Ferrosillite (Fs) contents are 29–45.5, 15.3–49.7 and 10–46.2, respectively (online supplementary Table S1). An evolution towards the Fs end-member in gabbro crystals can be recognized (Fig. 5). Analysed clinopyroxene crystals are augite, whereas only one measurement corresponds to a diopside composition with Wo > 45 (sample KMES3 from Calingasta area).
Pyroxene classification diagram (Morimoto, Reference Morimoto1988). Most analysed clinopyroxene crystals are augite, whereas only one measurement corresponds to a diopside composition with Wo > 45 (sample KMES3 from Calingasta area).

Most of the analysed clinopyroxenes are chemically homogeneous. Nevertheless, a few crystals exhibit a continuous magmatic zoning with a decrease in Al2O3 and CaO contents and an increase in FeO, Na2O and Ti2O contents from core to rims (sample QM208px02 in Fig. 6a–d). This zoning pattern is expected in crystals that follow the crystallization sequence of Ol + Pl + Cpx in basaltic magmas (Beccaluva et al. Reference Beccaluva, Macciotta, Piccardo and Zeda1989). However, most of the zoned crystals exhibit a heterogeneous zoning with FeO, CaO and MgO contents varying throughout fractures and cleavage planes, suggesting post-magmatic hydrothermal alteration (sample QEA10px01, shown in Fig. 6e–h).
Electron microprobe major-element mapping on pyroxene crystals of (a–d) sample QM208px02 from the Peñasco area and (e–h) sample QEA10 from the Sierra de la Invernada area. (a) Al distribution map. The black line indicates spot analysis along transverse a(rim) – g(core) – l(rim), as detailed in online supplementary Table S1. (b) Ca distribution map. (c) Fe distribution map. (d) Mg distribution map. The crystal (a–d) shows homogeneous magmatic zoning. (e) Backscattered electron image of pyroxene ‘px1’ of sample QEA10. The white line indicates spot analyses along transverse: a(rim) – i(core) – p(rim), as detailed in online supplementary Table S1. (f) Ca distribution map. (g) Fe distribution map. (h) Mg distribution map. Notice the heterogeneous zoning observed throughout fractures and cleavage surfaces (e–h).

The majority of analysed points plot in the subalkaline ocean-floor basalts field and show a tholeiitic affinity (Fig. 7a, b). Some crystals from the Calingasta and Sierra de la Invernada locations lie in the alkaline field. Most of the analysed crystals exhibit an N-MORB to transitional and E-MORB affinity, suggested by a shift towards the TiO2–Na2O boundary (Fig. 7c).
(a) SiO2 versus Al2O3 pyroxene diagram. Fields in dashed black lines are from Le Bas (Reference Le Bas1962). Analysed samples lie in the subalkaline ocean floor basalts field. (b) Ti versus Ca + Na discrimination diagram (Leterrier et al. Reference Leterrier, Maury, Thonon, Girard and Marchal1982). Most of the data plot in the tholeiitic and calcalkali basalts field. (c) (TiO2–Na2O–SiO2)/100 discrimination diagram (Beccaluva et al. Reference Beccaluva, Macciotta, Piccardo and Zeda1989). The majority of the analysed crystals lie between the N-MORB to transitional and E-MORB fields. E-MORB – enriched mid-ocean-ridge basalt; N-MORB – normal mid-ocean-ridge basalt; WOPB – within-oceanic-plate basalt; IB – Iceland basalt; IAT – island-arc tholeiite; BON – bonninite; BA-A – basaltic andesite and andesite.

4.b.2. Plagioclase
Analysed crystals from samples collected in the northern region provide evidence of two groups of different composition (online Supplementary Table S2). One group is represented by heterogeneous normally zoned crystals with cores richer in anorthite than rims. These crystals present thin albitized rims and their nuclei are mostly altered to saussurite. Anorthite content is in the range of 34–85.6 from rim to core (e.g. Pl2 in sample G3, and Pl5 in sample BAYO1). In contrast, the other group comprises chemically homogeneous plagioclases, with anorthite content varying over 60.4–66.1 from rim to core (e.g. Pl1 in sample G3 and Pl4 in sample BAYO1).
4.b.3. Accessory minerals
Accessory minerals comprise ilmenite and titanite coexisting with hematite and magnetite. Ilmenite and titanite occur mostly as exsolved phases in clinopyroxene crystals or as individual subhedral grains in the matrix. A micro-intergrowth between ilmenite and titanite is recognized as ilmenite lamellae along the {111} planes of the titanite host, resulting in a Trellis texture. Ti2O content of ilmenite is in the range of 47–51 wt%, whereas FeO ranges over 45–47 wt% and MnO over 1.9–2.9 wt%. Al2O3, MgO and CaO contents are lower than 0.3 wt% (online Supplementary Table S3).
Other minor accessory phases observed in gabbros and diorite comprise euhedral to subhedral magnetite, zircon, baddeleyite and ulvöspinel.
4.c. Whole-rock geochemistry
4.c.1. Major elements
The studied mafic–ultramafic rocks from the Rodeo, Alto del Colorado, Sierra del Tigre and Sierra de la Invernada localities display highly variable loss on ignition (LOI) values (1.2–9.2 wt%), indicative of low-grade metamorphism and/or hydrothermal alteration. The highest value displayed in the wehrlite sample ST55 can be attributed to serpentinization (Fig. 4f). Major oxides present in a wide compositional range are SiO2 (44.2–53.4 wt%), Al2O3 (6.6–17.4 wt%), MgO (3.7–28.7 wt%) and CaO (5.4–12.6 wt%) (Table 2). Fe2O3(tot) concentration is high (10.8–17.1 wt%), whereas TiO2 is relatively high (0.8–3 wt%) and K2O content is variable (0.1–1.2 wt%).
Major-element data presented on Harker-type bivariate plots (Fig. 8) exhibit partially scattered patterns, but some trends such as increasing SiO2, Na2O+K2O, Ti2O and P2O5 for decreasing Mg no. (100×MgO/(MgO+FeOt) calculated on a molar basis), can be recognized. CaO, Fe2O3(tot) and MnO concentrations display the most scattered distribution with increasing Mg no. (Fig. 8). The distribution trend in some major oxides (TiO2, Fe2O3, CaO) can be attributed to variable fractionation and/or crystallization of minerals such as pyroxene, ilmenite, magnetite and titanite.
Whole-rock major-element variations (wt%) versus Mg no. (=100 ×€MgO/(MgO+FeOt) calculated on a molar basis) for mafic and ultramafic samples from the Rodeo, Alto del Colorado (Al. Col.), Sierra del Tigre and Sierra de la Invernada areas (see details in Table 2 and locations in Figs 1 and 2). Note the negative correlations of SiO2, Na2O+K2O, Ti2O, and P2O5, and the positive correlation of Cr and Ni versus Mg no.

4.c.2. Trace elements
Ni content varies over 8–1470 ppm (with the highest value in wehrlite ST55) and has a good increasing correlation with Mg no. (Fig. 8), according to the degree of differentiation. In particular, samples with modal olivine show a positive correlation of Mg no. with compatible elements (Cr and Ni). This trend indicates fractionation and/or accumulation of olivine.
Low-grade metamorphism and/or hydrothermal alteration may lead to selective element mobility. The highest value displayed in the wehrlite sample ST55 can be attributed to serpentinization (Fig. 4f). We therefore consider mainly high-field-strength elements (HFSEs) and REEs for petrogenetic interpretation and diagram discrimination since they are relatively immobile under conditions of alteration processes (e.g. Pearce, Reference Pearce2008).
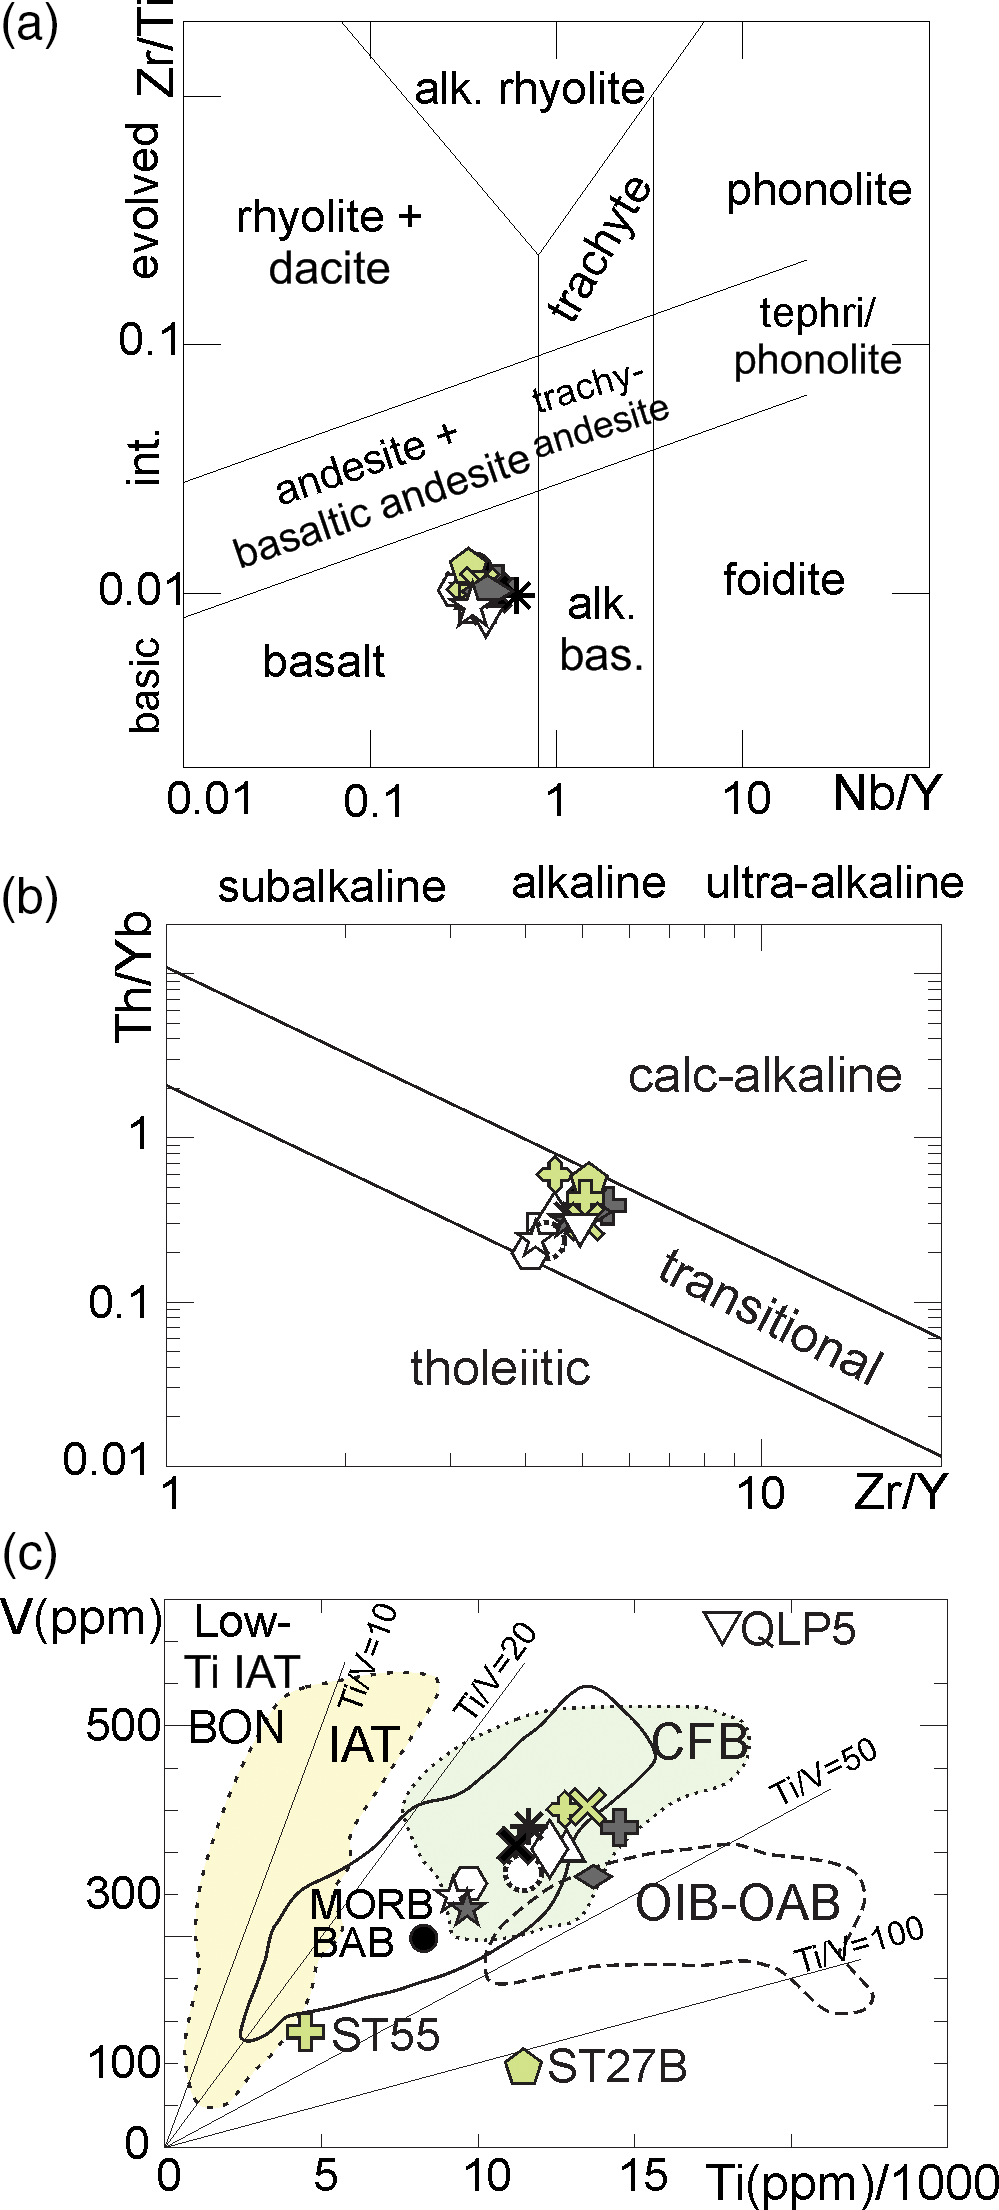
All the studied mafic rocks are subalkaline basalts according to the Zr/Ti versus Nb/Y diagram (Winchester & Floyd, Reference Winchester and Floyd1977; Fig. 9a). The studied samples show a well-defined transitional affinity (Fig. 9b), in agreement with previous studies performed in other sectors of the PMUB (e.g. Kay et al. Reference Kay, Ramos and Kay1984; Boedo et al. Reference Boedo, Vujovich, Kay, Ariza and Pérez Luján2013; González-Menéndez et al. Reference González-Menéndez, Gallastegui, Cuesta, Heredia and Rubio-Ordóñez2013). In the V-Ti discrimination diagram (Shervais, Reference Shervais1982), the majority of the samples plot in the CFB and MORB/back-arc basalt (BAB) fields (Fig. 9c). The variable V/Ti ratios of samples ST55, ST27B and QLP5 could have been controlled by magnetite fractionation throughout their evolution (Woodhead et al. Reference Woodhead, Eggins and Gamble1993).
(a) Zr/Ti versus Nb/Y discrimination diagram (Winchester & Floyd, Reference Winchester and Floyd1977). Studied samples lie in the basic-subalkaline-basaltic field. (b) Th/Yb versus Zr/Y discrimination diagram (Ross & Bédard, Reference Ross and Bédard2009). Studied mafic rocks show a clear transitional signature. Some of them lie close to the tholeiitic field. (c) V–Ti diagram (after Shervais, Reference Shervais1982). Analysed samples (except ST55, ST27B and QLP5) plot in the continental flood basalts (CFB) and mid-ocean-ridge/back-arc-basin basalts (MORB-BAB) fields. BON – bonninite; IAT – island-arc tholeiitic basalts; OIB – oceanic-island basalts; OAB – oceanic-alkaline basalts. Legend as in Figure 8.
The trace-element composition of the analysed mafic–ultramafic rocks is characterized by: (1) a moderate LILE/HFSE ratio; and (2) LREE-enriched patterns with La/Sm ratios in the range 1.8–2.4 and Sm/Yb of 1.4–2.2 (Fig. 10a, b). The primordial mantle-normalized spider diagram indicates a scattered LILE distribution indicated by positive Cs anomaly, positive Ba anomaly, and low Rb, K and Sr content. Nevertheless, the gabbroic sample D1 exhibits higher Rb, K and Sr content. Moderately negative Th and P anomalies are also observed (Fig. 10a). Note that, with the exception of the wehrlite sample ST55, no negative Nb–Ta anomalies are observed.
(a) Primordial mantle-normalized (Sun & McDonough, Reference Sun and McDonough1989) incompatible trace-element patterns for the analysed mafic–ultramafic samples. The scattered distribution in Cs, Rb, Ba and K element concentrations is probably due to secondary alteration processes. (b) Chondrite-normalized (Sun & McDonough, Reference Sun and McDonough1989) REE patterns. REE contents in analysed rock samples are 10–35 higher than chondrite values. See Figures 1 and 2 for sample location.
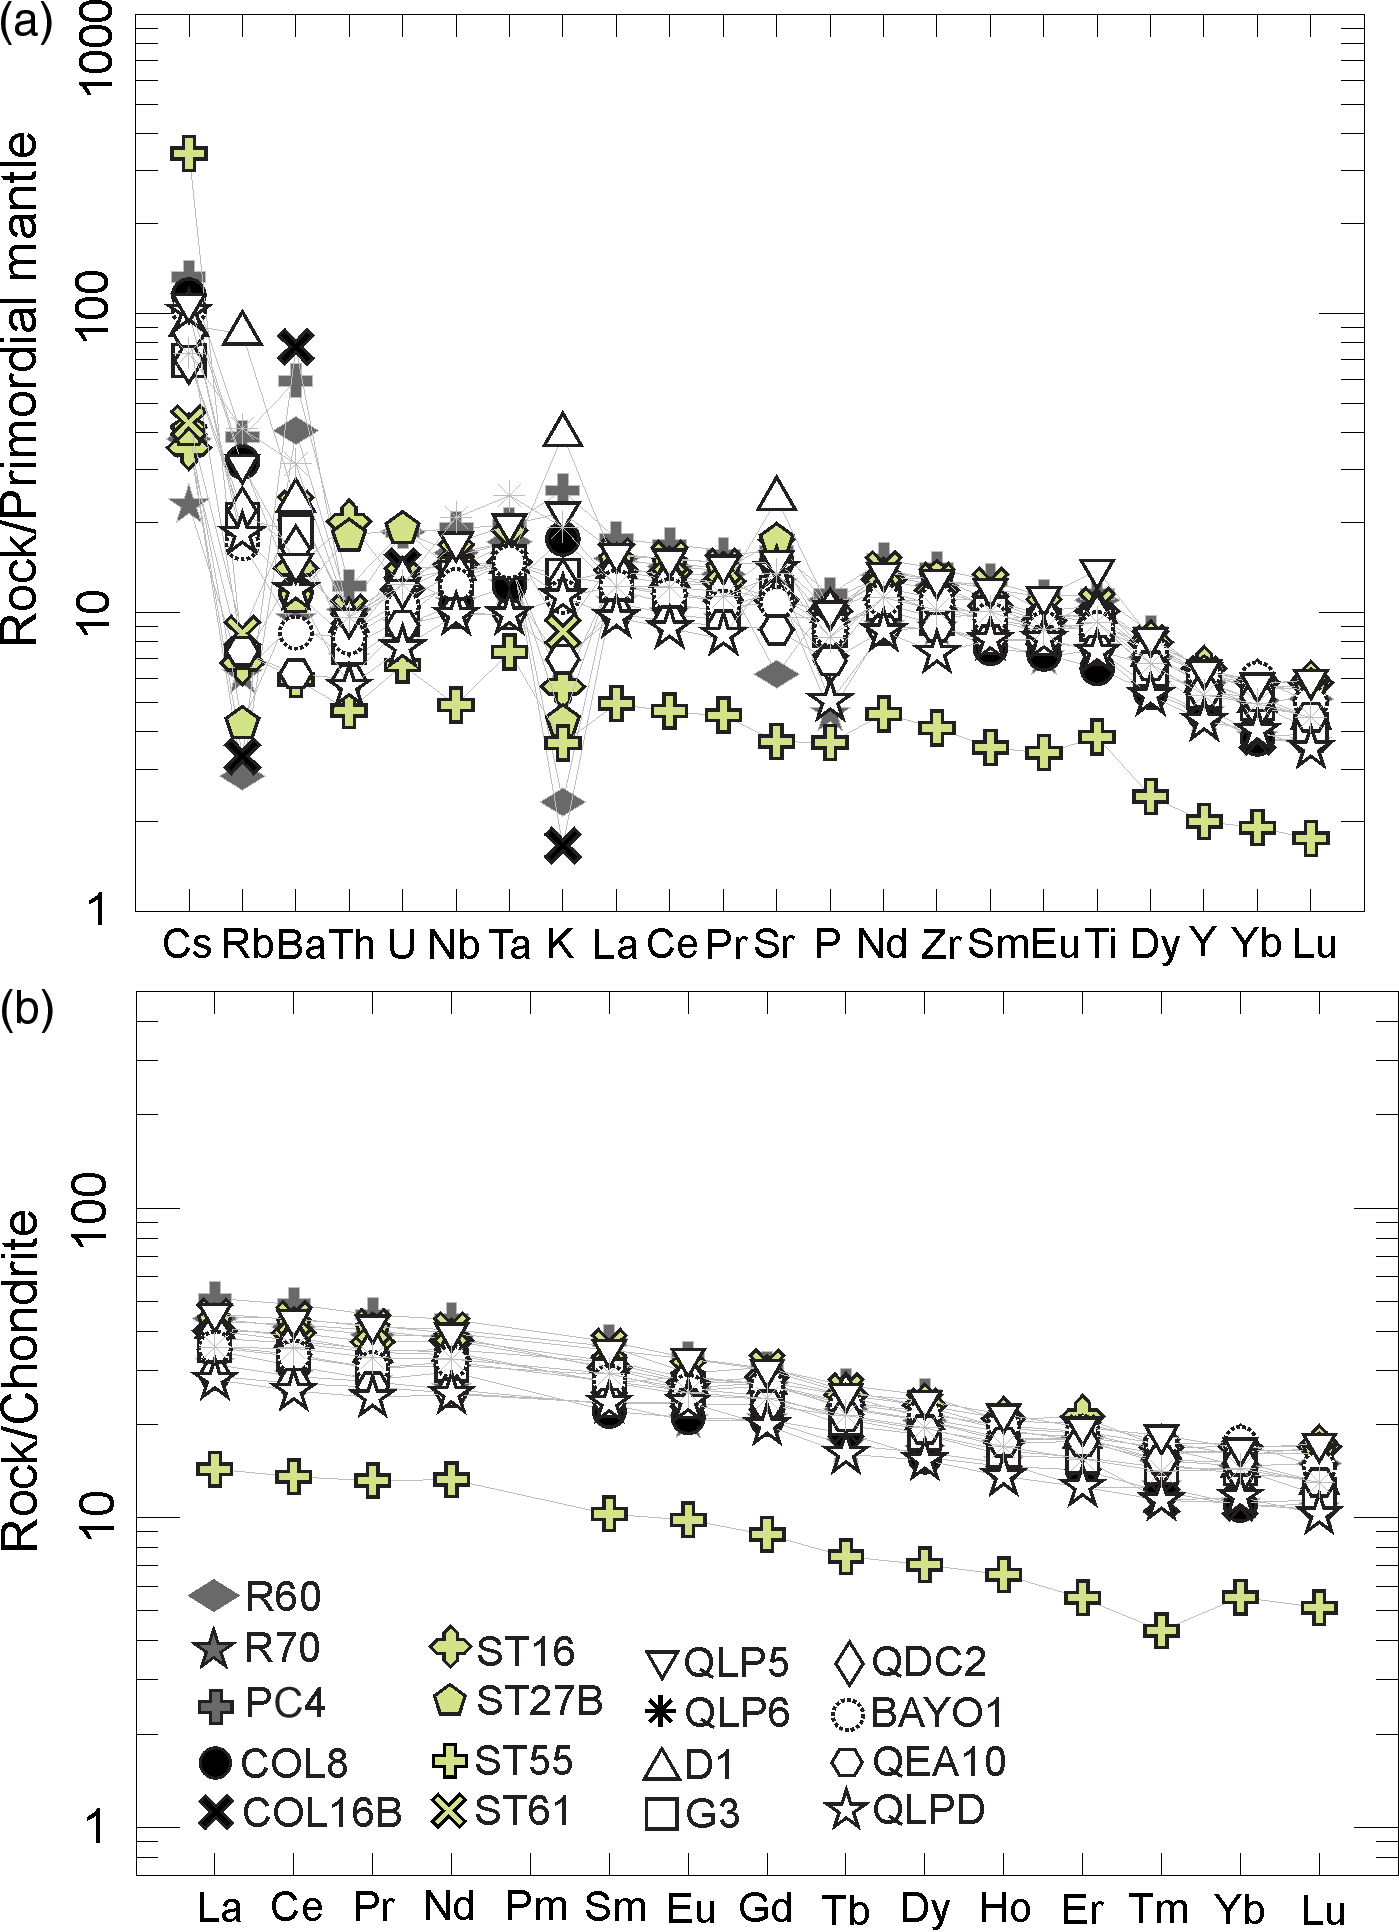
Chondrite-normalized REE patterns are 10–70 times higher than chondrite values (except for the wehrlite sample ST55) (Fig. 10b). The moderate LREE/HREE ratio with (La/Yb)N ranging over 1.9–3.4 indicates that garnet was not crystallized and was not an important residual source mineral in a shallow depth magma chamber (Green & Ringwood, Reference Green and Ringwood1967). Slightly positive Eu anomalies (Eu/Eu* = 0.88–1.09, where Eu* = √(SmN × GdN)) indicate scarce or no plagioclase fractionation.
4.d. Nd and Sr isotope composition
The ϵ Nd(418) values range between +3.4 and +7.2, ϵ Nd(454) between +4.4 and +8.4, and ϵ Nd(576) between +4.6 and +6.5 (Table 3). Overall, Nd isotope compositions are lower than those expected for MORB isotopic signatures with ϵ Nd c. 10 (DePaolo, Reference DePaolo1988). 87Sr/86Sr ratios have values ranging over 0.7030–0.7143, with the lowest value in gabbro ST61 and the highest value in basalt QM 2C-10 (Table 3). The large dispersion observed at relative constant ϵ Nd values can be explained by Rb addition and Sr loss, likely due to post-emplacement alteration or hydrothermal alteration by means of seawater addition (McCulloch et al. Reference McCulloch, Gregory, Wasserburg and Taylor1980). The sample suite defines an array starting at the mantle array with a shift to a more radiogenic (87Sr/86Sr)i ratio as ϵ Nd,i slightly decreases (except for sample QEA10) (Fig. 11). In particular, a group of samples from the Sierra del Tigre, Sierra de la Invernada and Cortaderas areas lie in the ocean island basalts (OIB) field between the depleted mantle (DM) and bulk silicate earth (BSE) end-members, and overlap the HIMU (high μ; μ = 238U/204Pb) and PREMA (PREvalent MAntle) mantle reservoirs fields (Zindler & Hart, Reference Zindler and Hart1986). Nd isotope compositions in the range of overall analysed samples are comparable with those estimated for primitive continental flood basalts (Fig. 11). Despite the large range in (87Sr/86Sr)i ratios, the uniform ϵ Nd,i for the analysed samples indicates a derivation from a common mantle source and clearly demonstrate an oceanic affinity. However, the Nd and Sr isotopic data cannot by themselves be used to precisely discriminate among different tectonic settings.
Initial Nd and Sr isotopic composition diagram. ϵ Nd,i and (87Sr/86Sr)i are calculated at 418, 454 and 576 Ma according to crystallization ages obtained in basalts (U–Pb on zircon) from the Jagüé-Bonete and Cortaderas areas (Fauqué & Villar, Reference Fauqué and Villar2003; Davis et al. Reference Davis, Roeske, McClelland and Kay2000). End-member mantle components after Zindler & Hart (Reference Zindler and Hart1986) are also shown. DM – depleted mantle; MORB – mid-ocean-ridge basalt; OIB – oceanic-island basalt; PREMA – prevalent mantle; HIMU – high-μ (μ = 238U/204Pb) mantle; BSE – bulk silicate earth; EMI – enriched mantle. Primitive continental flood basalt field from Condie (Reference Condie2001).

Nd T DM ages estimated in the studied mafic rocks of the PMUB range over 1592–367 Ma (Table 3). From the overall analysed samples, only two (ST55 from the northern and QP26–15 from the southern sector), exhibit Mesoproterozoic T DM ages of 1592 and 1327 Ma, respectively. A minor group of samples shows Neoproterozoic ages (750–611 Ma), whereas another group lies within the Precambrian–Cambrian boundary (560–544 Ma). The majority of the estimated T DM ages are in the range of 490–367 Ma, representing the late Cambrian – Late Devonian interval.
5. Integration of obtained results and previous studies of the PMUB
5.a. Trace-element analysis and tectonic discrimination
Whole-rock geochemical analyses presented in this contribution are interpreted in the framework of available already published geochemical data at different locations of the PMUB: Jagüé–Bonete (Kay et al. Reference Kay, Ramos and Kay1984; Fauqué & Villar, Reference Fauqué and Villar2003), Rodeo (Kay et al. Reference Kay, Ramos and Kay1984), Sierra del Tigre (Kay et al. Reference Kay, Ramos and Kay1984; González-Menéndez et al. Reference González-Menéndez, Gallastegui, Cuesta, Heredia and Rubio-Ordóñez2013), Calingasta (Kay et al. Reference Kay, Ramos and Kay1984; Boedo et al. Reference Boedo, Vujovich, Kay, Ariza and Pérez Luján2013), Peñasco (Boedo et al. Reference Boedo, Vujovich, Kay, Ariza and Pérez Luján2013), Cerro Redondo (Cortés & Kay, Reference Cortés and Kay1994; Cortés et al. Reference Cortés, González Bonorino, Koukharsky, Brodtkorb and Pereyra1999), and Cortaderas and Bonilla (Boedo et al. Reference Boedo, Vujovich, Kay, Ariza and Pérez Luján2013; Gregori et al. Reference Gregori, Martínez and Benedini2013). Combining all of the geochemical data from different localities within the PMUB in a single dataset allows us to understand the magmatic and tectonic setting related to the origin of the mafic rocks.
Mafic rocks from the northern sector of the PMUB (Fig. 12a) are characterized by a low to moderate LREE slope with a (La/Sm)N ratio ranging over 1.1–2.5, and a low to moderate HREE slope with a (Sm/Yb)N ratio ranging over 1.1–3.2. The LREE fractionation trends in samples from the Rodeo and Sierra del Tigre areas are broadly parallel to that of CFBs, with a few samples more or less enriched in LREE elements. In addition, they are more fractionated in comparison with the E-MORB trend, except for HREE in most of the samples. Ultramafic rocks (wehrlite) from the Rodeo and Sierra del Tigre locations present the lowest REE concentrations in comparison to those corresponding to OIB, CFB, E-MORB and N-MORB.
(a) Chondrite-normalized (Sun & McDonough, Reference Sun and McDonough1989) REE patterns from the northern area of the PMUB (La Rioja, Rodeo, Alto del Colorado, Sierra del Tigre, Sierra de la Invernada and Calingasta). Also shown are REE data from Kay et al. (Reference Kay, Ramos and Kay1984), Fauqué & Villar (Reference Fauqué and Villar2003), Boedo et al. (Reference Boedo, Vujovich, Kay, Ariza and Pérez Luján2013) and González-Menéndez et al. (Reference González-Menéndez, Gallastegui, Cuesta, Heredia and Rubio-Ordóñez2013). (b) Chondrite-normalized (Sun & McDonough, Reference Sun and McDonough1989) REE patterns for samples from the southern PMUB (Cerro Redondo, Peñasco, Cortaderas and Bonilla). Additional REE data are from Cortés & Kay (Reference Cortés and Kay1994); Cortés et al. (Reference Cortés, González Bonorino, Koukharsky, Brodtkorb and Pereyra1999); Boedo et al. (Reference Boedo, Vujovich, Kay, Ariza and Pérez Luján2013); Gregori et al. (Reference Gregori, Martínez and Benedini2013). Ocean island basalts (OIB), continental flood basalts (CFB), E-MORB and N-MORB data (Thompson et al. Reference Thompson, Morrison, Dickin, Hendry, Hawkesworth and Norry1983; Sun & McDonough, Reference Sun and McDonough1989) also plotted for comparison.

The mafic rocks of the southern sector of the PMUB exhibit a relatively flat HREE trend ranging from slightly depleted to slightly enriched LREE (Fig. 12b). The LREE (La/Sm)N values range from 0.7 to 2.8, whereas the HREE (Sm/Yb)N slope is between 0.8 and 3.8. They show lower but also higher LREE and HREE slopes, and a higher REE variation than those for samples from the northern sector of the PMUB, suggesting a transitional N-MORB- to E-MORB-like geochemical signature.
Because the study of different trace elements is useful to identify tectonic setting and crustal contamination input, we used Th/Yb ratios as a proxy for magma–crust interaction or deep crustal recycling indicators (Pearce, Reference Pearce2008). As shown in the Th/Yb versus Ta/Yb diagram of Fig. 13a (Pearce, Reference Pearce1982), the mafic rocks of the PMUB exhibit a MORB–within-plate basalt (WPB) trend, with the majority of the samples lying in the tholeiitic field. Samples from the Bonilla area yield the most variable Th/Yb and Ta/Yb ratios, suggesting the presence of a variety of chemical signatures from N-MORB tholeiitic to E-MORB transitional to alkaline signature. In addition, samples from the Sierra del Tigre and Bonilla areas plotting in the upper part of the MORB–WPB trend may be an indication of not only crustal contamination but also recycled crustal components that imprint similar features to those of arc-related basalts (e.g. Pearce, Reference Pearce2008; Xia & Li, Reference Xia and Li2019). Similarly, the tectonic discrimination diagram of Cabanis & Thiéblemont (Reference Cabanis and Thiéblemont1988) shows that the majority of the analysed mafic rocks have a geochemical signature between N-MORB tholeiitic and E-MORB transitional to alkaline (Fig. 13b). A few samples from the Sierra del Tigre and Bonilla areas lie in the continental alkaline basalts and continental tholeiities fields, as well as within the arc-related field. When plotted together, samples from the PMUB and mafic lava flows from the Catoctin Formation (Neoproterozoic) in the Blue Ridge Mountains of the central Appalachians (Badger & Sinha, Reference Badger and Sinha1988, Reference Badger and Sinha2004) indicate similar geochemical features (Fig. 13a, b).
Tectonic setting of mafic and ultramafic rock samples from the northern and southern PMUB. (a) Th/Yb versus Ta/Tb diagram (after Pearce, Reference Pearce1982). (b) 3Tb (ppm) – Th (ppm) – 2Ta (ppm) diagram (after Cabanis & Thiéblemont, Reference Cabanis and Thiéblemont1988). Samples from Catoctin Formation from Badger & Sinha (Reference Badger and Sinha2004), representing Neoproterozoic rift-related magmas from eastern North America, are shown for comparison. East African Rift and Rio Grande Rift samples from GEOROC (2020) (http://georoc.mpch-mainz.gwdg.de/georoc/), representing modern continental intra-plate settings related to mantle plume activity, are also shown for comparison. N-MORB – normal mid-ocean-ridge basalts; E-MORB – enriched mid-ocean-ridge basalts; WPB – within-plate basalts; PIAT – primitive island-arc tholeiites; OIB – ocean-island basalts; IAT – island-arc tholeiites; ICA – island-arc calc-alkaline basalts; SHO – island-arc shoshonites.

5.b. Pressure, temperature and melting depth for magma generation
We estimated pressure (P) and temperature (T) of crystallization in mafic rocks of the northern PMUB using the thermobarometers of Putirka et al. (Reference Putirka, Ryerson and Mikaelian2003) and Putirka (Reference Putirka2008). Based on clinopyroxene core and rim compositions (independent of liquid equilibria), we obtained P values between 1.1 and 7.1 kbar (samples QEA10 and KMES9, respectively), with a standard error estimate (SEE) of ±1.5 kbar (Putirka, Reference Putirka2008). We obtained T values between 1086 and 1199°C (samples KMES10 and KMES 11, respectively) with an SEE of ±52 to ±60°C (Putirka, Reference Putirka2008).
To estimate the P-T conditions based on clinopyroxene-liquid composition, we first test the equilibrium between both phases. In a first approximation for crystal-liquid equilibria, we considered the chemical composition of clinopyroxene cores in our P-T estimation. By comparing observed and predicted values of Fe–Mg exchange, we selected samples with an equilibrium constant KD (Fe-Mg)cpx-liq in the range of 0.27±0.03 (Putirka, Reference Putirka2008). We obtained P-T conditions of between 1.5 kbar, 1148°C (sample QLP6 from Sierra de la Invernada area) and 6.7 kbar, 1231°C (sample KMES10 from Calingasta area). T values conditions were also estimated using the plagioclase-liquid equilibria thermometer described by Putirka (Reference Putirka2008), and we obtained T values between 1123 and 1200°C with an SEE of ±7 to ±48 °C (samples QLP6 and BAYO1, respectively, from Sierra de la Invernada area). These values are in good agreement with P-T estimates on clinopyroxene and suggest simultaneous crystallization of clinopyroxene and plagioclase after early crystallization of clinopyroxene crystals. Our results are also consistent with estimations in mafic rocks from the Sierra del Tigre area obtained by Gonzaléz-Menéndez et al. (Reference González-Menéndez, Gallastegui, Cuesta, Heredia and Rubio-Ordóñez2013) that yielded Grt+Spl pressure conditions and T c. 1215°C. The obtained P-T conditions support the hypothesis of basalt generation at conditions of relatively low pressure in the mantle along the northern sector of the PMUB. Unfortunately, due to the poor representation of mineral chemistry data from the southern PMUB, it is not possible to compare P-T conditions between the northern and southern sectors of the belt. Nevertheless, Cortés & Kay (Reference Cortés and Kay1994) inferred plagioclase and olivine fractionation at low pressure from minor Eu negative anomalies and low Ni concentration. This would imply similar conditions of crystallization between the northern and southern sectors of the PMUB.
Additional observations based on LREE and HREE systematics show that both the northern and southern PMUB exhibit Sm/Yb ratios of 0.86–2. These ratios suggest that the mafic–ultramafic succession was derived from a mantle source in the spinel-garnet stability field. Since LREE/HREE ratios increase with increasing Moho depth (Mantle & Collins, Reference Mantle and Collins2008), we estimate the depth of melting by using Ce/Y ratios for the PMUB samples. Ce/Y ratios ranging over 0.8–1 correspond to an estimated crustal thickness of 20–25 km.
In order to constrain the mantle potential temperature (T p), we use PRIMELT3 MEGA.xlsm software (Herzberg & Asimow, Reference Herzberg and Asimow2015). Taking into account the estimated low-pressure conditions, and using the major-element composition of the most primitive sample (wehrlite ST55 in Table 2) with Mg no. = 81, we estimated a T p of 1503°C. A Mg no. of > 70 indicates that sample ST55 represents a direct partial melt of the mantle source. Liquidus temperature calculated in basalts, gabbros and diorite are between 1120 and 1440°C, with the lowest temperature for diorite ST27B (Mg no. 39) and the highest for gabbro COL8 (Mg no. 67) (Table 2).
6. Discussion
6.a. Assessment of crustal contamination and mantle source
Although basaltic magmas are believed to retain reliable geochemical traces of their tectonic setting of origin, using geochemical signatures alone to discriminate between continental intraplate basalts, including continental flood basalts and continental rift basalts, and arc basalts could be misleading (Xia, Reference Xia2014). Assimilation of sedimentary material and/or the contamination by continental crust or lithosphere can impart a subduction-like signature (e.g. negative Nb, Ta and Ti anomalies) and lead to the misidentification of contaminated CFB (Ernst et al. Reference Ernst, Buchan and Campbell2005; Xia, Reference Xia2014). In this sense, the lack of Nb-Ta and Ti depletion in PMUB argues against subduction components, but ancient crustal recycled materials can provide a crustal or subduction-like signal. In addition, the concentration of incompatible trace elements in contaminated CFB is markedly higher than those of arc-related basalts (Xia & Li, Reference Xia and Li2019). The scattered distribution in LILEs (such as Cs, Rb, Ba, K and Sr) (Fig. 10a) observed in the studied samples reflects features associated with post-magmatic/hydrothermal alteration. According to Reichow et al. (Reference Reichow, Saunders, White, Al´Mukhamedov and Medveded2005), high Ba concentration can be explained by post-emplacement/hydrothermal alteration and/or crustal contamination. Ba concentration observed in our mafic samples ranges over 41.5–539 ppm (Table 2). In addition, low La/Ba ratios (0.02–0.15) versus almost constant La/Nb (0.6–1) would be expected if hydrothermal fluids mobilize Ba and deplete the samples in Rb, K and Sr (Fig. 10a). This observation is consistent with Sr isotope data. The large Sr dispersion observed at relative constant ϵ Nd values (Fig. 11) can be better explained by Rb enrichment and Sr depletion by means of seawater addition (McCulloch et al. Reference McCulloch, Gregory, Wasserburg and Taylor1980), rather than the effect of magmatic processes such as crustal contamination and/or subduction processes. Nevertheless, slight crustal contamination processes should not be discarded.
Several studies have shown that the composition of basaltic magmas for a given mantle source depends on two factors: (1) the mantle temperature; and (2) the lithospheric thickness (e.g. McKenzie & O’Nions, Reference McKenzie and O’Nions1991; Watson & McKenzie, Reference Watson and McKenzie1991). Mantle potential temperatures obtained in mafic–ultramafic samples from the PMUB indicate a mantle potential temperature significantly above ambient mantle (ΔT p of c. 50–100°C), which is estimated as 1280–1400°C (Herzberg et al. Reference Herzberg, Asimow, Arndt, Niu, Lesher, Fitton and Saunders2007). This suggests a thermal anomaly that can be related to the presence of a mantle plume involved in the production of the PMUB magmatism. Nd isotope compositions showing the interaction of HIMU and PREMA mantle reservoirs (Fig. 11) are also indicative of mantle plume activity (Condie, Reference Condie2001). The ΔNb (ΔNb = 1.74 + log(Nb/Y) – 1.92 log(Zr/Y); Fitton et al. Reference Fitton, Saunders, Norry, Hardarson and Taylor1997) calculated for the PMUB mafic rocks reach values of up to +0.47, indicating that Nb is enriched 4.7 times relative to a ΔNb of 0 for a given Zr/Y (Fitton et al. Reference Fitton, Saunders, Norry, Hardarson and Taylor1997). Zr/Y and Nb/Y systematics suggest the requirement of a component derived from recycled oceanic crust mixed with a depleted mantle component described in tectonic settings with mantle plume activity (Condie, Reference Condie2001). In particular, a PREMA mantle source (sample ST55 in Fig. 11) may itself represent the melting of a mantle reservoir with intermediate composition between DMM (depleted MORB mantle), BSE, HIMU and EM (enriched mantle) end-member components (Zindler & Hart, Reference Zindler and Hart1986). ΔNb positive values, together with Nd isotope composition and REE–HFSE systematics (Figs 11–13) support the hypothesis of a mantle plume influence in the source of the PMUB.
In addition, geochemical features of the mafic rocks from the PMUB were compared with mafic units from two modern continental intra-plate settings, which are definitely related to mantle plume activity: the Rio Grande Rift of western North America and the East African Rift. We observed that mafic rocks from the southern PMUB (e.g. Bonilla, Cortaderas and Peñasco areas) show a relatively good correlation with the Rio Grande and the East African Rift settings (Fig. 13a); in contrast, Th–Tb–Ta concentrations can be compared with samples from the Rio Grande Rift, with the majority of the PMUB samples plotting in that field (Fig. 13b). This observation supports transitional affinity between MORB and WPB for the PMUB.
The Nd isotopic evolution with time indicates that, at the moment of crystallization of the mafic rocks, the highly positive ϵ Nd values (from +3.4 to +8.4) lie below the depleted mantle curve of DePaolo (Reference DePaolo1988). This support the above-mentioned hypothesis that the mafic rocks derive from an enriched mantle source or an old depleted mantle material mixed with a crustal component (Fig. 14). In particular, samples lying over or near the depleted mantle evolution curve exhibit only slight or poor crustal contamination. Nd isotope composition of the studied mafic rocks is comparable with that of Neoproterozoic–Cambrian mafic rocks from the Catoctin Formation in the Blue Ridge Mountains of the central Appalachians, southern Appalachians and the Southern Oklahoma Aulacogen in the current North American Plate (Fullagar et al. Reference Fullagar, Goldberg, Butler, Sinha, Whalen and Hogan1997; Badger et al. Reference Badger, Ashley, Cousens, Tollo, Bartholomew, Hibbard, Karabinos, Tollo, Bartholomew, Hibbard and Karabinos2010; Brueseke et al. Reference Brueseke, Hobbs, Bulen, Mertzman, Puckett, Walker and Feldman2016). The Neoproterozoic rift-related magmas from eastern North America have been attributed to the interaction of a plume with the subcontinental lithospheric mantle (Puffer, Reference Puffer2002) or a mantle plume that incorporated an eclogite component from subducted mantle slabs (Badger & Sinha, Reference Badger and Sinha2004). It is therefore possible that the mantle source for the PMUB mafic magmatism was derived in part from a Mesoproterozoic–Neoproterozoic basement exposed in the SE Laurentian Grenville Province (Fig. 14). In this context, our ϵ Nd(t) values (+3.4 to +8.4, at 418, 454 and 576 Ma), other similar observations (ϵ Nd(t) values +6.5 to +7.5 obtained by Davis et al. Reference Davis, Roeske, McClelland and Kay2000; Kay et al. Reference Kay, Godoy and Kurtz2005; Martina et al. Reference Martina, Astini and Pimentel2014 in the PMUB) and data from the Guarguaraz area in the Argentine Frontal Cordillera (López & Gregori, Reference López and Gregori2004; López de Azarevich et al. Reference López de Azarevich, Escayola, Azarevich, Pimentel and Tassinari2009) may indicate a common primitive magmatic source with a Grenville affinity. The igneous-sedimentary succession developed on a Grenville-aged crust for the PMUB is suggested by the presence of Mesoproterozoic rocks and equivalent Nd model ages in the Cordón del Portillo and other areas such as the Jagüé–Bonete locality, the Pie de Palo, Umango and Maz ranges, and the San Rafael and Las Matras blocks (e.g. Varela et al. Reference Varela, Basei, González, Sato, Naipauer, Campos Neto, Cingolani and Meira2011). Mesoproterozoic basic rocks of the Sierra de Pie de Palo in the Sierras Pampeanas (Fig. 1; Kay et al. Reference Kay, Orrell and Abruzzi1996) show an Nd isotope evolution trend comparable with our results, suggesting a possible correlation with this region of the Cuyania terrane (Fig. 14).
Nd isotopic evolution diagram for mafic and ultramafic rocks from the PMUB. The green shaded area indicates extreme evolution lines (samples CR 37-15 and ST27B) for analysed samples. Depleted mantle evolution curve model is after DePaolo (Reference DePaolo1981). CHUR – chondritic uniform reservoir. Dotted lines represent the field for Grenville Province from Lambert et al. (Reference Lambert, Unruh and Gilbert1988); Smith et al. (Reference Smith, Holm, Denisson and Harris1997); Goldberg & Dallmeyer (Reference Goldberg and Dallmeyer1997); Fisher et al. (Reference Fisher, Loewy, Miller, Berquist, Van Schmus, Hatcher, Wooden and Fullagar2010). Dashed lines indicating the field for southern Appalachian from Fullagar et al. (Reference Fullagar, Goldberg, Butler, Sinha, Whalen and Hogan1997). The pink shaded area indicates the field for mafic and ultramafic protoliths from the Pie de Palo basement and Pie de Palo Complex (Kay et al. Reference Kay, Orrell and Abruzzi1996; Rapela et al. Reference Rapela, Pankhurst, Casquet, Baldo, Galindo, Fanning and Dahlquist2010). Samples from the Catoctin Formation (Badger et al. Reference Badger, Ashley, Cousens, Tollo, Bartholomew, Hibbard, Karabinos, Tollo, Bartholomew, Hibbard and Karabinos2010) and from Southern Oklahoma Aulacogen (Brueseke et al. Reference Brueseke, Hobbs, Bulen, Mertzman, Puckett, Walker and Feldman2016) are shown for comparison.

Nd model ages of the PMUB correlate closely with the age of the Rodinia break-up and opening of the Iapetus Ocean along the Blue Ridge Rift of southeastern Laurentia (572 ± 5 to 564 ± 9 Ma; Aleinikoff et al. Reference Aleinikoff, Zartman, Walter, Rankin, Lyttle and Burton1995). In particular, Neoproterozoic–Cambrian mafic rocks from the PMUB and those from the Catoctin Formation and the Southern Oklahoma Aulacogen in North America seem to be contemporaneous and share a similar plume-enriched mantle source or an old recycled enriched Laurentian component (Fullagar et al. Reference Fullagar, Goldberg, Butler, Sinha, Whalen and Hogan1997; Badger et al. Reference Badger, Ashley, Cousens, Tollo, Bartholomew, Hibbard, Karabinos, Tollo, Bartholomew, Hibbard and Karabinos2010; Brueseke et al. Reference Brueseke, Hobbs, Bulen, Mertzman, Puckett, Walker and Feldman2016). This similarity, as well as Nd–Hf–Pb similarities between basement rocks from Cuyania and Chilenia (Jacques et al. Reference Jacques, Hauff, Hoernle, Jung, Kay, Garbe-Schönberg and Bindeman2020), may support the theory that both terranes derive from Laurentia.
In any case, the availability of more reliable crystallization ages in the framework of previous geological observations is critical to better constrain: (1) the evolution of magmatic events in the Cuyania–Chilenia and Laurentian margin, from the rift-drift phase until final separation; and (2) the rift-related magmatism between the Chilenia and the Cuyania terranes during Neoproterozoic – early Palaeozoic time.
6.b. Tectonic implications
In the context of the Rodinia break-up, the evolution of the SE Laurentian margin began with the opening of the Iapetus Ocean in successive pulses during 750–540 Ma from north to south (from Tennessee and Virginia areas to the Ouachita embayment) (e.g. Thomas et al. Reference Thomas, Tucker, Astini and Denison2012). Recently, Domeier & Jakob (Reference Domeier and Jakob2020) have proposed that the opening of the Iapetus Ocean involved two ‘Iapetan’ ocean basins: the Palaeo-Iapetus at 700 Ma, and the Neo-Iapetus at 600 Ma. According to that study, in the latter episode the Neo-Iapetus origin led to the detachment of small terranes, the drifting of these towards western Gondwana, the subduction of the Palaeo-Iapetus mid-ocean ridge and the arrival of a mantle plume at c. 615 Ma. Lithospheric weakness may derive from a regional extension and intra-continental rifting associated with the Neoproterozoic magmatism (e.g. the Catoctin flood basalts at c. 570–565 Ma; Badger & Sinha, Reference Badger and Sinha1988; Badger et al. Reference Badger, Ashley, Cousens, Tollo, Bartholomew, Hibbard, Karabinos, Tollo, Bartholomew, Hibbard and Karabinos2010).
Comparing those observations with our results for the PMUB, we propose that the magmatism in southern PMUB (with T DM ages of 750–556 Ma) started with the first opening stage of the Iapetus Ocean and continued with the second stage related to the Neo-Iapetus (Domeier & Jakob, Reference Domeier and Jakob2020) at 600 Ma. Our results show that the T DM estimations of 600–550 Ma fit well with reported magmatism in the central to southern Appalachians. The extending magmatism through Neoproterozoic–Cambrian time evolved as an E-MORB intra-continental rift magmatism to a proto narrow ocean with N-MORB-like magmatism.
The predominant mafic and ultramafic magmatism in the northern PMUB seems to have evolved as an intra-continental rift margin with younger T DM ages (468–416 Ma) and E-MORB geochemical signature.
In our model: (1) the intracontinental extension recorded between the Chilenia and Cuyania terranes in both northern and southern PMUB sectors did not lead to the final separation and opening of an evolved ocean basin; and (2) the E-MORB-like geochemical signature along the PMUB could be more likely described as a plume-distal ridge effect simultaneous to the origin of the incipient Cuyano ocean basin. This agrees with predictions from computational modelling and experimental data supporting the theory that mantle plumes may be laterally zoned up to a length of 1000 km, and may exhibit a compositionally enriched central portion with a more depleted outer region (Jones et al. Reference Jones, Davies, Campbell, Wilson and Kramer2016).
Mafic magmatism was probably driven by an extensional large-scale fault dipping to the west in a thinned (c. 20–25 km thick) continental crust. High-frequency receiver function (RF) analyses computed in the Andean back-arc region (c. 31–32° S) suggest the presence of a W-dipping ancient master fault compressively reactivated between the Chilenia and Cuyania terranes (Ammirati et al. Reference Ammirati, Pérez Luján, Alvarado, Beck, Rocher and Zandt2016; Ariza et al. Reference Ariza, Boedo, Sánchez, Christiansen, Pérez Lujan, Vujovich and Martínez2018). This major structure recognized in the suture zone between these terranes may affect the whole crust and was probably inverted as reverse faulting, driving to the formation of the Proto-Precordillera during Middle–Late Devonian time (Amos & Rolleri, Reference Amos and Rolleri1965; Davis et al. Reference Davis, Roeske, McClelland, Snee, Ramos and Keppie1999, Reference Davis, Roeske, McClelland and Kay2000; Willner et al. Reference Willner, Gerdes, Massonne, Schmidt, Sudo, Thomson and Vujovich2011) or probably during the Late Devonian – Early Carboniferous interval (e.g. Heredia et al. Reference Heredia, Farías, García Sansegundo and Giambiagi2012; Giambiagi et al. Reference Giambiagi, Mescua, Heredia, Farías, García Sansegundo, Fernandez, Stier, Pérez, Bechis, Moreiras and Lossada2014). Under compression, this major structure would have played a role leading the Cuyania basement under the Chilenia basement in a continental collision.
We propose that extensional stresses began south of 32° S in the PMUB and the Argentine Frontal Cordillera mafic–ultramafic belt and continued northwards up to 28° S. The Cuyania terrane may therefore have been partially rifted away from the Chilenia terrane through a probably late Neoproterozoic? large-scale fault and later accreted again during Middle–Late Devonian time (c. 390–365 Ma) (Ramos et al. Reference Ramos, Jordan, Allmendinger, Mpodozis, Kay, Cortés and Palma1986; Davis et al. Reference Davis, Roeske, McClelland, Snee, Ramos and Keppie1999, Reference Davis, Roeske, McClelland and Kay2000; Willner et al. Reference Willner, Gerdes, Massonne, Schmidt, Sudo, Thomson and Vujovich2011). In this interpretation, the Chilenia terrane is parautochthonous to Cuyania and both are part of a larger block (Dalla Salda et al. Reference Dalla Salda, Cingolani and Varela1992; Dalziel et al. Reference Dalziel, Dalla Salda and Gahagan1994; López & Gregori, Reference López and Gregori2004).
Although we do not have enough geological and geochronological evidence to state that the complete rift-drift process occurred during the Neoproterozoic – early Palaeozoic evolution between the Cuyania and Chilenia terranes and Laurentian margin, we find evidence from trace-element systematics and Nd isotopic data suggesting that the complex interaction between a mantle plume during Neoproterozoic time and a Grenville Laurentian basement contributed to the source of the studied PMUB magmatism.
7. Conclusions
New geochemical data of basalts, gabbros, leuco-gabbronorite, diorite and wehrlites from the northern sector of the PMUB yield enriched chondrite-normalized REE trends with low to moderate LREE/HREE ratios and slight negative to positive Eu anomalies. These patterns are compatible with an E-MORB to CFB geochemical signature. Major-element chemistry of clinopyroxene crystals from the analysed rocks also support a tholeiitic affinity. Estimations of P-T crystallization conditions (1.1–7.1 kbar, 1086–1231°C) suggest that crystallization occurred at low pressures.
The studied mafic rocks have ϵ Nd values between +3.4 and +8.4, which are lower than the depleted mantle. Low to high 87Sr/86Sr ratios of 0.7030–0.7143 seem to have been controlled by hydrothermal and/or post-emplacement alteration.
The integration of these new data with previous geochemical studies of the PMUB allow us to recognize that the northern sector of the PMUB has REE trends compatible with an E-MORB to CFB signature, whereas the southern sector exhibits a transitional E-MORB to N-MORB-like signature.
The Nd isotopic evolution with time indicates that the PMUB mafic rocks register the influence of an enriched mantle component or an old depleted mantle material mixed with a crustal component. In particular, samples lying over or near the depleted mantle evolution curve exhibit only slight crustal contamination.
REE trends and HFSE concentrations (e.g. positive ΔNb), together with the estimation of a high potential mantle temperature (T p = 1503°C; ΔT p c. 50–100°C above ambient mantle), point to the effect of a distal rising plume as a possible mechanism for the generation of the E-MORB/CFB studied rocks.
Depleted mantle Nd model ages (T DM) suggest that magmatic activity started in the southern PMUB during middle–late Neoproterozoic time (750–557 Ma) and continued N-wards during late Cambrian – Early Devonian time (490–416 Ma) over an extended margin. Our results suggest that the Neoproterozoic evolution of the PMUB is comparable to that of the assumed conjugated Laurentian margin. The early Neoproterozoic E-MORB magmatic activity can be linked to the effect of a distal mantle plume during the Iapetus Ocean opening. In particular, estimated T DM of 600–550 Ma could be linked to the plume-related magmatic activity in the central and southern Appalachians (e.g. Catoctin Formation), giving support to a contemporaneous origin and a similar plume-enriched mantle source.
Acknowledgements
This contribution has been funded by the Consejo Nacional de Investigaciones Científicas y Técnicas (CONICET-PIP 0072) and Ministerio de Ciencia, Tecnología e Innovación Productiva of Argentina (FONCyT-PICT2016-0046). The authors thank the members of staff of the Laboratório de Geoquímica Isotópica e Geocronologia of the Universidade de Brasília (Brazil) for making available their analytical facilities. We also thank Dr Fernando Colombo and Dr Alina Guereschi for their assistance at the Laboratorio de Microscopía Electrónica y Análisis de Rayos X (LAMARX) of the Universidad Nacional de Córdoba (Argentina). We are also grateful to the editor Dr Kathryn Goodenough, as well as Dr Veronica Oliveros and an anonymous reviewer, for their very helpful comments that significantly improved an earlier version of the manuscript.
Supplementary material
To view supplementary material for this article, please visit https://doi.org/10.1017/S0016756821000303



