I. INTRODUCTION
Li-ion batteries have been considered as one of the most promising energy storage devices due to their high energy density, environmental friendliness, stable cycling life, and thermal stability. Reference Whittingham1–Reference Etacheri, Marom, Elazari, Salitra and Aurbach3 Traditional carbonaceous materials have been commonly used due to its long cycle life and stable rate capability. However, their relatively low theoretical specific capacity of 372 mA h g−1 limits the increase of energy storage. Reference Cao, Jiao, Liu, Liu, Wang and Yuan4 Thus, the development of alternative materials with higher capacity or higher energy density is required in the future.
Transition metal oxides have been attracted increasing attention as anode materials for Li-ion batteries owing to their advantages, such as high theoretical capacity, nature abundance, low cost, and high energy density. Various kinds of metal oxides, such as MnO2, Reference Reddy, Shanjumon, Gowda and Ajayan5 Fe2O3, Reference Ji, Toprakci, Alcoutlabi, Yao, Li, Zhang, Guo, Lin and Zhang6–Reference Zhao, Li, Ding and Guan9 SnO2, Reference Ren, Yang, Abouimrane, Wang and Amine10,Reference Zhou, Cheng, Liu, Tay, Jiang, Jia, Zhang, Gong, Hng, Yu and Fan11 Fe3O4, Reference Zhang, Wu, Hu, Guo and Wan12 and Cu2O Reference Poizot, Laruelle, Grugeon, Dupont and Tarascon13 have been considered as promising alternatives anode materials for Li-ion batteries. However, practical implementation of the transition metal oxides has been still hindered by a series of shortcomings. Reference Wu, Chen, Hng and Lou14 One of the most important reasons is the volume expansion during charge/discharge cycling processes, which will lead to the dissolution of active material into electrolyte, resulting in low initial coulombic efficiency, fast capacity fading, and short cycle life. Reference Chen, Zhao, Wu, Wu, Li, Qian, Xu, Wu, Albishri, Al-Bogami, El-Hady, Lu and Amine15
To circumvent these issues, significant effects have been confirmed to solve the above-mentioned troublesome problems. The first way is to prepare nanosized active materials, such as nanowires, nanorods, and nanotubes. Reference Yuan, Yang and Tuan16 Another promising strategy is to synthesize composites for dispersing metal oxides uniformly into a buffering matrix. Reference Chen, Cheah, Chen, Jayaprakash, Madhavi, Yang and Lou17 The latter strategy is particularly significant attention because it can provide long-range conductivity, better controlled interface between the conducting carbons and the active materials. Reference Jia, Cheng, Lu and Wei18 Graphene (GN) is widely applied as a prominent modified material for electrodes of Li-ion battery owing to its properties and special structure. Reference Geim and Novoselov19 GN is a one-atom-thick 2D sheet of sp 2-bonded carbon atoms having thermal transport properties and exceptional mechanical. Reference Kim, Huang, Guo, Wen, Cui and Chen20 Especially, it can not only act as framework to support the metal and wrap the metal oxides to accommodate their volume change but also enhance conductivity and short the Li-ion diffusion path. Reference He, Wu, Zhao, Shi, Liu and Li21,Reference Li, Wang, Tang, Qi, Lun, Bai and Fan22 So it is deemed to an excellent candidate to improve the lithium storage performance of metal oxide electrodes.
Recently, Xiao et al. designed a new hybrid of Fe2O3/GNs synthesized by physically mixing reduced graphene oxide (RGO) with Fe2O3 particles. Reference Xiao, Wu, Sheng, Huang, Li, He, Zhang and Feng23 Yuan et al. developed a three-dimensional porous Fe2O3–SnO2 composite by the electrostatic spray deposition technique. Reference Yuan, Jiang, Li, Zhang and Yan24 Xia et al. designed a RGO/Fe2O3/SnO2 ternary nanocomposite by homogeneous precipitation Fe2O3 with graphene oxide followed by reduction of GO with SnCl2. Reference Xia, Li, Li, Liu, Wang, Li, Lü, Spendelow, Zhang and Wu25 When tested as anodes for Li-ion batteries, the above mentioned materials were all exhibited good electrochemical performance. However, these electrodes are mostly prepared by mixing the active materials with a polymer binder and then casting on to conductive substrates. This type of electrode inherently limits the performance of active material due to the relatively poor electrical conductivity caused by the contact resistance between individual particles and the polymer binder. Reference Wang, Ruiz, Guo, Favors, Bay, Ozkan and Ozkan26 In this study, we report the synthesis of a binder-free Fe2O3–SnO2–GNs electrode via a facile, eco-friendly method. Fe2O3–SnO2 particles are uniformly wrapped by several thin GN layers. The resulting self-assembled composites have a 2D hierarchical structure, which leads to higher porosity, larger specific surface area, and more improved conductivity than pristine metal oxides. The Fe2O3–SnO2–GNs film is test as anode material for Li-ion batteries. It is found that the synthesized film exhibited excellent cycle stability and high charge/discharge coulombic efficiency in half cell system. Also the film showed favorable operation in full Li-ion battery system comprising LiCoO2 cathode.
II. EXPERIMENTAL
A. Synthesis of Fe2O3 particles
The Fe2O3 particles were synthesized via a hydrothermal method. Briefly, 0.405 g FeCl3·6H2O, 0.116 g NH4AC, and 0.750 g polyvinyl pyrrolidone (PVP) were dissolved in 30 mL distilled water. The mixture was stirred vigorously for 10 min and then transferred into a Teflon-lined stainless steel autoclave, which was heated at 140 °C for 12 h and then cooled down to ambient temperature naturally. Finally, the resulting Fe2O3 particles were collected by centrifugation, washed with distilled water and ethanol for several times, and dried at 80 °C in a vacuum for 10 h.
B. Synthesis of Fe2O3–SnO2 composites
0.087 g SnCl4·5H2O and 0.010 g Fe2O3 particles were dissolved in 15 mL distilled water, and 0.267 g NaOH was added into the solution. Then the mixture was transferred into a Teflon-lined stainless steel autoclave and maintained at 220 °C for 2 h. The resulting products were collected, washed with distilled water and ethanol to remove the ions possibly remaining in the final product, and dried at 80 °C in a vacuum for 10 h.
C. Synthesis of binder-free Fe2O3–SnO2–GNs film
Graphite oxide (GO) was synthesized based on a modified Hummers' method. Reference Wan, Ren, Wang, Wang, Tong, Gao and Bai27 Fe2O3–SnO2–GNs film was synthesized by physical blending method. In brief, GO and Fe2O3–SnO2 composites were added into distilled water to form a mixed solution. The mixture was stirred for 1 h to form a homogenous solution, and then the Fe2O3–SnO2–GO film was obtained by filtering the above solution in the air. After freeze-drying process, the film was heated at 250 °C for 2 h with the protection of flowing argon gas to obtain the binder-free Fe2O3–SnO2–GNs film. The representative synthetic procedure of the sample is illustrated in Fig. 1.
D. Material characterization
The carbon element content of the Fe2O3–SnO2–GNs film was measured with an element analyzer (EA, VarioEL III, Elemental Company, Germany). The film morphology and structure were characterized by x-ray diffraction (XRD) measurements. It was obtained by a Rigaku D-max C III x-ray diffractometer (Bruker Corporation, Billerica, Germany) equipped with Cu Ka radiation at a scanning rate of 0.02° s−1 over the 2θ ranging from 10° to 70°. The micro structural properties of the resulting sample were studied by transmission electron microscopy (TEM) and high-resolution TEM (HRTEM, JEOL JEM-3010 [JEOL, Tokyo, Japan]). The morphology of the particles was studied using a scanning electron microscopy (SEM), which was conducted with FEI Quanta 400 ESEM-FEG instrument (FEI Company, Hillsboro, OR) in an accelerating voltage of 20 kV. An investigation on the product and the oxidation state of atom within Fe2O3–SnO2–GNs film was collected from x-ray photoelectron spectroscopy (XPS).
E. Electrochemical measurements
The electrochemical performances of the Fe2O3, Fe2O3–SnO2, and Fe2O3–SnO2–GNs film were tested with CR2025 coin cell. The Fe2O3–SnO2–GNs film anode electrode was directly used as working electrode, without any binder or conductor. The Fe2O3–SnO2–GNs film was loaded on nickel foam with 12 mm in diameter. And then the nickel foam was pressed at 20 MPa, with the purpose of achieving good contact between the nickel foam and active material. The Fe2O3 and Fe2O3–SnO2 electrodes were prepared by mixing a test material (80 wt%), acetylene black (10 wt%), and polyvinylidene fluoride (PVDF, 10 wt%) binder. The mixture slurries were painted onto nickel foam with 12 mm in diameter. The nickel foam was pressed at 20 MPa. Then the electrodes were dried in a vacuum oven for 12 h at 80 °C. The active material loading in each electrode was about 2 mg cm−2. All half cells were assembled with pure lithium foil as reference electrode and constructed in a glove box filled with protective argon gas. The electrolyte was 1 M LiPF6 dissolved in a mixture of dimethyl carbonate, diethyl carbonate and ethylene carbonate (1:1:1 by volume), and the separator was microporous polypropylene film. Electrochemical impedance spectroscopy (EIS) measurements were measured on an electrochemical workstation (660D, CHI Company, Shanghai, China) with a frequency ranging from 0.01 Hz to 100 kHz. Charge/discharge tests were carried out on a battery program-control test system (CT 2001A, Wuhan LAND Electronic Co., Ltd., China) at a constant current density of 100 mA g−1 in a cut-off potential window of 0.005–3.0 V. The full cell was assembled by utilizing Fe2O3–SnO2–GNs film as anode, LiCoO2 as cathode. The full cell was tested in the voltage ranging from 1.2 to 3.8 V at a constant current density of 100 mA g−1.
III. RESULTS AND DISCUSSION
A. Characterization of Fe2O3–SnO2–GNs film
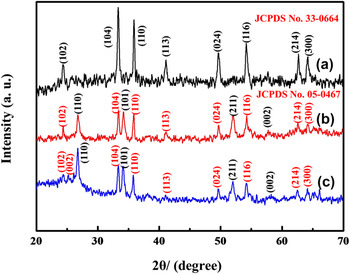
XRD measurements were used to investigate the crystalline structure of the synthesized powders and films (Fig. 2). As shown in Fig. 2(a), all diffraction peaks can be readily indexed to the hematite Fe2O3 (JCPDS No. 33-0664). No other peaks are observed, implying the high purity of the obtained product. Compared to the pure Fe2O3 particles, the diffraction intensities of Fe2O3 in Fe2O3–SnO2 sample become weaker [Fig. 2(b)]. This is may be because the Fe2O3 is coated by the SnO2, which makes the Fe2O3 particles not be readily detected by XRD. Besides Fe2O3, diffraction peaks of SnO2 (JCPDS No. 05-0467) are also found in Fig. 2(b), which suggests a success in depositing SnO2 on Fe2O3 through the hydrothermal reaction. Figure 2(c) shows the XRD pattern of the Fe2O3–SnO2–GNs film. The feature diffraction peaks of Fe2O3 and SnO2 are retained. Moreover, a small and broad diffraction peak (002) appears at about 26.5° corresponding to the average d-spacing of GN layers can be observed. Reference Su, Wang, Li, Bai and Wang28 It indicates that the composite consists of GN and well-crystallized Fe2O3 and SnO2.
Schematic illustration of the formation process of Fe2O3–SnO2–GNs film.

XRD patterns of the as-synthesized (a) Fe2O3, (b) Fe2O3–SnO2, and (c) Fe2O3–SnO2–GNs film.

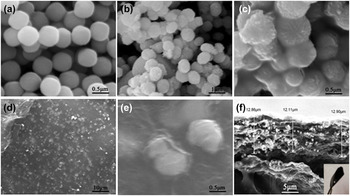
The SEM images of Fe2O3, Fe2O3–SnO2, and Fe2O3–SnO2–GNs film are shown in Fig. 3. As shown in Fig. 3(a), pristine Fe2O3 exhibits a spherical shape with a smooth surface and an average size ranging from 400 to 450 nm. During the hydrothermal reaction, the spherical morphology of Fe2O3 particles does not destroy [Fig. 3(b)]. And the surface turns to be rough and the size increases to more than 500 nm. Figure 3(c) presents a high magnification SEM image of Fe2O3–SnO2 compound materials. And the spherical particles were covered by large quantity of nanoparticles. Considering the Sn2+ added in hydrothermal process and the XRD results presented in Fig. 2, it is evident that Fe2O3 particles are coated by SnO2 and form new Fe2O3–SnO2 particles. Figures 3(d)–3(f) show the SEM images of Fe2O3–SnO2–GNs film. As can be seen in Figs. 3(d) and 3(e), a large number of Fe2O3–SnO2 particles are uniformly distributed among GN layers. The cross-section of the film presents in Fig. 3(f) shows that the thickness is about 12.6 μm. As shown in the inset of Fig. 3(g), no cracks can be found when bent the film with tweezers, indicating that the Fe2O3–SnO2–GNs film is flexible and suitable to use as electrode.
(a) SEM image of Fe2O3 particles with enlarged magnification, (b and c) SEM images of the Fe2O3–SnO2 materials with enlarged magnification, (d–f) SEM images of Fe2O3–SnO2–GNs film with enlarged magnification. Inset of (f) Photograph of the Fe2O3–SnO2–GNs film.

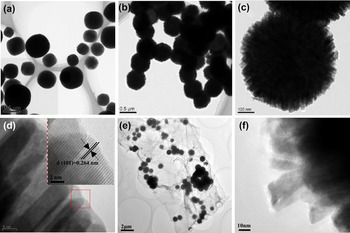
TEM measurements are used to further investigate the morphology and structure of the synthesized Fe2O3, Fe2O3–SnO2, and Fe2O3–SnO2–GNs film (Fig. 4). It is clear from Fig. 4(a) that Fe2O3 materials exhibit a sphere-like structure. The diameter distribution of the Fe2O3 ranged from 400 to 450 nm, corresponding to the SEM characterization. Figure 4(b) shows the TEM image of Fe2O3–SnO2 composite. And there are many embossments in the surface of Fe2O3 particles. The high magnification TEM image [Fig. 4(c)] shows that these embossments are nanorods. Meanwhile, these nanorods tightly distribute orderly on the surface of Fe2O3. The enlarged TEM image of the nanorods is shown in Fig. 4(d). The inset gives the HRTEM image recorded from the red-framed area marked in Fig. 4(d). The lattice fringes parallel to the interface can be clearly observed. The spacing is 0.264 nm, corresponding to the diffracted spots in the pattern indexed to (101) planes of SnO2, which agrees well with the XRD results. These results indicate that the nanorods are pure SnO2. So it can be confirmed that the Fe2O3 particles were completely enwrapped by SnO2 nanorods in the synthesized Fe2O3–SnO2 composites to form a sphere-rod type structure. The formation process for the structure includes “two-stage” according to the literature. Firstly, SnO2 nanoparticles appeared in the surface of the Fe2O3 precursors as the result of the heteronucleate through dehydration of Sn(OH)6 2−. Secondly, these SnO2 particles grow up into nanorods to form the sphere-like structure. Reference Niu, Huang, Cui, Huang, Yu and Wang29 The lattice mismatch at the interface is a very important factor in determining the growth direction of the secondary nanorod arrays. Reference Zhang, Sun, Jia, Yan, You and Yan30 TEM image of Fe2O3–SnO2–GNs film is presented in Fig. 4(e). It can be observed that Fe2O3–SnO2 particles are distributed arbitrary among GN layers, which is similar to the SEM result in Fig. 3(d). The Fe2O3–SnO2 particles are uniformly and tightly wrapped with thin GN layers to form a 2D hierarchical structure, which is helpful to improve the electrochemical performances and prevent GN layers agglomeration. In addition, the Fe2O3–SnO2 still retains pristine sphere-rod structure without obvious destruction [Fig. 4(f)]. It is clearly indicate that the GN has no effect on the final nanostructure of the Fe2O3–SnO2 particles.
(a) TEM image of Fe2O3 and (b–d) TEM images of Fe2O3–SnO2 with sphere-rods like morphology [the inset of (d): HRTEM of SnO2 nanorods], and (e and f) TEM images of Fe2O3–SnO2–GNs film.

Detailed element chemical compositions of Fe2O3–SnO2–GNs film are analyzed by XPS spectra (Fig. 5). According to the broad XPS spectrum in the region of 100–900 eV [Fig. 5(a)], four elements including C, Sn, O, and Fe are detected. In the figure, the peaks at 710.2, 723.6, 487, and 495.6 eV are ascribed to the Fe 2p 3/2, Fe 2p 1/2, Sn 3d 5/2, and Sn 3d 3/2 of Fe2O3 and SnO2 particles, respectively. Reference Kim, Hong, Kavian, Lee, Hyder, Horn and Hammond31–Reference Lei, Zhang, Qu, Chen, Wang, Zhang, Xu, Li and Wang33 In Fig. 5(b), the C 1s is related to the carbonaceous material of GNs in the Fe2O3–SnO2–GNs film. The C 1s peaks of XPS spectrum of the composite show three peaks, two weak peaks corresponding to C–OH and C(O)O groups and a dominant C–C peak. The presence of Fe2O3–SnO2–GNs film can be further determined by the Fe 2p XPS peaks at 710.2 and 723.6 eV, which match well with the standard XPS peaks for Fe(III) [Fig. 5(c)]. Reference Pradhan, Reddy and Parida34 Figure 5(d) consists of component peaks at 716.8, 487, and 495.6 cm−1, which can be ascribed to Sn 3p 3/2, Sn 3d 5/2, and Sn 3d 3/2 groups, respectively. Clearly, the XPS spectra provide important information of the oxidation state of atom within Fe2O3–SnO2–GNs film.
XPS patterns of Fe2O3–SnO2–GNs. (a) spectra and (b) C 1s spectra of the Fe2O3–SnO2–GNs film, (c) Fe 2p and (d) Sn 3d spectra of the Fe2O3–SnO2–GNs film.

B. Electrochemical characterization
After the successful formation of Fe2O3–SnO2–GNs film, an investigation of their electrochemical performance as an anode for Li-ion batteries was conducted. Figure 6 shows the CV profiles of the as-prepared Fe2O3, Fe2O3–SnO2, and Fe2O3–SnO2–GNs film for the first three cycles. The electrodes are investigated from 0.01 to 3.0 V with a scan rate of 0.5 mV s−1. Figure 6(a) shows the CV of the Fe2O3 electrodes in the initial three cycles. It is in good agreement with the previous reported Fe2O3 anodes. Reference Wang, Wang, Zheng, Wang, Bai and Bai35,Reference Zou, Kan and Wang36 Two cathodic peaks at 1.6 and 0.6 V are ascribed to the reduction of Fe3+ to Fe and the formation of solid electrolyte interphase (SEI) film. The main anodic peak at about 1.6–2.0 V is ascribed to the reversible oxidation of Fe. Figures 6(b) and 6(c) show the CV curves of Fe2O3–SnO2 and Fe2O3–SnO2–GNs electrodes. The peak positions appeared in the two figures are similar to each other. However, due to the existence of GNs, the peak intensities in Fe2O3–SnO2–GNs became weaker than that of Fe2O3–SnO2 electrode. The CV behavior of Fe2O3–SnO2–GNs electrode is closely analogous of the CV of Fe2O3–SnO2 electrode, which are generally in accordance with the reports in the literature. Reference Zou, Kan and Wang36,Reference Wu, Ren, Wen, Gao, Zhao, Chen, Zhou, Li and Cheng37 As shown in Fig. 6(c), in the first cathodic scan, two minor reduction peaks at potential of 1.2 and 0.4 V are observed. The reduction peak in 1.2 V is attributed to the formation of SEI [Eq. (1)] and the reduction of SnO2 to Sn [Eq. (2)]. Reference Mohamedi, Lee, Takahashi, Nishizawa and Itoh38,Reference Cakan, Hu, Antonietti, Maier and Titirici39 The 0.4 V peak is probably related to a chemical reaction between Sn and Li+ forming Li x Sn alloys [Eq. (3)] Reference Lin, Peng, Xiang, Ruan, Yan, Natelson and Tour40 and the reduction of Fe3+ by Li+ [Eq. (4)]. Reference Pradhan, Reddy and Parida34
 $${\rm{L}}{{\rm{i}}^ + } + {\rm{\ }}{e^ - } + {\rm{electrolyte}} \to {\rm{SEI}}\left( {{\rm{Li}}} \right)\quad ,$$
 $${\rm{Sn}}{{\rm{O}}_2} + 4{\rm{L}}{{\rm{i}}^ + } + 4{e^ - } \to {\rm{Sn}} + 2{\rm{L}}{{\rm{i}}_2}{\rm{O}}\quad {\rm{,}}$$
 $$x{\rm{L}}{{\rm{i}}^ + } + x{e^ - } + {\rm{Sn}} \to {\rm{L}}{{\rm{i}}_x}{\rm{Sn}}\quad {\rm{,}}$$
 $${\rm{F}}{{\rm{e}}_2}{{\rm{O}}_3} + 6{\rm{L}}{{\rm{i}}^ + } + 6{e^ - } \to 2{\rm{Fe}} + 3{\rm{L}}{{\rm{i}}_2}{\rm{O}}\quad {\rm{.}}$$
Cyclic voltammograms curves of (a) Fe2O3 (b) Fe2O3–SnO2 (c) Fe2O3–SnO2–GNs film at the scan rate of 0.5 mV s−1.

As to the anodic sweep process, two minor oxidation peaks are detected at 0.8 and 1.7 V, which can be ascribed to the oxidation of Fe0 to Fe3+ and the dealloying process of Li x Sn, Reference Guo, Zheng, Gao, Ma and Qin41 respectively. In the subsequent cycles, the location of the peaks is remarkably consistent. It infers that the electrochemical reaction in Fe2O3–SnO2–GNs electrode is highly reversible.
Figure 7 illustrates the first and second charge/discharge voltage profiles of the Fe2O3, Fe2O3–SnO2, and Fe2O3–SnO2–GNs film at a current density of 100 mA g−1 over the ranging of 0.005–3.0 V versus Li+/Li. For the Fe2O3 electrode in Fig. 7(a), the initial curve consisted of slight plateaus at 1.6 and 0.8 V, which are typical characteristics of potential trends for Fe2O3 materials (Fe2O3 +6 Li = 2Fe + 3Li2O). Reference Zhao, Li, Ding and Guan9 The initial discharge capacity of the electrode is 1104 mA h g−1, but the capacity for the second cycle is only 744 mA h g−1. The large discharge capacity fading is mainly caused by the irreversible formation of SEI and the electrolyte decomposition during the first cycle. Reference Seo, Lee, Kim, Lee and Kim42–Reference Xu, Wang, Ding, Song and Fang44 The charge/discharge curve of Fe2O3–SnO2 electrode is shown in Fig. 7(b). The initial discharge capacity is around 1626 mA h g−1, and the second discharge capacity is 897 mA h g−1. The result is higher than Fe2O3 electrode and significant changes have taken place in the shape of the curve. This is because the electrochemical reactions of Eqs. (1)–(4) were all proceed during the process. The initial discharge capacity of the Fe2O3–SnO2–GNs electrode [Fig. 7(c)] is 1120 mA h g−1, and all plateaus are more visible and there are basically no change compared to the Fe2O3–SnO2 anode materials.
Figure (a–c) 1st, 2nd discharge–charge profiles of Fe2O3, Fe2O3–SnO2, Fe2O3–SnO2–GNs film cycled at a constant current density of 100 mA g−1. Figure (d–f) cycling performance of Fe2O3, Fe2O3–SnO2, and Fe2O3–SnO2–GNs as anodes at a current density of 100 mA g−1 for half-cell.

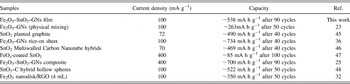
Figures 7(d)–7(f) show the comparison of cycling performance for the Fe2O3, Fe2O3–SnO2, and Fe2O3–SnO2–GNs electrodes measured at a current density of 100 mA g−1. It is clear that the reversible capacity of Fe2O3 and Fe2O3–SnO2 is not satisfied. As can be seen in Fig. 7(d), the reversible capacity of Fe2O3 in the first cycle is as high as 1104 mA h g−1, but it fades quickly and a capacity of 133 mA h g−1 can only be obtained after 70 cycles. The same problem also exists in the Fe2O3–SnO2 anode, the initial discharge capacity of Fe2O3–SnO2 material is found to be 1626 mA h g−1, and the capacity dramatically degraded to 268 mA h g−1 at the 70th cycle. Regarding to Fe2O3–SnO2–GNs electrode [Fig. 7(f)], it demonstrates much better cyclic retention and reversible capacity than Fe2O3 and Fe2O3–SnO2. Its initial discharge capacity is 946 mA h g−1. After 90 cycles, it still delivers a high capacity of 538 mA h g−1. This value is much better than the result obtained on Fe2O3 and Fe2O3–SnO2 electrodes. Based on the above electrochemical investigations on the Fe2O3–SnO2–GNs electrode, a lithium storage comparison between our result and other similar works is summarized in Table I. It is noteworthy that the Fe2O3–SnO2–GNs film in our work displays an impressively excellent electrochemical performance compared with previous works. Reference Xiao, Wu, Sheng, Huang, Li, He, Zhang and Feng23,Reference Qu, Yin, Wang, Yan, Guo and Song32,Reference Zou, Kan and Wang36,Reference Kim, Nam, HO Lee, Choi and Kim45–Reference Wu, Du, Zhang, Zhai and Yang48
Lithium storage performance comparison of Fe2O3–SnO2–GNs electrodes with similar works.

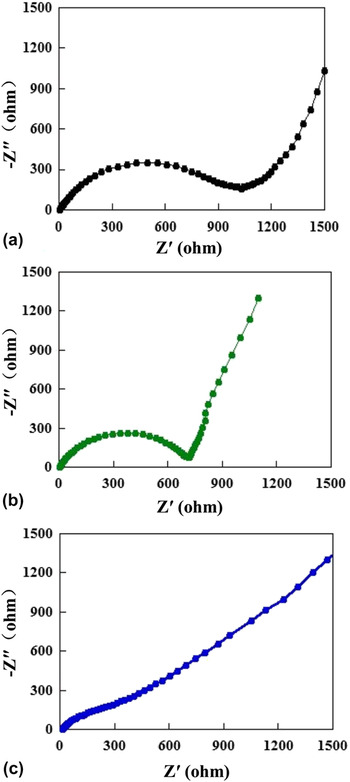
To acquire more insight into the electrochemical performance of the Fe2O3–SnO2–GNs film, EIS was carried out. Figure 8 shows the Nyquist plots of the Fe2O3, Fe2O3–SnO2, and Fe2O3–SnO2–GNs electrodes after the first cycle. All the plots are composed of a semicircle at the high to medium frequencies followed by a slope line at low frequencies. In general, the smaller the diameter of a semicircle is, the lower the charge transfer resistance of an electrode. Reference Wang, Wang, Zheng, Wang, Bai and Bai35 It is worth noting that the charge-transfer resistance of Fe2O3 [Fig. 8(a)], Fe2O3–SnO2 [Fig. 8(b)], Fe2O3–SnO2–GNs film [Fig. 8(c)] gradually decreased. The charge transfer resistance of the Fe2O3–SnO2–GNs film is 170 Ω, which is much lower than the Fe2O3 and Fe2O3–SnO2 electrodes. The inclined line in the low frequency range represents the Warburg impedance associated with the Li-ion diffusion. Reference Rahman, Wang, Hassan, Wexler and Liu49 In the lower frequency region in Fig. 8, the Fe2O3–SnO2–GNs film displays lower slopes than the Fe2O3, Fe2O3–SnO2 composite, which indicates good Li-ion kinetics in the electrode materials. Reference Choi, Ko, Lee and Kang50 The Fe2O3–SnO2–GNs shows better Li-ion kinetics and smaller charge transfer resistance than the Fe2O3 and Fe2O3–SnO2 composites.
EIS results comparison of (a) Fe2O3, (b) Fe2O3–SnO2, and (c) Fe2O3–SnO2–GNs as anodes for half-cell.

To further explore the excellent electrochemical performance of Fe2O3–SnO2–GNs film, the microstructure of the electrode after 90 cycles was investigated by SEM (Fig. 9). It can be seen that the plenty of Fe2O3–SnO2 particles dispersed on the GN layers, which is similar to the results observed from Fig. 3(d). And the Fe2O3–SnO2 still maintains good shapes and exhibits little morphology change. Furthermore, cracks in GN layers were not observed, indicating that the GN acts as a “buffer-zone” that is capable of tolerating the Fe2O3–SnO2 volume change.
SEM image of the Fe2O3–SnO2–GNs cycling performance measurement followed by cycling 90 times at 100 mA g−1.

Based on the above analysis, the enhancement of lithium storage property in the Fe2O3–SnO2–GNs film should be attributed to three factors. Firstly, because the Fe2O3–SnO2 particles distributed in GN layers, the agglomeration of these particles was prohibited effectively. More active sites thus can be obtained and reacted with Li+, implying the lithium storage sites could be increased by the introducing of GNs. Secondly, the GN could act as buffer matrix to accommodate the volume change associated with lithium insertion/extraction during cycling. Thirdly, the introduction of GN in the metal oxide system can enhance the conductivity of the related electrode and shorten the diffusion length for Li+. Benefited from the enhanced structural stability and kinetics for lithium storage, the Fe2O3–SnO2–GNs thus possessed a better capacity compared to the Fe2O3 and Fe2O3–SnO2 electrode.
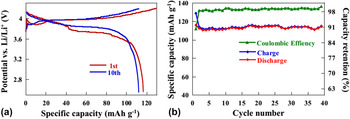
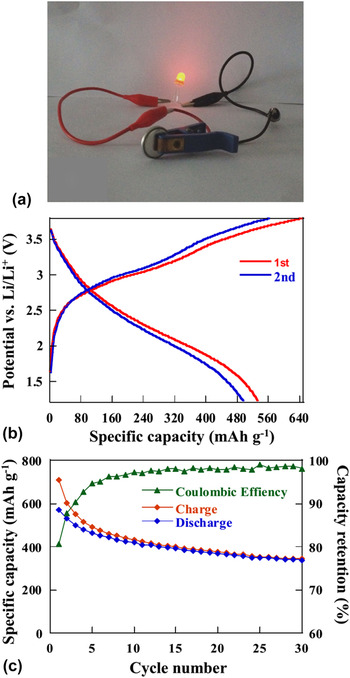
To evaluate the feasibility of Fe2O3–SnO2–GNs film in practical energy storage application, full cells are assembled by Fe2O3–SnO2–GNs film as anode and commercial LiCoO2 as cathode. The commercial LiCoO2 cathode tests in a LiCoO2//Li half cell. Figure 10 displays charge/discharge curves and cycling performance of the commercial LiCoO2 cathode. The cathode is tested at the voltage ranges from 2.5 to 4.4 V with a current density of 100 mA g−1. Two charge and discharge plateaus are observed at 3.8 and 4.0 V [Fig. 10(a)]. The initial cycle delivered a discharge capacity of 116 mA h g−1 and retained at 115 mA h g−1 after 10 cycles. Its cycling stability is further investigated, which is shown in Fig. 10(b). It is clearly seen that the LiCoO2 cathode exhibits a stable cycle performance with a capacity of ∼115 mA h g−1 after 40 cycles. After the electrochemical evaluation of LiCoO2 material, we then use it as cathode and Fe2O3–SnO2–GNs as anode to assemble full cell system. The system was designed in a capacity ratio of LiCoO2 to Fe2O3–SnO2–GNs of 1.2, which indicated the anode was a limiting electrode. The full cell is tested in the voltage ranging from 1.2 to 3.8 V at a constant current density of 100 mA g−1. Figure 11(a) shows that the output voltage of the assembled full cell is sufficient to turn on a 3 V, 10 mW red light emitting diode when it is fully charged to 3.8 V. Because the full cells are anode limited, the specific capacity is referred to the mass of Fe2O3–SnO2–GNs film electrode. As shown in Fig. 11(b), the full cell presents two plateaus at about 2.9 and 2 V in the first cycle, which is ascribed to the reversible redox reaction during the charge/discharge process. Figure 11(c) shows the cycling performance of the full cell. It is clearly seen that the cell delivered a high capacity of 570 mA h g−1 at the initial cycle. After 30 cycles, a capacity of 334 mA h g−1 can be maintained. This result indicates that the full cell assembled by LiCoO2 and Fe2O3–SnO2–GNs could be worked reversibly. However, due to the capacity ratio of the cathode–anode was not optimized; the full cell exhibited much more irreversible capacity during cycles. Therefore, further optimization and development should be done to improve their longer cycling performance, which will bring out new opportunities for high performance Li-ion batteries.
(a) The discharge–charge profiles of LiCoO2 and (b) cycling performance of LiCoO2 as cathode for half-cells.

(a) A red light emitting diode (LED) lighting by the Fe2O3–SnO2–GNs//LiCoO2 full cell. (b) Discharge–charge profiles and (c) cycling performance of Fe2O3–SnO2–GNs film as anode for full-cells.

IV. CONCLUSION
Fe2O3–SnO2–GNs film is synthesized by a facile mixing method. The film is tested as an anode material both in half and full Li-ion battery systems. The results in half cell system show that Fe2O3–SnO2–GNs exhibited much better lithium storage property than Fe2O3 and Fe2O3–SnO2 electrodes. This is mainly caused by the introduction of GNs which not only improves the electrical conductivity of the electrode but also serves as disperse agent and buffer matrix to increase lithium storage sites and buffer the volume change of Fe2O3–SnO2. The results in full cell system show that Fe2O3–SnO2–GNs anode worked well when cooperated with LiCoO2 cathode.
ACKNOWLEDGMENTS
This work was supported by the financial supports of the National Natural Science Foundation of China (Nos. 21061130551 and 21301140), and the Xi'an Industrial Technology Innovation Project-technology transfer promoting program (No. CXY1438-7).