


I. INTRODUCTION AND OBJECTIVES
Along with the increase of road traffic and the burst in wireless communication technologies, the interest in vehicle-to-vehicle (V2V) communications has significantly raised. Also, its wide area of applications, such as the improvement in traffic safety and management together with infotainment services contribute to the breakthrough of this technology.
The aim of this research work is to provide a complete simulation tool to evaluate the performances of V2V communications. The simulation models should include the physical layer of the transmitter/receiver, antenna properties, and the complete description of the propagation channel for each considered scenario. This paper focuses explicitly on the modeling of propagation channels and the extraction of various channel properties. The most encountered approaches in the literature, for modeling V2V communications’ propagation channels are: deterministic, stochastic, and geometry-based stochastic methods.
Deterministic approaches [Reference Maurer, Fügen, Schäfer and Wiesbeck1, Reference Abbas, Nuckelt, Kurner, Zemen, Mecklenbrauker and Tufvesson2] such as ray-tracing methods describe site-specific realistic simulations. In these approaches, accurate parameters such as dimensions and electromagnetic (EM) properties of multipath contributors present in the scenario should be included. Hence, they require time-consuming modeling of the environment to be simulated and are therefore computationally expensive. Although they offer the most accurate simulation, their applications are limited as they are numerically too intensive to process. Stochastic approaches [Reference Acosta-Marum and Ingram3], like Tapped-Delay Lines (TDL), consist in modeling channels according to some of their parameters like delay, Doppler frequency, and angular spread. Each tap is described by those aforementioned parameters based on the wide-sense stationary uncorrelated scattering (WSSUS) assumption. The channel impulse response is obtained by means of a finite impulse response filter with a discrete number of taps. Their low computational complexity and high flexibility make them attractive. However, V2V channels are widely-known to have a non-stationary behavior [Reference Bernado, Zemen, Tufvesson, Molisch and Mecklenbrauker4] and hence the WSSUS assumption no longer stands. Therefore, TDL models are not totally adequate to reproduce V2V channel models. The Geometry-Based Stochastic Channel Modeling (GBSCM) method [Reference Karedal5] is a combination of both the deterministic and stochastic approaches. In this method, scatterers are placed randomly (according to suitable statistical distribution) around the transmitter and receiver. Scatterers in GBSCM are often represented by simple geometric shapes with uniform materials. Then, simplified ray-tracing is performed to evaluate the corresponding channel impulse response. This approach is numerically cheaper than purely deterministic method and enables to intrinsically model the non-stationary behavior as it includes the dynamic nature of the environment. Taking into account its numerous advantages, many researchers focused their attention on the GBSCM as an approach to simulate V2V propagation channels. Some of these models can be classified in regular-shaped GBSCM, where the scatterers are placed on regular shapes like ellipses [Reference Soltani, Alimadadi and Mohammadi6], or a two-ring configuration [Reference Cheng7]. A series of papers by Zajic and Al [Reference Zajic and Stuber8, Reference Zajic9], proposed a three-dimensional (3D) model based on placement of scatterers on two cylindrical-shaped model. On the other hand, irregular-shaped GBSCM tends to reproduce the physical reality of the simulated configuration by a more realistic placement of the scatterers. A good example of an irregular-shaped GBSCM approach can be found in [Reference Karedal5] and is adapted in [Reference Renaudin, Kolmonen, Vainikainen and Oestges10] and [Reference Matolak and Wu11], where a highway environment was modeled. Three types of scatterers were distinguished representing mobile discrete (transmitter, receiver, and other vehicles), static discrete (road signs, etc), and diffuse scatterers, respectively. The channel impulse response, obtained after simplified ray-tracing is divided into four parts: (1) the line of sight (LOS) component, (2) discrete components stemming from reflections off mobile scatterers, (3) discrete components stemming from reflections off static scatterers, and (4) diffuse components. Thus, this model requires signal model parameters that the authors extracted from measured data. Although this model is useful and accurate, it remains quite complex and requires much effort to set up. Rather than emulating a specific propagation channel with parameters extracted from costly measurement campaigns, we aim at a direct and simple approach to emulate characteristics of different families of propagation channel pertaining to the V2V context.
In this paper, we introduce a new GBSCM method to get typical channel responses of various propagation channels through a standard EM simulator. Our aim is to simulate virtual driving scenarios that can be distinguished in terms of their channel properties such as root mean square (RMS) delay, angles of arrival (AOA) and Doppler spectrum. The main contributions of our proposed method are the following:
• Only a unique type of scatterers is used in our model
• A generic physical setting is developed and the number and position of scatterers, in it, can be easily (though empirically) adjusted in order to obtain channel impulse responses pertaining to different V2V environments.
• Random positioning of scatterers according to suitable statistical distributions within correct intervals ensures that the channel response falls in some prescribed propagation channel category.
• A set of random realizations of dynamic scenarios is performed to ensure that the parameters of the channel response remain within the range of models known from literature or acquired from experiments.
• Models are developed with a well-known and liable EM simulator. The facility and accuracy for the integration of realistic antenna pattern also motivated the use of this software. This will further enable virtual testing of antenna performance analysis according to their type and placement within the car body.
Through dynamic scenarios, such simulations could directly provide different channel responses that may be incorporated in a complete V2V communication simulation tool including antenna integration and the physical layer modeling of modems.
The paper is organized as follows: In Section II, a detailed description of our method is introduced. In Section III, a description of the different geometric configurations to be simulated is given. These configurations aim at mimicking rural, highway, and urban-like propagation channels. Section IV deals with the channel properties extracted from the different configurations. Comparisons with the properties of propagation channel models available in the literature will also be provided in that section. Finally in Section V, we will summarize the main results of this paper and future works will be proposed.
II. DESCRIPTION OF THE GBSCM METHOD
We wish to simulate dynamic scenarios representing two vehicles in motion. The main idea is to use simple perfect electric conducting plates as simple scatterers to emulate essential characteristics defining a V2V propagation channel. The dimensions of the 2D scatterers are 1.5 × 2 m and are thus large compared with the wavelength at the central frequency of 5.9 GHz dedicated to V2V communications. The variables that are made to change from one configuration to another are the number of metallic plates and their probabilistic locations with respect to the antennas.
Ray-tracing is performed by a specific module of the EM simulator FEKO, based on the Uniform Theory of Diffraction. The number of interactions (reflection and diffraction) for each ray is limited to 3. However, FEKO is not designed to simulate time-variant scenarios. Therefore, to obtain a time-sequence, successive static scenes (snapshots) must be created to simulate a dynamic scenario. Series of 1000 snapshots are thus created to represent different time-variant configurations.
Figure 1 shows a general representation of the simulated environment. The transmitter T X, and the receiver R X, represented by their respective radiation patterns, are separated by a distance D of typically 300 m. The scatterers are distributed along 2M + 1 lines L 1, L 2, …, L 2M+1 spaced 8 m from each other. The number of lines 2M + 1 is adjusted according to different scenarios. The total number N of scatterers is divided in two sub-parts, N IN those lying between the antennas (T X and R X) and N OUT those lying before the T X (y < 0) and beyond the R X (y > 300). N OUT scatterers have a clustering effect of producing multipath components with higher delays. Regarding the high number of scatterers in our simulation, we opt for an automatic and randomized positioning. The y-coordinates of the scatterers are drawn from a discrete uniform distribution within specific bounds for each configuration. Thus, each scatterer is randomly placed according to some constraints pertaining to its position. If those constraints are well adapted it can be proved that the propagation channel characteristics are held within some prescribed values. Due to the random positioning of the scatterers, a need for numerous realizations of each configuration is necessary in order to verify the repeatability of our results.
Diagram outlining the general representation of the simulated configuration.

III. DESCRIPTION OF THE DIFFERENT SIMULATED CONFIGURATIONS
The aim of Section III is to introduce three geometric configurations which differ from each other in terms of number and placement of simple scatterers around the transmitter T X and receiver R X. These configurations will be simulated with the prospect to represent three distinct scenarios (rural, highway, and urban) in terms of the channel properties. We used an empirical method to select the appropriate number and location of scatterers following some basic rules to create poor or rich multipath environment or to modify angular spread of incoming waves on the R X. Therefore, the following simulation features have been determined, though not unique candidates, after various trial and error steps.
A) Rural
The first configuration was developed to reproduce the channel properties of a rural scenario. In this configuration, we locate 33 N IN scatterers equally spread over 11 lines (M = 5). The y-coordinates of the location of the scatterers are drawn, with a uniform distribution, from the interval y~ (20 280). Here, scatterers are distributed in a transversal way without there being any N OUT scatterers which leads to a low multipath contribution.
B) Highway
This configuration is due to represent the characteristics of a highway scenario. Each simulated highway configuration contains 33 N IN and 22 N OUT scatterers which are equally distributed among 11 lines (M = 5). The y-coordinates of the N IN scatterers are drawn within the following bound: N IN (y~ (20 280)). The N OUT scatterers are also positioned with their respective bounds: before the T X (y~ (−220,−20)) and after the R X (y~ (320 520)). We can notice the addition of N OUT scatterers which may represent elements contributing to multipath arriving on the receiver with higher delay and angular spread.
C) Urban
In this third configuration, 26 scatterers are dispatched over five lines (M = 2), though not equally distributed. Sixteen N IN scatterers are placed within interval (y~ (20 280)), without any N INT scatterers in the T X–RX axis (line 1). In addition, 10 N OUT scatterers are equally placed below the T X (y~ (−55,−45)) and beyond the R X (y~ (345 355)). This last configuration is destined to represent an urban environment, with scatterers confined laterally with the goal to create an urban canyon with the T X and R X placed in a LOS condition.
IV. COMPARISON WITH RESULTS ISSUED FROM LITERATURE
The vehicles T X and R X are virtually represented by the radiation pattern of a perfect dipole (isotropic in the azimuthal plane). The vehicles are assigned a speed of 30 m/s and the scatterers are considered static in the first place. After simulating our 1000 snapshots, the power delay profile (PDP) for each configuration can be constructed and used to derive channel metrics like the RMS delay spread (τ RMS). FEKO simulations are performed for the 64 subcarrier frequencies, equally spaced over the 10 MHz bandwidth around 5.9 GHz, of the 802.11p orthogonal frequency-division multiplexing (OFDM) signal. Therefore the impulse response is calculated from the discrete inverse Fourier transform of the frequency response. For the sake of brevity, definitions of PDP and τ RMS are not reported in this paper but may be found in [Reference Molisch12].
A) Channel properties
1) RMS DELAY
The RMS square delay spread quantifies the time dispersive character of the propagation channel. In this sub-section, we compare results obtained from 10 realizations of each of the three aforementioned configurations with results issued from different measurement campaigns available in the open literature.
In Fig. 2, it can be shown that the three configurations cover a broad spectrum in terms of τ RMS. However, we can notice a higher dispersion between the τ RMS spreads for the different realizations of the urban configuration.
τ RMS spreads for our simulated configurations.
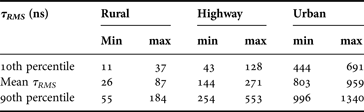
The minimum and maximum values of the 10th and 90th percentiles as well as the mean of the different RMS-delay distributions are provided in Table 1. It is clearly shown that the three scenarios can be easily distinguished from each other in a RMS-delay point of view. Furthermore, results obtained from our simulations are compared with results extracted from different measurement campaigns available in the literature and summarized in [Reference Molisch13]. In Table 2, we report the τ RMS spread observed in the most common environments: rural, highway, and urban, as issued from this review paper.
Statistics on the τ RMS spreads from our simulations.
τ RMS results from measuring campaigns issued from literature.
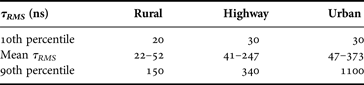
We can notice that for rural environment, we have good concordance between results from our simulations and results from measuring campaigns carried out in such an environment. Based on the same comparison, we also have good correlation between results reported in Tables 1 and 2 for highway scenarios. Besides, in Fig. 3, we compare the 10 simulated realizations of the highway configuration with results from three different measuring campaigns carried out on a highway environment [Reference Molisch13]. We can notice a good match between the distributions. For urban configurations, we expect large τ RMS due to the presence of multipath components arriving with large delays. Results obtained from simulated urban configurations are larger than for rural and highway scenarios as expected. Nevertheless, we notice that values of the 10th percentile and the mean τ RMS from the urban configurations are relatively high compared to those obtained in measuring campaigns.
Comparison τ RMS spreads for highway environment.
Moreover, a study to determine the angular spread for our different simulations seems necessary in order to verify if we can reproduce the same characteristics (in terms of angle of arrival (AOA) distributions) as in realistic rural, highway, and urban scenario.
2) AOA DISTRIBUTION
In V2V communications, scatterers found in the environment are about at the same height as the antennas resulting in multipath components arriving mainly in the azimuthal plane. Thus, the angular spread in the elevation plane is neglected.
The AOA on the receiver are calculated by geometric reconstruction of each ray. Figure 4 represents a snapshot of a simulated rural configuration with some ray-tracing. It is important to take into consideration the angular orientation of the simulated scenario. According to our chosen coordinate system, a path from the transmitter with a LOS will arrive with an angle of 270° on the receiver.
Angular orientation of the R X with respect to the T X.
We evaluate the probability of occurrence, with a step of 5°, for each of our three simulated configurations over the whole time-sequence duration (1000 snapshots). In Fig. 5, we represent the angular spread for one particular realization of each of our three simulated configurations.
Angular spread for: (a) rural configuration, (b) highway configuration, (c) urban configuration, and (d) new urban configuration.
In the rural configuration, the absence of N OUT scatterers leads to a low angular spread (Fig. 5(a)) which corresponds to a typical rural environment. For instance, in a rural scenario, there are few or no buildings. The main propagation mechanism remains the LOS accompanied with multiple reflections on the car body.
In a highway configuration we have a high angular spread due to the presence of the 22 N OUT scatterers (Fig. 5(b)). Typically, in a highway environment, elements contributing to multipath are numerous (high traffic density, presence of billboards, guardrails, and even middle wall separating lanes). Therefore, the angular spread obtained from our simulated configuration gives a good representation of a realistic highway environment.
Despite, a bi-directional angular spread (Fig. 5(c)) for our third simulated configuration, the latter does not totally correspond to a realistic urban scenario. In such a scenario, the presence of buildings and high traffic density ensure rich multipath. In order to reflect to a correct angular spread, we have to increase the number of scatterers in our simulated configuration. An increase in the perpendicular distance between scatterers and the direction of the vehicles will also enrich the angular spread. This study will be the subject of the next sub-section.
3) A NEW URBAN CONFIGURATION
Following inconclusive angular spread results in the previous sub-section concerning urban configurations, we decided to bring some modifications to our original configuration in order to create a new one. In the latter, 46 scatterers are spread over seven lines. Lines with the following indices were used: (L i, where i = 1, 4, 5, 10, 11, 20, and 21). Hence, the perpendicular distance between the lines where scatterers are placed and line 1 (the T X–R X axis) is increased. There are 18 N IN scatterers. 28 N OUT scatterers were equally dispatched over the seven lines. In Fig. 5(d), we evaluate the angular spread for our new urban configuration.
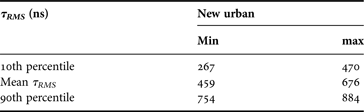
It was shown that upon an increase in number of scatterers (mostly N OUT scatterers) and their distance from the vehicles we are able to significantly increase the angular spread. We are bound to verify that the RMS delay spread for the new urban configuration remains within suitable range corresponding to urban configurations. From Table 3, we can see that the τ RMS distributions for the new urban configuration are closer to those obtained from literature (cf. Table 2) though the overestimation of the 10th percentile remains significant.
RMS delay spread for new urban configuration.
4) DELAY-DOPPLER SPECTRUM
We are in a dynamic context when we consider V2V communications. So, it is deemed judicious, if not mandatory, to characterize the associate Doppler spectrum. So, in this sub-section, we will calculate the delay-Doppler spectrum to model the spectral broadening produced by the different Doppler shifts of the multipath components for our four simulated configurations including the new urban configuration.
The periodogram method [Reference Stoica and Moses14] is used to estimate the delay-Doppler spectrum. The latter is obtained by performing the discrete-time Fourier transform of the respective simulated channel impulse responses and scaling the magnitude of the square of the result:
 $$S_p (k) = \displaystyle{1 \over {\sqrt {N_{sample}}}} \left \vert {\sum\limits_{n = 0}^{N_{sample} - 1} {h_p [n] \cdot e^{\displaystyle{{j2{\rm \pi} nk} \over {N_{sample}}}}}} \right \vert ^2 $$
where k is the inverse of the sampling time. h p is the impulse response in the delay bin p. In our simulations, delay bins correspond to time-intervals of 100 ns in the delay domain. We also took a sampling time (T samp) of 400 µs leading a resolvable bandwidth of 1/T samp = 2500 Hz. In our four simulated configurations, the T X and R X as well as the scatterers are assigned speed corresponding to their environment. In the rural scenario, both the T X and the R X move at a speed of 19.4 m/s while the speeds of scatterers are made to vary between (16.7 and 19.4) m/s. The scatterers placed in lines found to the left of the T X–RX axis (lines L 2–L 2M) and those found in this axis itself (line L 1) move in the same direction as the T X and the R X. The others (lines L 3–L 2M+1) go in the opposite direction. The same displacement principle is applied to the highway scenario otherwise the T X and R X moving with speed of 30 m/s. Also, the scatterers are assigned speeds between (30 and 36) m/s. In the third configuration, representing an urban scenario, a speed of 9.7 m/s is chosen for both T X and R X while the speed of the scatterers varies from 8 to 13 m/s. In this third scenario also, the scatterers found in the axis of the T X–R X and those found in the two lines left of the T X–R X axis move in the same direction while the remaining scatterers move in the opposite way. Finally, the same principle as the previous configuration is applied to the new urban configuration. The three lines left of the T X–R X axis move in the same direction as the transmitter and receiver while those on the right of the T X–R X axis travel in the opposite direction. The 3D representations of the delay-Doppler spectrum for one particular realization of each scenario are shown in Fig. 6:
Delay-Doppler spectrum for: (a) rural configuration, (b) highway configuration, (c) urban configuration, and (d) new urban configuration.
It can be noted that the Doppler shift for a path for the T X impacting the scatterer P, with an angle φ Tx and arriving on the R X with an angle of φ Rx is given by:
 $$\eqalign{& {\rm \bf \nu} ({\phi}_{Tx}, \;{\phi}_{Rx} ) = \cr & \qquad \displaystyle{1 \over \lambda} \left[ {(V_{Tx} - V_{P})\cos {\phi}_{Tx} + (V_{Rx} - V_{P})\cos {\phi}_{Rx}} \right]}$$
where λ is the wavelength, V Tx, VP, and V Rx the respective speed of the transmitter T X, the scatterer P and the receiver R X. Finally, φ Tx and φ Rx are the angle of departure and arrival, respectively.
The first and strongest component arriving on the R X will contribute to the Doppler shift associated with the relative velocity of the T X and R X. For three simulated configurations, we notice a strong dominant frequency component that remains at the origin (0 Hz) as the T X and the R X are moving with the same speed (Fig. 6). In the highway configuration (Fig. 6(b)), the base of the spectrum remains wider in late delay bins due to strong angular spread of the multipath components arriving with larger delays.
In the original urban configuration (Fig. 6(c)), we can clearly see a multipath component with a high power spectral density arriving in delay bin 31 (contributing to a larger τ RMS). In this case, the width of the spectrum is thin due to the very low angular spread and low velocities associated with the elements in the configuration. An increase in the number of scatterers in the new urban scenario leads to a richer delay-Doppler spectrum (Fig. 6(d)), as compared with the original urban configuration. Moreover, we can notice a higher number of multipath components arriving with higher power spectral density reflecting the higher angular spread in the new urban configuration. Also, from [Reference Acosta-Marum and Ingram3], it is shown that configurations with higher velocities will lead to a wider base of the Doppler spectrum, implying a channel with faster temporal fluctuations. This is verified for our four simulated configurations, where the Doppler spectrum related to the highway configuration (Fig. 6(b)) has a wider base followed by the rural (Fig. 6(a)) and urban (Figs 6(c) and 6(d)) configurations respectively. Moreover, in Fig. 6(d) we can clearly see that, beside the LOS, five major clustering of scattered power are evident. Also, there is an enrichment of the Doppler spectra as we have various AOAs leading to intermediate Doppler frequencies with higher power densities as compared with the original urban configuration. Thus, the four simulated scenarios have distinct Doppler signatures that may be associated with their corresponding environments.
V. CONCLUSION AND FUTURE WORKS
In this paper, we have introduced a methodology, associated with the GBSCM models, to produce impulse channel responses that look like those encountered in typical environments for V2V communications. Rather than elaborating sophisticated channel modeling approaches based on channel sounding experiments, we suggest that these experiments may be virtually reproduced at least in a behavioral sense. We have shown with our three configurations that we are able to parameterize channel characteristics such as RMS-delay spread and AOA distribution and delay-Doppler spectrum with simple adjustments on the number and position of scatterers. The three arrangements of scatterers show to have good correlations with the channel properties extracted from measuring campaigns encountered in the literature. Future works will consist in integrating realistic antenna pattern (including the effect of the vehicle) into our channel propagation models. These new models will be used as test cases to evaluate the communication performance in terms of Bit Error Rate/Packet Error Rate (BER/PER) after the integration of the physical (PHY) layer of the IEEE 802.11p standard dedicated to V2V communications [Reference Ivan, Besnier, Bunlon, Le Danvic, Crussière and Drissi15]. Hence, this complete simulation tool will be able to guide our choice of antenna technology and integration on the vehicle.
Jessen Narrainen received his M.Sc degree in Electronics and Telecommunications from the University of Rennes 1. He is currently working toward his Ph.D. degree with automotive manufacturer Renault in collaboration with Institut d'Electronique et de Télécommunications de Rennes.
Philippe Besnier received his Ph.D. in 1993 from University Lille, France. He has been with Institut d'Electronique et de Télécommunications de Rennes since 2002 where he is currently co-head of the Antenna and Microwave devices department. He was appointed as senior researcher at CNRS in 2013.
Martine Gatsinzi Ibambe received her Ph.D. in 2008 from University of Paris-sud, Orsay, France. She is currently working with Renault on projects related to Advanced Driver Assistance Systems (ADAS) and connectivity systems.



