Metacognition involves the individual’s ability to plan how to approach a learning task, monitor own understanding, control strategies used and evaluate the progress made towards achieving a learning target (Schunk & Zimmerman, Reference Schunk and Zimmerman1994). Individuals with greater metacognitive abilities tend to be more successful thinkers (Sternberg, Reference Sternberg1984), use metacognition strategies for successful learning and have the ability to ’learn how to learn’ (Borkowski, Carr, & Pressley, Reference Borkowski, Carr and Pressely1987). This ability means that an individual is able to regulate his/her own learning efforts in order to become a strategic and independent learner (Meyer, Haywood, Sachdev, & Faraday, Reference Meyer, Haywood, Sachdev and Faraday2008).
The conceptualization of this study draws upon the cognitive and developmental psychology literature from which the term metacognition was initially originated in the work of Flavell (Reference Flavell1979) and Brown (Reference Brown, Weinert and Kluwe1987), and the socio-cultural literature from which the term self-regulation was derived from the work of Vygotsky (Reference Vygotsky1978). Specifically, the current study is linked with three elements represented in the literature of metacognition including metacognition knowledge (Annevirta & Vauras, Reference Annevirta and Vauras2001; Flavell, Reference Flavell, Weinert and Kluwe1987; Pintrich, Reference Pintrich2002; Schneider & Lockl, Reference Schneider, Lockl, Perfect and Schwartz2002), metacognitive monitoring and control (Brown, Reference Brown, Weinert and Kluwe1987; Nelson & Narens, Reference Nelson, Narens, Metcalfe and Shimamura1994; Pape & Wang, Reference Pape and Wang2003; Son & Schwartz, Reference Son, Schwartz, Perfect and Schwartz2002), and the monitoring of emotions and motivational states during learning tasks (Boekaerts, Reference Boekaerts1999; Corno, Reference Corno, Zimmerman and Schunk2001; Efklides, Reference Efklides2006; Zimmerman, Reference Zimmerman, Pintrich, Boekaerts and Zeidner2000).
It is well established within the Vygotskian approach that highlighting gaps in knowledge and skills alone cannot guarantee success in learning for all children. Bodrova and Leong (Reference Bodrova and Leong2007) argue that the development of self-regulation as the underlying skill that makes learning possible has to be addressed. From both research and practice, commentators believe that, for many children, school is an important context within which they can learn to regulate themselves. Kindergarten classrooms present a significant opportunity to influence self-regulation in young children. It should be given the same, if not more, attention as the instruction in academic subjects.
As in the original work of Withebread, Anderson, et al. (Reference Whitebread, Anderson, Coltman, Page, Pino Pasternak and Mehta2005), Withebread et al. (Reference Whitebread, Almeqdad, Bryce, Demetriou, Grau, Sangster, Efklides and Misailidi2010) and Whitebread, Bingham, Grau, Pino Pasternak, and Sangster (Reference Whitebread, Bingham, Grau, Pino Pasternak and Sangster2007), this study uses the term ‘independent learning’ as synonymous with self-regulated learning. This paper reports on a study exploring independent learning amongst Jordanian preschoolers using the Children’s Independent Learning Development (CHILD 3–5) observational instrument, which was developed within the Cambridgeshire Independent Learning (C.Ind.Le) project (Whitebread, Coltman, Anderson, Mehta, & Pino Pasternak Reference Whitebread, Coltman, Anderson, Mehta and Pino Pasternak2005; Whitebread et al., Reference Whitebread, Bingham, Grau, Pino Pasternak and Sangster2007; Whitebread et al., Reference Whitebread, Almeqdad, Bryce, Demetriou, Grau, Sangster, Efklides and Misailidi2010). This is the first study of independent learning among preschoolers in Jordan.
With regard to the early development of metacognition and self-regulation, early studies investigating metacognition strategies suggested that metacognition is a late-developing capability and does not emerge until the age of 7–8 years (e.g., Flavell, Beach, & Chinsky, Reference Flavell, Beach and Chinsky1966; Kreutzer, Leonard, Flavell, & Hagen, Reference Kreutzer, Leonard, Flavell and Hagen1975; Veenman, Van Hout-Wolters, & Afflerbach, Reference Veenman, Van Hout-Wolters and Afflerbach2006). Recent and comprehensive overviews have, however, provided evidence that the development of metacognitive and self-regulatory processes is fundamental to young children’s psychological growth and can be seen at an earlier age than was suggested initially (Bronson, Reference Bronson2000; Rothbart, Posner, & Kieras, Reference Rothbart, Posner, Kieras, McCartney and Phillips2006). Bronson (Reference Bronson2000), for example, describes extensive research which has investigated the emotional, prosocial, cognitive and motivational developments in self-regulation throughout the different phases of early childhood. Rothbart et al. (Reference Rothbart, Posner, Kieras, McCartney and Phillips2006) have also reviewed research evidence linking various executive functions with self-regulation up to the age of 6 years.
Although research on the development of metacognitive knowledge has illustrated that young children normally demonstrate verbal difficulties when responding to hypothetical questions (Kreutzer et al., Reference Kreutzer, Leonard, Flavell and Hagen1975), Weinert and Schneider (Reference Weinert and Schneider1999) have stressed that metacognitive knowledge improves with age and schooling. Nonetheless, Annevirta and Vauras (Reference Annevirta and Vauras2001) argue that when researchers have relied less upon children’s verbal abilities children were found to be more knowledgeable than was previously reported. In relation to research on metacognitive experience, Schneider and Lockl (Reference Schneider, Lockl, Perfect and Schwartz2002) have reported that preschool children were more precise in their monitoring of metacognitive experience than older children when they engaged in meaningful tasks, although the latter group performed more accurately when predicting future performance, estimating whether they were ready to recall a series of items, or reporting if they were able to recognize the name of items they were not able to retrieve spontaneously. Children aged 4 to 5 years have also been shown to provide accurate feeling-of-knowing judgments when presented with pictures of children and adults varying in the level of familiarity (Cultice, Somerville, & Wellman, Reference Cultice, Somerville and Wellman1983).
In relation to the educational impact of metacognition and self-regulation on young children learning and development, there is significant evidence suggesting that metacognition and self-regulation training enhances educational achievement, whereas poor self-regulation predicts school failure amongst young children (Ponitz et al., Reference Ponitz, McClell, Jewkes, Connor, Farris and Morrison2008). Blair and Razza (Reference Blair and Razza2007) carried out a longitudinal study aimed at investigating the role of self-regulation in emerging academic ability in 3- to 5-year-old children from low-income homes in the United States. They found that early maths and reading ability were uniquely predicted by various aspects of self-regulation and executive control, and this finding led them to argue that curriculum should be designed to improve self-regulation skills as well as enhance early academic abilities to help children to succeed in school.
According to studies reviewing educational interventions directed towards enhancing metacognition and self-regulation amongst pupils, two met-analyses conducted by Hattie, Biggs, and Purdie (Reference Hattie, Biggs and Purdie1996) and Dignath, Buettner, and Langfeldt (Reference Dignath, Buettner and Langfeldt2008) have argued that interventions involving problem-solving activities, collaborative groups, explicit metacognitive learning strategies and reflection on learning have positive impact upon learning outcomes. The number of this kind of interventions directed to preschool children is very small. However, when teachers are trained to employ metacognitive and self-regulatory techniques within their teaching, young children in their classes demonstrate significant self-regulatory development (Biemiller & Meichenbaum, Reference Biemiller and Meichenbaum1998; Dignath et al., Reference Dignath, Buettner and Langfeldt2008; Perry, Reference Perry1998; Perry, Vandekamp, Mercer, & Nordby, Reference Perry, Vandekamp, Mercer and Nordby2002; Williams, Reference Williams2003; Withebread, Anderson et al., Reference Whitebread, Anderson, Coltman, Page, Pino Pasternak and Mehta2005; Whitebread et al., Reference Whitebread, Bingham, Grau, Pino Pasternak and Sangster2007; Whitebread & Coltman, Reference Whitebread and Coltman2010).
In a study of young children’s mathematical learning, Whitebread and Coltman (Reference Whitebread and Coltman2010) found that young children demonstrated evidence, through their talk, and their non-verbal actions, of emergent metacognitive processes, and that the nature and frequency of these processes were influenced by pedagogical aspects of the mathematical activities. In particular, pedagogical interactions which provided children in this age range with emotionally contingent support, which gave them feelings of autonomy and control, which provided them with cognitive challenges and the opportunity to articulate their thinking appeared to provoke and support metacognitive and self-regulatory behaviors.
In a recent review of the literature concerning independent learning Meyer et al. (Reference Meyer, Haywood, Sachdev and Faraday2008) pointed out that there are different terms used to refer to the conception of independent learning, including self-regulated learning’ (Schunk & Zimmerman, Reference Schunk and Zimmerman1994; Pintrich, Reference Pintrich, Boekaerts, Pintrich and Zeidner2000), ‘self-directed learning’ (Korotov, Reference Korotov1992), ‘learning to learn’ (Black, McCormick, Mary, & Pedder, Reference Black, McCormick, Mary and Pedder2006), ‘self-directed active learning’ (Birenbaum, Reference Birenbaum2002), ‘student-centered learning’ (Black, Reference Black2007), ‘self-learning’ (Mok & Chen, Reference Mok and Chen2001), ‘self-access learning’ (Chia, Reference Chia2005) and ‘supported study’ (MacBeath, Reference MacBeath1993). What is recognized across this literature, however, is that “Independent learning does not involve pupils merely working alone. Instead, the important role teachers can play in enabling and supporting independent learning is stressed.” (Meyer et al., Reference Meyer, Haywood, Sachdev and Faraday2008, p. 18).
It therefore appears that metacognitive and self-regulation abilities of young children may have been under-estimated in early studies which typically employed self-report and laboratory experimental based methodologies. Recent research has, as a consequence, developed observational methods which have revealed significant knowledge concerning the early emergence of these abilities (Veenman et al., Reference Veenman, Van Hout-Wolters and Afflerbach2006; Winne & Perry, Reference Winne, Perry, Pintrich, Boekaerts and Zeidner2000; Whitebread et al., Reference Whitebread, Bingham, Grau, Pino Pasternak and Sangster2007).
Winne and Perry (Reference Winne, Perry, Pintrich, Boekaerts and Zeidner2000) have argued that using systematic observation to measure metacognition in young children reflects what learners do rather than what they call or believe they do, allows the establishment of links between learner’s behaviors and the context of the task, especially those where feedback is available within the boundaries of a task, and can improve difficulties associated with measuring young children’s metacognition, such as positive response bias and their limited language for describing cognitive processes.
Whitebread et al. (Reference Whitebread, Almeqdad, Bryce, Demetriou, Grau, Sangster, Efklides and Misailidi2010) have suggested that, in addition, using video-recording enables the recording of verbal as well as non-verbal behaviors, and conducting these observations in naturalistic educational settings enables capturing social processes and the roles of teachers and peers involved in the development of metacognitive abilities. With regard to the teacher’s and peer’s roles, Whitebread (Reference Whitebread1999) has argued that working through collaboration allows a reduction in cognitive processing load which may enhance metacognitive activity. In reciprocal learning activities, children also need to regulate the joint representations of the task, and this encourages them to articulate their ideas to others (Iiskala, Vauras, & Lehtinen, Reference Iiskala, Vauras and Lehtinen2004).
Whitebread and his colleagues, within the Cambridgeshire Independent Learning (C.Ind.Le) project have developed the Children’s Independent Learning Development (CHILD 3–5) observational instrument which was derived from Bronson’s model (Reference Bronson2000). The CHILD was designed to enable preschool teachers to observe and rate children between the ages of 3 and 5 years on their cognitive, emotional, motivational and social self-regulation (Whitebread, Coltman, et al., Reference Whitebread, Coltman, Anderson, Mehta and Pino Pasternak2005; Whitebread et al., Reference Whitebread, Bingham, Grau, Pino Pasternak and Sangster2007; Whitebread et al., Reference Whitebread, Almeqdad, Bryce, Demetriou, Grau, Sangster, Efklides and Misailidi2010).
Previous literature has suggested that there is an impact of socio-economic status on many cognitive aspects of the child (Noble, Norman, & Farah, Reference Noble, Norman and Farah2005). For example, socio-economic status accounted for some part of the variance in childhood IQ (Gottfried, Gottfried, Bathurst, Guerin, & Parramore, Reference Gottfried, Gottfried, Bathurst, Guerin, Parramore, Bornstein and Bradley2003), cognitive stimulation (Bradley & Corwyn, Reference Bradley and Corwyn2002), executive function (Hook, Lawson, & Farah, Reference Hook, Lawson and Farah2013), support level received from parents (Black, Reference Black2007), and prevalence of behavioral problems among children (Propper & Rigg, Reference Propper and Rigg2007). Key indicators of socio-economic status are parental education, parent’s occupation, income level and family size (Ensminger & Fothergill, Reference Ensminger, Fothergill, Bornstein and Bradley2003).
Although many researchers argued for the importance impact of family resources on stimulating the child cognitive development (i.e. training programs, games, participation of sport activities, specialized educational curriculum, interactions with parents, parents attention and the use of mature language) (Benson, & Sabbagh, Reference Benson and Sabbagh2013; Hook et al., Reference Hook, Lawson and Farah2013), they explained such impact according to the concept of resource dilution, which supposes that parents have finite resources, i.e. regardless of family level of income and parental time availability, these resources would still be limited and become diluted as the number of children in the family increases (Macaulay & Ford, Reference Macaulay and Ford2013).
The average size of Jordanian family is large (5.4) (Department of Statistics, 2013) in comparison with European (2.3) (Eurostat, 2014) or American Families (2.54) (Statista, 2013), which may have a negative impact on the child cognitive aspects including independent learning, as positive correlations were found between the family size and parents’ education and IQ (Downey, Reference Downey2001).
The significance of the present study of independent learning development is threefold. First, this is the first study investigating independent learning amongst preschool children in an Arabic speaking country (i.e. Jordan). It is hoped that this may encourage Arab scholars to research this fruitful learning concept and propose instructions to enhance independent learning at this early age. Jordanian public schools have recently started Tamhedie classes for preschool children at the age of 5 years and these classes are equivalent to Kindergarten II or nursery. Second, this effort would be also highly beneficial for the purpose of validating the CHILD 3–5 observational instrument outside the EU countries (Whitebread et al., Reference Whitebread, Almeqdad, Bryce, Demetriou, Grau, Sangster, Efklides and Misailidi2010). Finally, although several studies have provided important findings about IL in children, relatively little is known about the influence of socioeconomic factors upon it. In this article, we examine IL amongst preschool children as related to family size and parental education level. On the one hand, literature reviews have documented well the relation of poverty and low socioeconomic status to a range of negative child outcomes, including low IQ, educational attainment and achievement, and social-emotional problems. Parental education is an important index of socioeconomic status, and as noted, it predicts children’s educational and behavioral outcomes (Dubow, Boxer, & Huesmann, Reference Dubow, Boxer and Huesmann2009). On the other hand, previous studies indicated that children’s family size tends to correlate negatively with measures of children’s cognitive and language development (Burchinal et al., 2002).
Student engagement level is another variable investigated in the current study, which refers to students’ attitudes towards schooling and their participation in academic and non-academic school activities (Willms, Reference Willms2003). In his review, Willms reported on many commentators’ understanding of student engagement, as to include a psychological component emphasizes students’ sense of attachment to school and being accepted and valued by their peers and others at their school, and a behavioral component emphasizes students’ class attendance, being prepared for class, completing homework, attending lessons, and being involved in extra-curricular sports. Student engagement has usually been treated as a predictor of academic performance, and seen as a temperament towards learning, working with others and functioning in a social institution, which is expressed in students’ feelings that they belong at school, and in their participation in school activities. The student engagement variable has been included in the current study to exclude aspects of students’ low motivation towards school that may affect their sense of belonging to school, and as self-regulation behaviors account for issues of motivation (Zimmerman, Reference Zimmerman, Pintrich, Boekaerts and Zeidner2000).
Hence, the current study attempts to explore the role of two categories of variables in independent learning among a sample of Jordanian preschoolers, the first category is related to child’s gender and engagement level, while the second category is related to the parental education and the family size indicating the socio-economic status.
Methodology
Participants
The sample of the study consisted of 60 preschool children (i.e. 30 boys and 30 girls), aged 5–6 years old (mean = 5.5), and were from a middle class background in Irbid province in Jordan. Ten preschool participant teachers were asked to randomly select from their classes three boys and three girls and then classify them according to the teachers’ perception of the child engagement level (High: the child perceived as to extremely engage in classroom activities including role playing, co-operative learning, counting, helping, instructing others; Intermediate: the child perceived as to reasonably engage in classroom activities including role playing, co-operative learning, counting, helping, instructing others and; Low: the child perceived as to fairly engage in classroom activities including role playing, co-operative learning, counting, helping, instructing others). According to the previous criteria of classification, the participant children were found to fall into three levels of engagement (i.e. 14 Low, 20 Intermediate and 26 High).
Instrumentation
A Jordanian version of the observational Checklist of Independent Learning Development 3–5 (CHILD 3–5) was employed to rate independent learning amongst preschoolers. This checklist was originally developed by Whitebread, Coltman, Anderson, Mehta, and Pino Pasternak, (Reference Whitebread, Coltman, Anderson, Mehta and Pino Pasternak2005), within the research project of Cambridgeshire Independent Learning (C.INd.Le.). It contained 22 statements under each of the four areas of self-regulation identified by Bronson (Reference Bronson2000): emotional, pro-social, cognitive & motivational. The observational checklist was developed based on ratings of 192 children by 32 teachers, and has shown high levels of internal consistency (α = .97) and inter-rater agreement (95.5% of ratings within one judgment category). Early indications of good cross-cultural validity of this instrument as a measure of metacognition and self-regulation in young children are also reported, and further research to refine and validate it is on-going in four European countries (Whitebread et al., Reference Whitebread, Almeqdad, Bryce, Demetriou, Grau, Sangster, Efklides and Misailidi2010). The development of this version was conducted as follows. Firstly, the items of the checklist were translated from English to Arabic. Secondly, a copy of the Arabic version was sent together with the original checklist to a specialist in both Arabic and English to achieve back translation from Arabic to English in order to assure the accuracy of the translation and the English content of the Arabic version of the checklist were evidenced. Finally, a four point Likert scale, as in the original checklist, was used for rating and measuring the children’s independent learning behaviors: always = 3, usually = 2, sometimes = 1, never = 0.
Validity and Reliability
The Jordanian version of the checklist was given to 5 experts who agreed upon the clarity of the language used and that the items involved in the checklist were appropriately valid to represent the categories incorporated. For the purpose of reliability, two means of reliability were obtained. Firstly, two teachers, who participated in the study, in prior of the actual investigation, observed 15 children whilst engaging in 5 different activities and rated them using the checklist, and an appropriate inter-raters reliability was achieved (r = .81). Secondly, internal consistency, Cronbach’s alpha, demonstrated a satisfactorily level of reliability for Total score (.98) and for each of the subcategories incorporated: Cognitive (.94), Emotional (.91), Pro-social (.92), and Motivational (.95).
A consent letter was sent to the family of students who participated in the current study alongside a short questionnaire requesting basic information regarding parental education level (i.e. at least one parent completing primary school, secondary school, community college, B.A. or M.A), and number of family members (i.e. the child, parents and siblings). In relation to student engagement level, as mentioned previously, the teachers were asked to sort the participating children into three levels (i.e. Low, Intermediate and High), according to their level of engagement in various learning situations including role playing, co-operative learning, counting, helping, instructing others, and so on.
Procedures
An initial one day meeting between the participant teachers and the research team was held to explain the study aims, and discuss the CHILD instrument scale and it’s items to ensure mutual understanding, when rating on these items, was achieved (Morgan, Reference Morgan1988; Robson, Reference Robson2002). Prior to data collection, it was agreed that each teacher would observe and rate, with the presence of a research team member, a child’s independent learning behavior against the scale items, in order to provide the teachers with appropriate feedback on their performance. When the accuracy of the teachers’ ratings was evidenced, the teachers were encouraged to start the actual ratings of the participant children’s independent learning behaviors. Each teacher observed the 6 selected pupils and rated their independent learning behaviors on the CHILD’s scales when they were engaged in various preschool curricular activities, which were derived from The National Preschool Interactive Curriculum (NPIC).
Results
The current study aimed at exploring the level of Independent Learning (IL) amongst a sample of Jordanian preschoolers in the province of Irbid, as related to variables of gender, engagement level, parental education, and the size of their families.
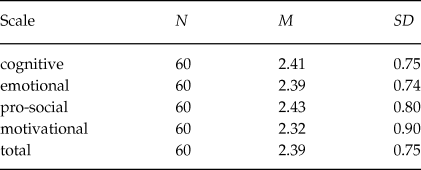
To explore IL levels, means and standard deviations of the sample’s scores on both the overall CHILD scale and on each subscale, as measured by their teachers’ ratings on the modified Jordanian version of the CHILD instrument were calculated as illustrated in Table 1.
Child scale means & standard deviations*

* theoretical mean = 1.5 (always = 3, usually = 2, sometimes = 1, never = 0).
Table 1 shows that, although means of the children’s performance in the categories of the scale were different, they were particularly close to the total mean. It also shows that all means were higher than the theoretical mean of the scale, indicating that the participant children usually (i.e. usually = 2) demonstrated independent learning behaviors in all categories. Specifically, the participant children were perceived by their teachers as generating a higher level of pro-social activities than other categories, followed by the cognitive category, whereas emotional and motivational categories were less frequently evidenced.
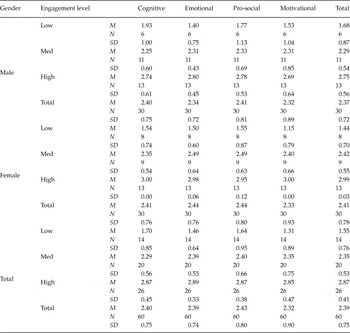
Furthermore, means and standard deviations of the sample’s scores on both Total and on each subscale according to the gender of the children and their engagement level were calculated as shown in Table 2.
Means and standard deviations of the sample’s scores on both Total and on each subscale according to gender and engagement levels

2-Way ANOVA was used to test the effect of children’s gender and engagement level on their CHILD scores. It revealed a significant effect of engagement level on IL total score F(2, 60) = 25.435, p < .001, but, no significant effect of children’s gender, nor its interaction with their engagement level.
Post hoc comparisons using the Scheffe test showed that all differences between levels of children’s engagement were significant on all categories and that scores were always higher for the group of higher engagement level.
Similar results with those on the total score were obtained in relation to the children’s IL subscales according to the variables of gender and engagement level. Particularly, results of a 2-Way MANOVA showed there were no significant differences between the levels of IL subscales due to the gender of the children or to the interaction between gender of the children and their engagement level, but there were significant differences between levels of children’s IL due to their engagement level on all subscales [Emotional F(2, 60) = 38.927, p < .001]; [Pro-social F(2, 60) = 15.394, p < .001]; [cognitive F(2, 60) = 16.804, p < .001]; [motivational F(2, 60) = 21.553, p < .001]. Post hoc comparisons using the Scheffe test also showed that all differences between levels of children’s engagement were significant on all categories and the scores were always higher for the group of higher engagement level.
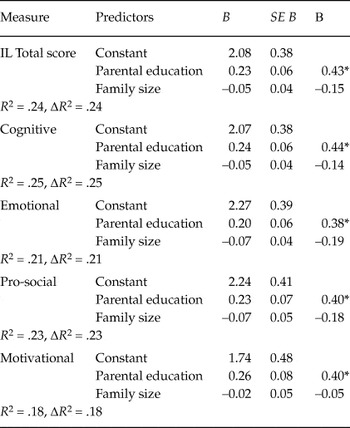
To uncover the impact of family size and participants’ parental education on children’s IL scores, five separate multiple linear regression analyses were conducted. Tests to see if the data met the assumption of collinearity indicated that multicollinearity was not a concern (family size, Tolerance = .93, VIF = 1.07; parental education, Tolerance = .93, VIF = 1.07), although a significant negative correlation between them was found (r = –.258, p < .05). Results as summarized in Table 3 indicated that participants’ parental education was a significant predictor of IL (total score, emotional, pro-social, and cognitive categories).
Models of multiple regression analyses in predicting IL total and subtotal scores

Note: *p < .05, **p < .01.
Discussion
The results of the present study corroborated many previous studies’ results indicating that metacognition may emerge implicitly very early. Results of the present study indicate that preschoolers may show some aspects of metacognitive behavior, particularly those related to pro-social and cognitive areas. These results go in line with previous research results indicating that young children are not only able to exercise executive control over their own thought processes, and that they were capable of using their speech to coordinate or regulate their own engagement in learning (Fang & Cox, Reference Fang and Cox1999), but it is also possible to foster these skills during the early years, with positive benefits for their academic self-belief and achievement (Fantuzzo et al., Reference Fantuzzo, Bulotsky-Shearer, McDermot, McWayne, Staci and Frye2007; Perry, Reference Perry1998).
Since child care centers serve a large number of children, the experience of being enrolled in a child care center has many advantages especially over the child’s social and cognitive development. Our results indicated that pro-social and cognitive aspects of metacognition were the most obvious abilities noted among preschoolers. Child care centers provide a fitting context for enriching preschool-aged children’s social and cognitive development. Research suggests that teachers’ social interactions with children in early child care environments are indeed important for children’s social outcomes (Kontos & Wilcox-Herzog, Reference Kontos and Wilcox-Herzog1997; Magno, Reference Magno2010), and that this interaction provides the child with the opportunity to reason, integrate, and consolidate knowledge about social information and norms (Nyland, Reference Nyland2004; Vygotsky, Reference Vygotsky1978). Nevertheless, pre-school children are also prone to demonstrate impulsiveness and lack of control, which makes them unable to see the clear paths in the outcome of their goal (Magno, Reference Magno2010), they are also unable to adapt a strategy to evaluate their success or failure (Dembo, Reference Dembo1994). This impulsiveness and lack of an evaluative strategy of one’s feelings and goals could be the reason why preschoolers do not demonstrate high levels of emotional and motivational aspects of their metacognitive development. Flavell (Reference Flavell1985) argued that it is not until late childhood or early adolescence that students become capable of devising a strategy to solve the problem, and evaluating their success or failure.
Children with high level of engagement in classroom activities demonstrated higher level of independent learning. It seems reasonable to suggest that engagement level by its nature overlaps with elements of independent learning covered in the CHILD, which means that both engagement level and independent learning incorporates emotional, pro-social, cognitive & motivational aspects. Willms (Reference Willms2003) pointed out that engagement in school activities associated with students’ individual characteristics that important for success in school such as, high cognitive and social abilities, high motivation, and emotional stability.
Another consistent result of this study with previous literature is that there were positive effects of parental education on children’s metacognitive abilities. In summary, it shows that there is a positive effect of parental education on children’s metacognitive abilities. Children that come from families with high education have demonstrated more metacognitive abilities than their peers from families with lower educational levels. Ruffman, Slade, and Crowe (Reference Ruffman, Slade and Crowe2002) have reported that; the educational level of the mother and her use of metacognitive dialogues had a positive influence on the children’s social outcome. Besides, the well-educated parents are more aware of the importance of participating in home-based activities with their younger children and they tend to participate in such activities (Berk, Reference Berk2012). This could be achieved through providing the children with a space of their own; to play and study. They also provide the activity materials, supervision, encouragement, and enriching the children’s experiences. All of the aforementioned factors are related to the development of children’s self-regulation and metacognition (Fitzsimmons & Bargh, Reference Fitzsimmons, Bargh, Baumeister and Vohs2004).
This result corroborates previous research literature indicating that children from socially disadvantaged backgrounds are more likely to have difficulties with attention and externalizing behavior (Entwisle, Alexander, & Olson, Reference Entwisle, Alexander and Olson2005; Miech, Essex, & Goldsmith, Reference Miech, Essex and Goldsmith2001).
Result of this study indicated that there were negative correlations between children’s metacognitive abilities and family size. Although one could not predict IL from family size, this result could indicate that children coming from large families show fewer metacognitive aspects than those coming from small ones. But since the predictor of family size correlated negatively with parental education, its effect was suppressed. This could lead to suppose that parents with higher level of education do not have large families that lack the opportunity for children to reason, integrate, and consolidate knowledge about their own learning, because these children would have less discourse with adults than they would have with other siblings, especially in families such as those in Jordan where intervals between children are typically very brief.
Evidence on socio-economic contexts suggests that infants and children from socially disadvantaged backgrounds are more likely to be exposed to multiple sources of stress, such as residential instability, psychological distress among adults, low-quality childcare settings and other factors that put children’s emotional adjustment in risk (Brooks-Gunn, Duncan, & Aber, Reference Brooks-Gunn, Duncan and Aber1997). Berk (Reference Berk2012) considered socio-economic factors such as crowded housing, children’s malnutrition, and parental education as mediating variables between family size and children’s well-being (cognitive aspects, school achievement). She argues that parents with lower intelligence test scores and poor education tend to have larger families which affect negatively on the children’s well-being and that these negative effects disappeared when children are raised by bright, stimulating, economically advantaged parents.
In sum, although some education psychologists (e.g., Flavell, Reference Flavell1985) have doubted that children develop metacognitive ability during the preschool years, the results of the present study suggest that Jordanian preschoolers do exercise executive control over their own thought processes and that they are capable of using their speech to coordinate or regulate their activities. It could be assumed that aspects of metacognition such as pro-social, cognitive, emotional and motivational can all be improved as a result of effective teaching and learning practices. It could be also concluded that young children not only are able to regulate their own engagement in learning (Perry, Reference Perry1998), but it is also possible to foster these skills during the early years, with positive benefits for their academic self-belief and achievement (Fantuzzo et al., Reference Fantuzzo, Bulotsky-Shearer, McDermot, McWayne, Staci and Frye2007), since metacognition is a key element and driver of self-regulation (Duckworth, Akerman, MacGregor, Salter, & Vorhaus, Reference Duckworth, Akerman, MacGregor, Salter and Vorhaus2009). The acquisition of these skills can have long-lasting beneficial effects.
To conclude, our results have indicated that Jordanian preschool children have similar levels of independent learning that have been demonstrated by children of other cultures, and this could emphasize the unbiased robust grounding available in the CHILD. Concurring with British findings, the findings of the current study illustrated Jordanian preschoolers at the age of five demonstrated indicators of independent learning behaviors (Whitebread, Anderson et al., Reference Whitebread, Anderson, Coltman, Page, Pino Pasternak and Mehta2005). The Arabic Jordanian version of the CHILD effectively discriminated between children who were less and more independent learning behaviors. Future studies could seek verbal or nonverbal indicators of independent learning amongst younger children than four year olds. Thus, the results of the current investigation are not definitive, but suggest that Jordanian parents, teacher and caregivers should consider that young children are eligible independent learners when they are encouraged to engage in interactive learning activities; as a result it would be beneficial for teachers to be trained how to support independent learning in preschoolers.