




1. Introduction
This paper considers the dynamical behaviour of laminar swirling jets exhausting from an annular pipe into a semi-infinite reservoir. Similar flow situations are commonplace in a variety of industrial applications, such as combustors used for power and propulsion. In such systems, the cylindrical core of the annulus serves as a bluff centrebody, forming a central flame-stabilising recirculation region that promotes mixing and deters flashback (Syred & Beér Reference Syred and Beér1974). As swirl is introduced, interactions between this centrebody wake and phenomena such as vortex breakdown can manifest a wide range of possible flow and flame topologies, often with significant impacts on the system's performance and stability (Lieuwen Reference Lieuwen2012).
The main objective of this work is to expose the state-space dynamics underlying the relationships between distinct flow morphologies in swirling and non-swirling annular jets, especially in regards to the size of the centrebody. Swirling flows in particular often exhibit extensive intervals of multistability and hysteresis (Leibovich Reference Leibovich1984; Ash & Khorrami Reference Ash and Khorrami1995), making parameter space characterisation difficult via experiments and transient simulations. With such methods, repeatability becomes a challenge unless the initial and boundary conditions are controlled carefully, and unstable connections between stable solution manifolds cannot be identified. In this regard, branch continuation methods, which form the basis of our study, offer a distinct advantage as they can control explicitly variations in the flow configuration and converge to unsteady solution manifolds (Dijkstra et al. Reference Dijkstra2014).
Much like swirling circular jets, which do not possess an inner wall, swirling annular jets feature a complex suite of physical processes that drive their underlying dynamics. In both cases, the mechanics includes prominent axial and azimuthal shear effects, centrifugal forces, and inertial waves (Gallaire & Chomaz Reference Gallaire and Chomaz2003). However, the presence of the wake region that forms behind the centrebody leads to greater complexity in the case of annular jets compared to their circular analogues. For example, even in the absence of swirl, laminar annular jets lose their axisymmetry spontaneously (Del Taglia et al. Reference Del Taglia, Blum, Gass, Ventikos and Poulikakos2004; Del Taglia, Moser & Blum Reference Del Taglia, Moser and Blum2009) and express a Bénard–von Kármán wake vortex street pattern (Ogus, Baelmans & Vanierschot Reference Ogus, Baelmans and Vanierschot2016). Spatiotemporally coherent structures resembling these laminar flow patterns are also known to persist well into the turbulent regime (Wawrzak et al. Reference Wawrzak, Boguslawski, Tyliszczak and Saczek2019; Vanierschot, Percin & van Oudheusden Reference Vanierschot, Percin and van Oudheusden2021). While a major focus of our work is dedicated to swirling jets, this paper will show that this dynamics at zero swirl is triggered by a sequence of separate Hopf bifurcations: an initial subcritical or supercritical zero-frequency Hopf bifurcation to a three-dimensional (3-D) plane-symmetric steady state, followed by subsequent unsteady Hopf bifurcations. Such bifurcations are shown to correspond to unsteady plane-symmetric vortex shedding or plane-asymmetric wake wobbling. It will also be shown that any finite amount of swirl causes the steady asymmetry to twist and precess in the azimuthal direction, leading to more elaborate space–time dynamics.
Sheen, Chen & Jeng (Reference Sheen, Chen and Jeng1996) performed one of the first studies to explore directly the dynamics of swirling annular jets by using an experimental jet configuration with inner-to-outer diameter ratio 0.48 and adjustable swirl vanes under laterally confined and unconfined conditions for laminar to transitional ( $O(10)$ to
 $O(1000)$) Reynolds numbers. Using a planar smoke visualisation technique, they identified a variety of distinct flow states that exchanged dominance as the flow rate and swirl vane angles were varied. Their main results for the unconfined case are recounted briefly here. At low swirl, they described the bluff body wake as a steady axisymmetric feature at low Reynolds numbers, which became unsteady and non-axisymmetric at higher Reynolds numbers. With increasing swirl, they observed that the unsteady and asymmetric flow patterns disappeared, leaving a steady axisymmetric annular wake vortex for all Reynolds numbers. As they increased the swirl further, the wake underwent a sequence of topological changes whereby a secondary vortex (the ‘inverted triangle zone’) located within the wake vortex along the centrebody wall and rotating in the opposite direction emerged, grew, and eventually penetrated the wake vortex, resulting in a steady axisymmetric flow without an internal stagnation point along the centreline. After this sequence, a threshold level of swirl was reached where vortex breakdown occurred downstream of the wake region, leading to the formation of an isolated recirculation ‘bubble’ on the central axis. Further increasing swirl caused this isolated recirculation zone to progress upstream towards the centrebody, until at the highest swirl levels considered, the vortex breakdown bubble and the bluff body wake merged to create a single large recirculation region attached to the centrebody. Though Sheen et al. (Reference Sheen, Chen and Jeng1996) focused primarily on quasi-laminar dynamics, it is important to note that a similar overall picture of the annular jet's evolution with swirl holds for the turbulent mean flow, as shown, for example, by Vanierschot & Van den Bulck (Reference Vanierschot and Van den Bulck2008). The same is true even at Reynolds numbers approaching
 $10^5$, as reported in the large eddy simulations of García-Villalba & Fröhlich (Reference García-Villalba and Fröhlich2006). Similar observations were also reported in a combustor nozzle by Wang, Hsieh & Yang (Reference Wang, Hsieh and Yang2005), who noted how distinct or merged recirculation zones were present, depending upon the swirl number.
One important aspect of the description by Sheen et al. (Reference Sheen, Chen and Jeng1996) is the single-valued nature of the reported swirling annular jet parameter space. However, using a stepped-conical annular nozzle with diameter ratio 0.65, Ogus et al. (Reference Ogus, Baelmans and Vanierschot2016) were able to demonstrate computationally and experimentally a steady, axisymmetric open wall jet state that occurred under laminar conditions at swirl numbers beyond those examined by Sheen et al. (Reference Sheen, Chen and Jeng1996). Furthermore, this wall jet state persisted at lower swirl numbers due to the Coandă effect, thereby demonstrating hysteresis with respect to the various wake and vortex breakdown states reported earlier. Similar bistable behaviours involving a wall jet state have also been reported for swirling annular jets in the turbulent regime (Vanierschot & Van den Bulck Reference Vanierschot and Van den Bulck2007a,Reference Vanierschot and Van den Bulckb; O'Connor & Lieuwen Reference O'Connor and Lieuwen2012; Falese, Gicquel & Poinsot Reference Falese, Gicquel and Poinsot2014). The dynamics of this wall jet state will be seen plainly in our results, and is discussed further in the context of circular jets elsewhere (Douglas, Emerson & Lieuwen Reference Douglas, Emerson and Lieuwen2021b; Douglas & Lesshafft Reference Douglas and Lesshafft2022).
In addition to their description of parameter hysteresis, Ogus et al. (Reference Ogus, Baelmans and Vanierschot2016) also gave an account of the unsteady structures that they observed as the swirl was varied. We have already mentioned their description of the wake dynamics present in the non-swirling jet. As the swirl was increased from zero, Ogus et al. (Reference Ogus, Baelmans and Vanierschot2016) described a quasi-periodic oscillation associated with regular Bénard–von Kármán-like vortex shedding and a slower precession of the asymmetric recirculation zone due to swirl. This unsteady behaviour disappeared as the swirl increased, and the flow underwent a sequence of steady topology changes similar to those reported by Sheen et al. (Reference Sheen, Chen and Jeng1996). After the swirl increased beyond the threshold for vortex breakdown, a singly azimuthally periodic ( $|m|=1$) precessing vortex core (PVC) spiral appeared. As swirl increased further, the central recirculation zone spread open, and the flow transitioned to a steady wall jet. No additional unsteady behaviour was reported, and the wall jet remained steady throughout the hysteresis region.
The fluid dynamics considered in earlier studies and explored further in this paper has significant implications for combustion systems, where this geometry is almost ubiquitous. In premixed combustion, flame shapes and locations are governed by a kinematic balance between the flow velocity and flame propagation normal to itself. Stagnation points and recirculation zones serve typically to stabilise such flames. In annular jets, flames can stabilise in either or both of the inner and outer shear layers and/or in front of the central recirculation zone (if one exists), giving rise to at least four completely different families of flame shapes (Chterev et al. Reference Chterev2014). The presence or absence of two of these four families is controlled by the presence of central stagnation zones, where the flame can stabilise aerodynamically well away from any physical hardware. Indeed, the complex nature of predicting when and where such aerodynamically stabilised flames exist was a key motivator for our interest in this geometry. This paper will show that the number and location of stagnation points in the steady flow is a strong function of the swirl ratio, centrebody diameter and Reynolds number, thereby demonstrating the significant parameter sensitivities that underlie the complex and very different observations of mean flame configurations in various combustion experiments and simulations (Wang et al. Reference Wang, Hsieh and Yang2005; Zhang et al. Reference Zhang, Shanbhogue, Shreekrishna, Lieuwen and O'Connor2011; Datta et al. Reference Datta, Gupta, Chterev, Boxx and Hemchandra2021). Furthermore, this paper will explore the birth of non-axisymmetric and unsteady flow solutions such as centrebody wake vortices and PVCs, which govern the asymmetries often observed in combustion system flames (Chterev et al. Reference Chterev2014).
The fluids community has invested significant theoretical efforts towards understanding and modelling the dynamics of many swirling flows. Though a detailed bifurcation analysis of swirling annular jets is lacking, similar analyses have been performed for several laminar swirling flow configurations, including the Grabowski–Berger vortex model (Meliga, Gallaire & Chomaz Reference Meliga, Gallaire and Chomaz2012; Pasche, Avellan & Gallaire Reference Pasche, Avellan and Gallaire2018) and swirling circular jets (Meliga & Gallaire Reference Meliga and Gallaire2011; Montagnani Reference Montagnani2018; Moise & Mathew Reference Moise and Mathew2019; Douglas et al. Reference Douglas, Emerson and Lieuwen2021b; Douglas & Lesshafft Reference Douglas and Lesshafft2022). Classical linear stability analyses of parallel swirling jets and wakes have also been performed (Loiseleux, Chomaz & Huerre Reference Loiseleux, Chomaz and Huerre1998; Loiseleux, Delbende & Huerre Reference Loiseleux, Delbende and Huerre2000). In turbulent swirling jets, linear (Oberleithner et al. Reference Oberleithner, Sieber, Nayeri, Paschereit, Petz, Hege, Noack and Wygnanski2011; Rukes, Paschereit & Oberleithner Reference Rukes, Paschereit and Oberleithner2016; Tammisola & Juniper Reference Tammisola and Juniper2016; Vanierschot et al. Reference Vanierschot, Müller, Sieber, Percin, van Oudheusden and Oberleithner2020; Douglas et al. Reference Douglas, Emerson, Hemchandra and Lieuwen2021a; Mukherjee et al. Reference Mukherjee, Muthichur, More, Gupta and Hemchandra2021) and weakly nonlinear (Manoharan et al. Reference Manoharan, Frederick, Clees, O'Connor and Hemchandra2020) mean flow stability analysis techniques have explained the so-called ‘global modes’ that seem to underlie many of the observed coherent structures (Mezić Reference Mezić2013). While several existing mean flow stability studies do consider swirling annular jets, none of the existing studies resolves the parameter space with enough detail to provide a comprehensive description of swirling annular jet behaviours. Furthermore, mean flow linear stability analysis cannot predict oscillation amplitudes, and its validity is subject to several conditions (Sipp & Lebedev Reference Sipp and Lebedev2007; Turton, Tuckerman & Barkley Reference Turton, Tuckerman and Barkley2015; Beneddine et al. Reference Beneddine, Sipp, Arnault, Dandois and Lesshafft2016; Tammisola & Juniper Reference Tammisola and Juniper2016) that may not be robust to changes in parameters. Hence, at present, such studies do not yield a holistic understanding of the global dynamics of swirling annular jets. The current study aims to fill this void by surveying exhaustively the swirling annular jet parameter space under laminar conditions. Such knowledge will also serve as a starting point from which to develop a fundamental understanding of the key physics and dynamics at play in the turbulent regime.
The remainder of this paper is organised as follows. Section 2 describes the flow configuration and solution methodology. The main results are presented in § 3, beginning with an overview of the steady flow topologies in § 3.1. A discussion of the dynamics of the non-swirling jet is given in § 3.2. Section 3.3 considers the effect of rotation on the wake behind the centrebody. Section 3.4 describes the dynamics of vortex breakdown and analyses relationships between the various flow topologies and the centrebody diameter. Section 3.5 discusses the significance of the wall jet regime and other possible implications of confinement. Finally, concluding remarks are given in § 4.
2. Problem formulation
2.1. Flow configuration
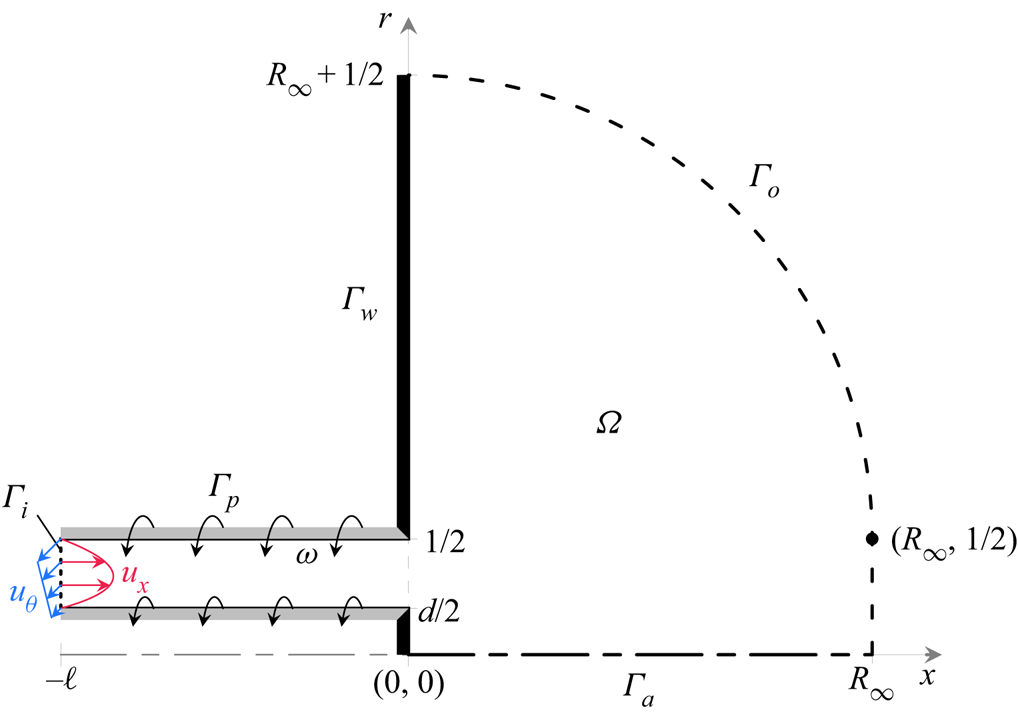
We consider the flow of an incompressible Newtonian fluid of constant density and viscosity as it passes from a long straight rotating annular pipe into a stationary semi-infinite reservoir, as shown in figure 1. Aside from the annular cross-section of the pipe, the configuration studied in this paper is essentially identical to that of our earlier investigation of circular swirling jets (Douglas et al. Reference Douglas, Emerson and Lieuwen2021b). As in that study, here we adopt a cylindrical coordinate system centred at the exit of the pipe such that  $\boldsymbol {x}=(x,r,\theta )$, and reference all quantities to the outer diameter of the pipe
 $D=2R$ and the volume-averaged velocity
 $U$ through the pipe. Using these length and velocity scales, three independent parameters are introduced that specify the system fully: the Reynolds number
 ${ {Re}}=DU/\nu$, the kinematic swirl ratio
 ${ {S}}=\omega R/U$, and the inner-to-outer diameter ratio
 ${ {d}}=D_i/D$. Here,
 $\nu >0$ is the fluid's kinematic viscosity,
 $\omega \geq 0$ is the pipe's rotation rate, and
 $0< D_i< D$ is the annulus’ inner diameter.
Schematic of the meridional plane of the axisymmetric domain  $\varOmega$ with boundary
 $\varGamma$.
The evolution of the velocity  $\boldsymbol {u}=(u_x,u_r,u_\theta )^{\mathrm {T}}$ and pressure
 $p$ within the axisymmetric domain
 $\varOmega$ is governed by the incompressible Navier–Stokes equations,
 \begin{gather} \frac{\partial\boldsymbol{u}}{\partial t}+\boldsymbol{u}\boldsymbol{\cdot}\boldsymbol{\nabla}\boldsymbol{u}={-}\boldsymbol{\nabla} p+\frac{1}{{{Re}}}\,\nabla^2\boldsymbol{u}, \end{gather}
 \begin{gather}0=\boldsymbol{\nabla}\boldsymbol{\cdot}\boldsymbol{u}. \end{gather}
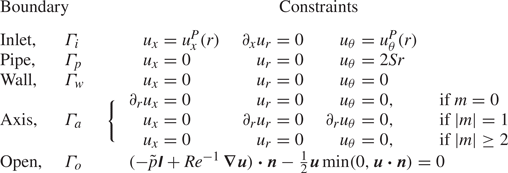
Along the domain's border  $\varGamma$, the boundary conditions listed in are enforced to model the configuration described above. On solid surfaces, no-slip conditions are enforced for all velocity components such that
 $\boldsymbol {u}=0$ on the stationary exit-plane walls
 $\varGamma _w$, and
 $(u_x,u_r,u_\theta )=(0,0,2{ {S}} r)$ on the rotating inner and outer pipe walls
 $\varGamma _p$. A steady mass flux is prescribed through the annular pipe, which is imagined to be long enough for a region of fully developed flow to exist at some
 $x=-\ell$. Then at
 $x=-\ell$, an inflow boundary
 $\varGamma _i$ is introduced where Dirichlet conditions require the distribution of axial and azimuthal velocity to match the Poiseuille solution for a rotating annular pipe, i.e.
 \begin{equation} u_x^P(r)=\frac{2 - 8r^2 - 2\log(2r)(1 - {{d}}^2)/\log({{d}})}{1 + {{d}}^2 + (1 - {{d}}^2)/\log({{d}})}\quad\text{and}\quad u_\theta^P(r)=2{{S}} r. \end{equation}
As in our previous work, a Neumann condition is enforced for the radial velocity component along  $\varGamma _i$ to promote the transparency of the inlet to upstream-propagating disturbances and more closely approximate a very long pipe (Rusak Reference Rusak1998; Douglas et al. Reference Douglas, Emerson and Lieuwen2021b). Next, 3-D symmetry conditions are enforced along the central axis
 $\varGamma _a$ to ensure continuity of disturbances across the singularity at
 $r=0$. These conditions are derived specifically for each azimuthal wavenumber
 $m$ following a Fourier expansion in
 $\theta$ (Boyd Reference Boyd2013). Finally, the unconfined flow in the reservoir is treated using the approach developed in Douglas et al. (Reference Douglas, Emerson and Lieuwen2021b). In brief, the semi-infinite reservoir is truncated to a finite characteristic radius
 $R_{\infty }$ to yield a tractable system, where ‘modified directional outflow conditions’ are enforced along
 $\varGamma _o$ to model the open flow. The main results reported in this paper were obtained with
 $\ell =4$ and
 $R_{\infty }=40$, though redundant calculations with various
 $\ell$ and
 $R_{\infty }$ values were considered throughout the analysis to ensure that the results are independent of these parameters.
List of boundary conditions.
A key objective of this formulation was to use an inflow profile that remained consistent across the span of configurations. This is accomplished using a rotating pipe, similar to the circular jet experiments of Billant, Chomaz & Huerre (Reference Billant, Chomaz and Huerre1998) and Liang & Maxworthy (Reference Liang and Maxworthy2005), and a long inlet to ensure a fully developed flow profile. Note that this approach for introducing swirl is distinct from more common means, which typically introduce swirl using a stationary apparatus such as an array of angled guide vanes (e.g. Sheen et al. Reference Sheen, Chen and Jeng1996). However, adopting such strategies links the azimuthal velocity to other flow parameters and other aspects of the configuration, leading to variations in the jet's velocity profiles as the parameters are varied. The approach taken here offers a configuration that is both feasible to replicate experimentally and described by a completely independent set of flow parameters. This issue of parameter independence is also the reason why the swirl amplitude reported in our study is quantified by the kinematic ‘swirl ratio’  ${ {S}}$ and not by the momentum flux ratio in the ‘swirl number’ of Beér & Chigier (Reference Beér and Chigier1972), which depends on both
 ${ {S}}$ and
 ${ {d}}$, as well as the resulting pressure field (Vignat, Durox & Candel Reference Vignat, Durox and Candel2022).
Finally, it should be pointed out that (2.2a,b) are well-defined for  $0<{ {d}}<1$ but become singular at the extreme values
 ${ {d}}=0$ and
 ${ {d}}=1$. In the case of
 ${ {d}}=0$, the singularity distinguishes the annular configuration from the distinct case of a circular jet studied in Douglas et al. (Reference Douglas, Emerson and Lieuwen2021b). Physically, the presence of an inner no-slip wall for any arbitrarily small
 ${ {d}}>0$ always implies the existence of a stagnation point along the axis. Likewise, the singularity at
 ${ {d}}=1$ is associated physically with a complete blockage of the inlet pipe, resulting in a trivial configuration with no incoming flow. Both of these singular situations are excluded from this study by limiting the considered range of centrebody diameters to the well-defined interval.
2.2. Discretisation
In order to solve (2.1), the strong statement outlined above is reformulated as a variational problem. Thus, as in Douglas et al. (Reference Douglas, Emerson and Lieuwen2021b), we seek the appropriate spaces  $\boldsymbol {q}=(\boldsymbol {u},p,p_o)^{\mathrm {T}}$ such that for all test functions
 $\check {\boldsymbol {q}}=(\check {\boldsymbol {u}},\check {p},\check {p}_o)^{\mathrm {T}}$,
 $$\begin{align} &\left\langle r\check{\boldsymbol{u}},\frac{\partial\boldsymbol{u}}{\partial t}+\boldsymbol{u}\boldsymbol{\cdot}\boldsymbol{\nabla}\boldsymbol{u}\right\rangle_{\varOmega}+\left\langle\boldsymbol{\nabla}(r\check{\boldsymbol{u}}),-p\boldsymbol{\mathsf{I}}+\frac{1}{{{Re}}}\,\boldsymbol{\nabla}\boldsymbol{u}\right\rangle_{\varOmega}+\left\langle \check{p},\boldsymbol{\nabla}\boldsymbol{\cdot}\boldsymbol{u}\right\rangle_{\varOmega}\nonumber\\ &\quad +\left\langle r\check{\boldsymbol{u}},p_o\boldsymbol{n}-\frac{1}{2}\boldsymbol{u}\min(0,\boldsymbol{u}\boldsymbol{\cdot}\boldsymbol{n})\right\rangle_{\varGamma_o}+\left\langle \check{p}_o,\boldsymbol{\nabla} p_o\boldsymbol{\cdot}\boldsymbol{t}-\frac{u_\theta^2}{r}\right\rangle_{\varGamma_o}=0, \end{align}$$
where  $\langle \bullet,\bullet \rangle _\varOmega$ is the standard spatial inner product. Superficially, (2.3) is indistinguishable from the weak form in Douglas et al. (Reference Douglas, Emerson and Lieuwen2021b). However, the present work introduces one crucial but subtle distinction related to the discretisation that was necessary to ensure continuous dependence of the problem on the parameter
 ${ {d}}$.
The primary spatial discretisation consists of a Delaunay triangulation of the meridional plane constructed using the finite-element mesh generator Gmsh (Geuzaine & Remacle Reference Geuzaine and Remacle2009) and a Fourier decomposition along the azimuthal direction. Instead of using many different meshes characterised by different values of  ${ {d}}$, in this paper, we define generic
 ${ {d}}$-independent meshes over the meridional plane in terms of
 $x$ and a new computational coordinate
 $\eta$ related to
 $r$ through
 ${ {d}}$. This coordinate is defined such that
 $\eta =1/2$ at
 $r={ {d}}/2$, and
 $\eta =1$ at
 $r=1/2$, yielding
 \begin{equation} r=\begin{cases} {{d}}\eta, & \eta<\frac{1}{2},\\ (1 - {{d}})\eta+{{d}}-\frac{1}{2}, & \frac{1}{2}\leq\eta\leq1,\\ \eta-\frac{1}{2}, & \eta>1. \end{cases} \end{equation}
Consequently, the incorporation of (2.4) into (2.3) imbues the system with a continuous dependence on  ${ {d}}$ through the conversion between computational
 $\eta$ and physical
 $r$ coordinates. The main triangulation for
 $\varOmega$ in these coordinates features
 $134\,270$ elements and is defined with
 $\ell =4$ and
 $R_{\infty }=40$. Key calculations were also repeated on other meshes to ensure grid convergence with respect to the mesh density and the chosen values of
 $\ell$ and
 $R_{\infty }$. Finally, the weak formulation of (2.3) is projected onto the basis of Taylor–Hood
 $(\mathbb {P}_2\times \mathbb {P}_1)$ finite elements associated with the mesh using FreeFEM (Hecht Reference Hecht2012), resulting in discrete flow states with
 $945\,999$ total degrees of freedom per Fourier component for the primary mesh. In addition, some calculations were performed on tetrahedral meshes with approximately one million elements to determine the stability of the 3-D steady states in § 3.2 using the implementation of Moulin, Jolivet & Marquet (Reference Moulin, Jolivet and Marquet2019).
2.3. Solution methodology
The numerical methods leveraged in this work are nearly identical to those of Douglas et al. (Reference Douglas, Emerson and Lieuwen2021b), which are recalled briefly here for completeness. Adopting the state-space form of (2.1), the system is rewritten as
 \begin{equation} \mathcal{M}({{d}})\,\frac{\partial\boldsymbol{q}}{\partial t}+\mathcal{R}(\boldsymbol{q};{{Re}},{{S}},{{d}})=0, \end{equation}
where  $\mathcal {M}$ and
 $\mathcal {R}$ are the respective mass matrix and residual operators, and
 ${ {Re}}$,
 ${ {S}}$ and
 ${ {d}}$ are parameters. Following a parallel discretisation and abstraction in FreeFEM, the linear algebra associated with (2.5) is handled in a distributed manner using PETSc (Balay et al. Reference Balay2021) or SLEPc (Hernandez, Roman & Vidal Reference Hernandez, Roman and Vidal2005), with factorisations from MUMPS (Amestoy et al. Reference Amestoy, Duff, Koster and L'Excellent2001).
Within this framework, axisymmetric equilibrium solutions represent steady states  $\boldsymbol {q}_0$ that satisfy
 \begin{equation} \mathcal{R}_{0}(\boldsymbol{q}_0;{{Re}},{{S}},{{d}})=0, \end{equation}
where the 0 subscript indicates the restriction of a 3-D quantity to its axisymmetric Fourier component. To identify simple fixed points, a straightforward Newton scheme is sufficient to solve (2.6) for fixed parameter values. However, the configuration examined in this paper features multi-valuedness for a significant range of parameters, making this elementary approach ill-suited for parameter continuation. Instead, the adaptive predictor–corrector scheme from Douglas et al. (Reference Douglas, Emerson and Lieuwen2021b) – which consists of a tangent predictor with a variable step length and an iterative Moore–Penrose corrector – is used to trace efficiently and robustly solution branches to (2.6) along a parameter.
The stability of the axisymmetric steady states defined by (2.6) is determined based on the time-asymptotic evolution of infinitesimal disturbances  $\acute {\boldsymbol {q}}_m$ to the equilibrium. Such disturbances can be expanded as a superposition of normal modes
 $\hat {\boldsymbol {q}}_m$ associated with azimuthal wavenumber
 $m$, growth rate
 $\sigma$, and frequency
 $f$ according to
 \begin{equation} \acute{\boldsymbol{q}}(x,r,\theta,t)\propto\hat{\boldsymbol{q}}_m(x,r) \exp\left({\mathrm{i}m\theta+\left(\sigma+\mathrm{i}2{\rm \pi} f\right)t}\right)+\hat{\boldsymbol{q}}_{m}^*(x,r) \exp\left({-\mathrm{i}m\theta+\left(\sigma-\mathrm{i}2{\rm \pi} f\right)t}\right), \end{equation}
where  $(\bullet )^*$ denotes complex conjugation. Thus the time-asymptotic linear stability characteristics of any
 $\boldsymbol {q}_0$ can be deduced from the spectrum of the generalised eigenvalue problem
 \begin{equation} \lambda\mathcal{M}\hat{\boldsymbol{q}}_m+\mathcal{J}_{m}(\boldsymbol{q}_0)\,\hat{\boldsymbol{q}}_m=0, \end{equation}
where  $\lambda =\sigma +\mathrm {i}2{\rm \pi} f$ is the eigenvalue, and
 $\mathcal {J}_m$ is the Jacobian operator defined in Douglas et al. (Reference Douglas, Emerson and Lieuwen2021b). Hence bifurcation points are identified as those states that satisfy both (2.6) and (2.8) with
 $\sigma =0$. These bifurcation points can then be traced along their corresponding neutral curves using the two-parameter predictor–corrector schemes for bifurcations detailed in Douglas et al. (Reference Douglas, Emerson and Lieuwen2021b).
Finally, the periodic solutions that emerge from Hopf bifurcations identified by stability analysis can be traced along their solution branches using the harmonic balance method. This method expands the periodic solutions as  $N$th-order temporal–azimuthal Fourier series, yielding
 \begin{equation} \boldsymbol{q}(x,r,\theta,t)=\bar{\boldsymbol{q}}_0(x,r)\!+\!\sum_{j=1}^{N}\left[\hat{\boldsymbol{q}}_{jm}(x,r) \exp({\mathrm{i}jm\theta\!+\!\mathrm{i}2j{\rm \pi} ft})\!+\!\hat{\boldsymbol{q}}_{jm}^*(x,r) \exp({-\mathrm{i}jm\theta\!-\!\mathrm{i}2j{\rm \pi} ft})\right]\!, \end{equation}
where  $\bar {\boldsymbol {q}}_0$ represents the time–azimuthal mean flow, and the
 $\hat {\boldsymbol {q}}_{jm}$ represent the various harmonic components. Hence these periodic solutions represent equilibrium solutions when
 $f=0$, and limit cycles when
 $f\neq 0$. Substituting (2.9) into (2.5), and expanding the result in Fourier space, yields the following system of coupled nonlinear equations describing each component of the Fourier expansion:
 \begin{gather} \mathcal{R}_0\left(\bar{\boldsymbol{q}}_0\right)+\sum_{j=1}^{N}\mathcal{H}_{0}\left(\hat{\boldsymbol{q}}_{jm}^*\right)\hat{\boldsymbol{q}}_{jm}=0, \end{gather}
 \begin{gather}\frac{1}{2}\sum_{j=1}^{k-1}\mathcal{H}_{km}\left(\hat{\boldsymbol{q}}_{(k-j)m}\right)\hat{\boldsymbol{q}}_{jm}+\mathcal{L}_{km}\left(\bar{\boldsymbol{q}}_0,kf\right)\hat{\boldsymbol{q}}_{km}+\sum_{j=k+1}^{N}\mathcal{H}_{km}\left(\hat{\boldsymbol{q}}_{(j-k)m}^*\right)\hat{\boldsymbol{q}}_{jm}=0, \end{gather}
 \begin{gather}\sum_{j=1}^Nj\left(\hat{\boldsymbol{q}}_{jm}^{{H}}\mathcal{M}\hat{\boldsymbol{q}}_{jm}^*-\hat{\boldsymbol{q}}_{jm}^{\mathrm{T}}\mathcal{M}\hat{\boldsymbol{q}}_{jm}\right)=0, \end{gather}
where  $\mathcal {H}_m$ and
 $\mathcal {L}_{m}$ are, respectively, the Hessian and linearised Navier–Stokes operators defined in our prior work, and (2.10c) is the integral phase condition used to define uniquely the frequency (Kuznetsov Reference Kuznetsov1998). The solution processes for (2.10) are analogous to those used for (2.5); further numerical details are available in Douglas et al. (Reference Douglas, Emerson and Lieuwen2021b).
3. Results and discussion
3.1. Overview of the steady flow topologies
As discussed in the Introduction, the various physical processes involved in swirling jet mechanics tend to manifest an intricate state space underlying a wide range of distinct flow topologies. Therefore, before delving into the particular details of each of flow regime in the following sections, this section presents briefly the basic flow topologies of annular swirling jets. To this end, we consider a case where  ${ {d}}=0.5$ and
 ${ {Re}}=100$ via numerical continuation along
 ${ {S}}$. This particular value of
 ${ {d}}$ was selected to enable direct comparisons with the results of Sheen et al. (Reference Sheen, Chen and Jeng1996), and the value of the Reynolds number was chosen as it is sufficiently low such that no unsteady solutions are identified for any
 ${ {S}}$, yet sufficiently high that an interesting sequence of distinct axisymmetric steady states exists. A qualitatively similar evolution with
 ${ {S}}$ of the steady flow topology occurs at other
 ${ {Re}}$ and
 ${ {d}}$ values. The results of this analysis are presented in the bifurcation diagrams and flow visualisations of figure 2. There,
 $\min u_x(x,0)$ denotes the minimum axial velocity along the central axis. This quantity is extracted from each steady state, allowing any solutions exhibiting central recirculation features to be identified easily as those satisfying
 $\min u_x(x,0)<0$.
Dynamics of the swirling annular jet at  ${ {Re}}=100$ and
 ${ {d}}=0.5$. (a)
 ${ {S}}$–
 $\min u_x(x,0)$ bifurcation diagram. Solid curves indicate stable nodes, while the dashed curve indicates an unstable saddle. (b) Contour plot showing the evolution of
 $u_x(x,0)$ as a function of
 ${ {S}}$. Here, the black curves indicate on-axis stagnation points. (c) Flow visualisations from points indicated on (a,b) illustrating how the steady flow topology evolves under varying
 ${ {S}}$. The flow visualisations show coloured contours of the axial velocity and axisymmetric streamline projections over
 $(x,r)\in [-0.5,2.5]\times [0,1.5]$. Black curves are used to indicate stagnation streamlines.
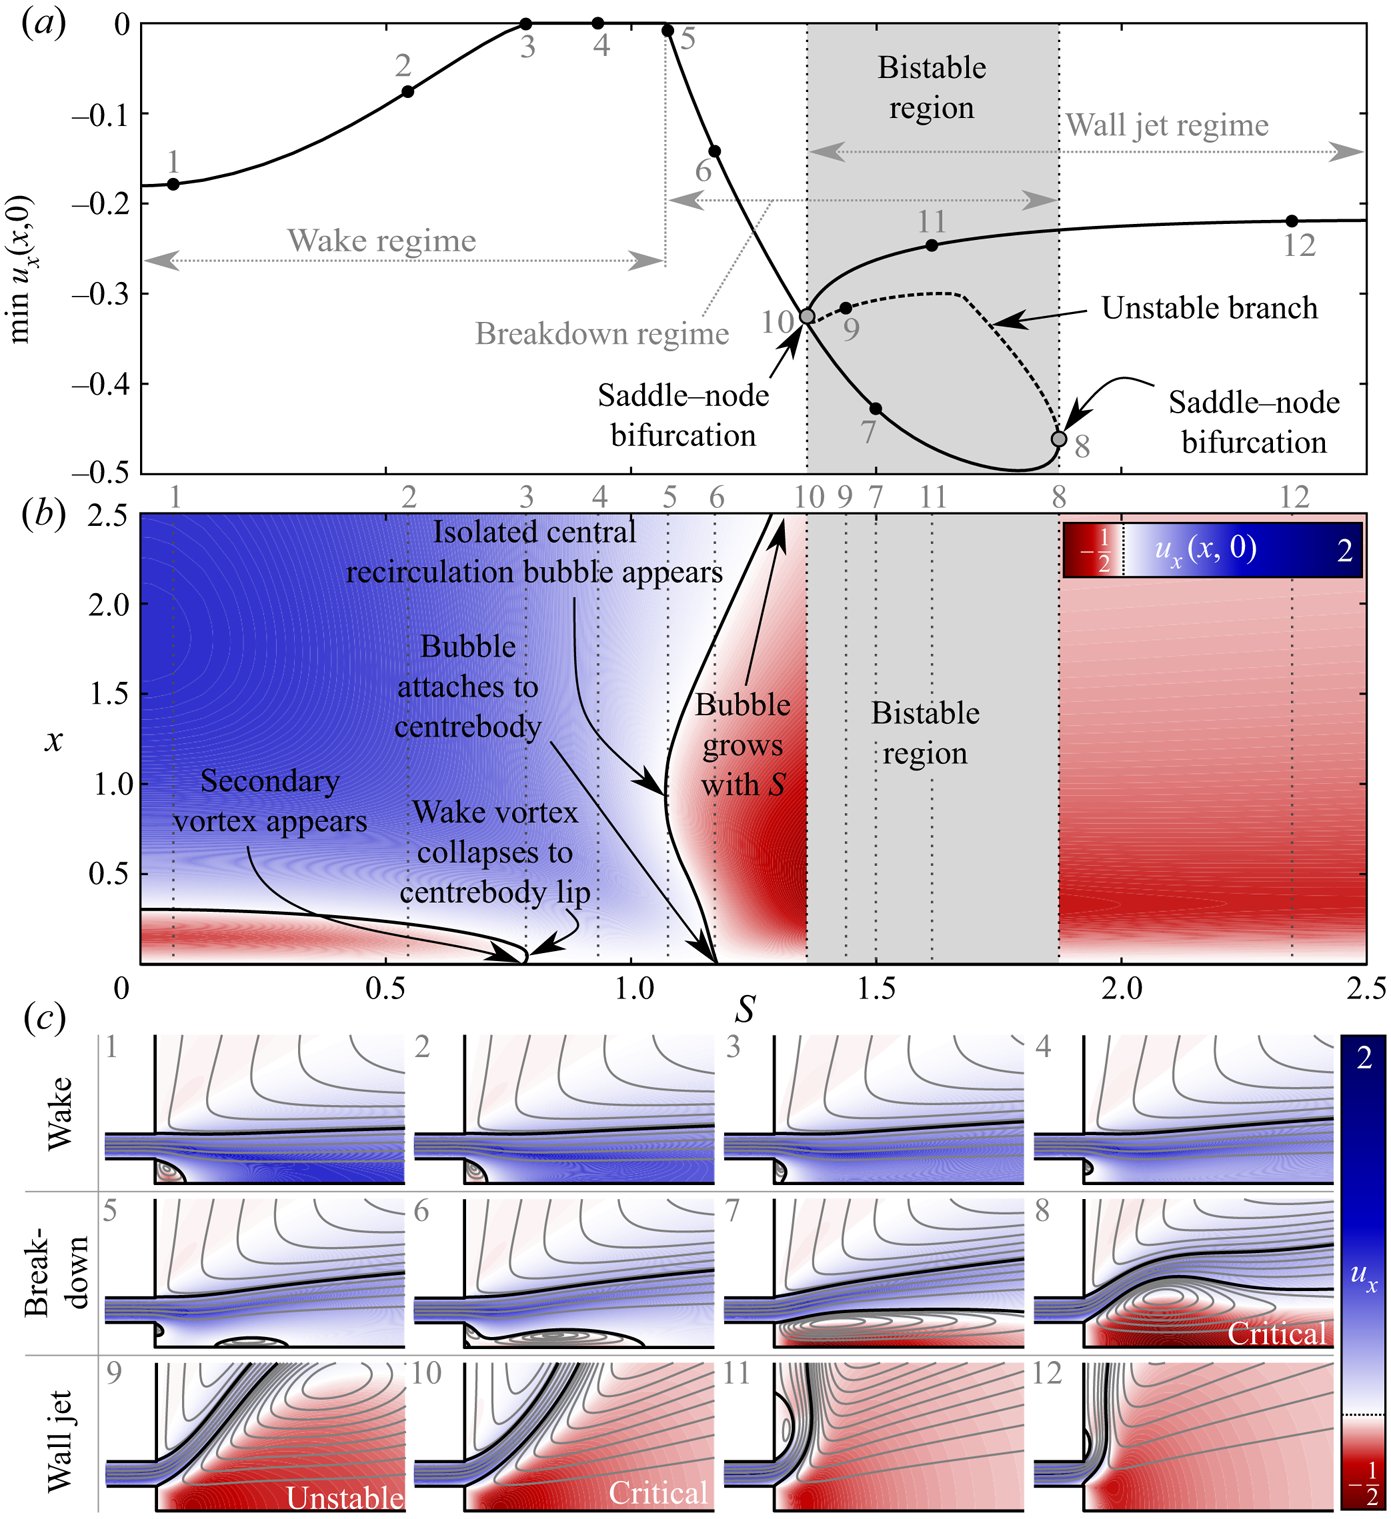
Based on figure 2, we classify the annular jet flow at  ${ {d}}=0.5$ and
 ${ {Re}}=100$ into three main flow regimes, which typically also occur at other
 ${ {Re}}$ and
 ${ {d}}$ values. First is the wake regime, which occurs at relatively low
 ${ {S}}$ values. In the wake regime, the primary flow feature is a small central recirculation vortex immediately beyond the expansion (see figure 2(c) subpanels 1 and 2) caused by the momentum deficit behind the centrebody. As the rotation rate increases in the wake regime, the extent of this recirculation zone decreases (figure 2(c) subpanel 3) until a small counter-rotating vortex forms along the centrebody wall. Eventually, this secondary vortex penetrates the main wake vortex, causing the recirculation zone to recede to a narrow toroid along the centrebody lip such that the axial flow along the centreline is non-negative (figure 2(c) subpanel 4). The mechanics of this collapse is consistent with the description by Sheen et al. (Reference Sheen, Chen and Jeng1996) reviewed in the Introduction, which they referred to as the ‘penetration’ of the ‘inverted triangle region’.
Further increase in swirl leads to the formation of a new momentum deficit downstream of the expansion due to the vortex breakdown phenomenon. The beginning of the second regime, termed the breakdown regime, is demarcated by the point where this momentum deficit is sufficient to trigger a flow reversal along the centreline (figure 2(c) subpanel 5). Once vortex breakdown occurs, the new isolated central recirculation zone enlarges rapidly with increasing swirl until it collides and merges with the lip vortex (figure 2(c) subpanel 6). The newly merged recirculation zone continues to grow in size as swirl increases (figure 2(c) subpanel 7) until eventually it reaches a crisis (figure 2(c) subpanel 8) where the recirculation bubble can no longer grow continuously with increasing  ${ {S}}$. At this point, the solution manifold experiences a saddle–node bifurcation beyond which the bubble grows tremendously with decreasing
 ${ {S}}$ along an unstable solution branch (figure 2(c) subpanel 9). The mechanism behind this dynamics is identical to that in swirling circular jets (Douglas et al. Reference Douglas, Emerson and Lieuwen2021b). It is driven by a nonlinear exchange of dominance between the central low-pressure region associated with the vortex breakdown recirculation zone and the outer low-pressure region associated with restricted entrainment of the ambient fluid near the wall as the bubble expands (i.e. the Coandă effect). It should be noted that this dynamics is affected strongly by the particular geometry of our configuration and, in particular, the presence of the flush wall along
 $x=0$ (Douglas & Lesshafft Reference Douglas and Lesshafft2022).
Once another saddle–node bifurcation signals that this nonlinear transition is complete (figure 2(c) subpanel 10), the flow enters the third regime. Here, a Coandă-type attachment of the jet occurs along the outer wall, resulting in a wall jet configuration similar to that observed by Ogus et al. (Reference Ogus, Baelmans and Vanierschot2016). As  ${ {S}}$ increases further from this point, the strength of the outer separation vortex intensifies, reducing the size of the separation zone and causing the flow to cling ever more closely to the outer wall (figure 2(c) subpanels 11 and 12). No additional flow states were identified within the range of rotation rates investigated (up to
 ${ {S}}=6$).
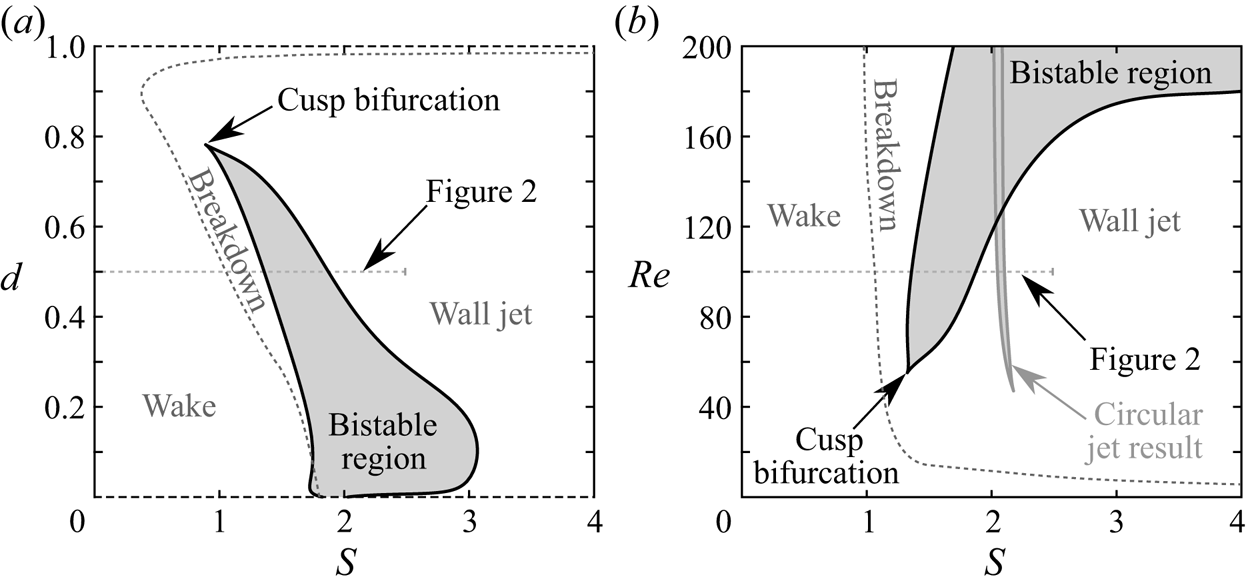
In closing this subsection, it is important to emphasise that the specific  ${ {S}}$ values associated with the various transitions in steady-state flow topology are strongly dependent on the other parameters. This will be discussed further in § 3.4. It should also be noted that the interval of bistability for the circular jet (
 $2.05\leq { {S}}\leq 2.10$) given by Douglas et al. (Reference Douglas, Emerson and Lieuwen2021b) does not approximate the corresponding bistable interval for the annular jet even at small
 ${ {d}}$ (investigated here down to
 ${ {d}}=10^{-4}$). This is attributed to the aforementioned singularity at
 ${ {d}}=0$ associated with the incongruity of a no-slip surface along a one-dimensional centrebody. The effects of the centrebody diameter and Reynolds number are summarised in the regime diagrams of figure 3. Most of the observed trends can be understood quite well based on physical intuition. For example, conservation of angular momentum ensures that jets with large centrebodies are endowed with more azimuthal momentum at a given rotation rate than jets with a lower value of
 ${ {d}}$, which tends to shift the various transitions to lower
 ${ {S}}$ values at higher
 ${ {d}}$. Similarly, higher Reynolds numbers result in less viscous entrainment of ambient fluid into the jet, causing the swirl to dissipate more gradually as the jet evolves axially. This reduced entrainment at higher
 ${ {Re}}$ also stalls the transition to the wall jet regime to higher values of
 ${ {S}}$. Finally, note the significant sensitivity of the jet's centreline stagnation behaviour with respect to
 ${ {S}}$ as the flow transitions between regimes (see figure 2b). This sensitivity of the number and location of the stagnation points has significant implications on the potential flame shapes in combustor flow fields with annular swirling jets.
Regime diagrams for the swirling annular jet, characterising the steady solutions present (a) in the  ${ {S}}$–
 ${ {d}}$ plane at
 ${ {Re}}=100$, and (b) in the
 ${ {S}}$–
 ${ {Re}}$ plane at
 ${ {d}}=0.5$. In (b), the grey curve indicates the bistable region for a circular swirling jet (Douglas et al. Reference Douglas, Emerson and Lieuwen2021b). Note that unsteady solutions are present within the range of
 ${ {Re}}$ shown, as discussed further below.
3.2. Symmetry breaking in the non-swirling jet
Our analysis proceeds with an investigation of the flow behaviour before the introduction of swirl. With  ${ {S}}=0$, the governing system and boundary conditions are symmetric under rotation and/or reflection in both
 $\theta$ and
 $t$. Thus for sufficiently low Reynolds numbers, linearity ensures that the velocity field inherits these symmetries for any value of
 ${ {d}}$, resulting in steady states that are both two-dimensional axisymmetric (2-DA) and 3-D plane-symmetric (3-DPS). For such flows, disturbances with positive and negative
 $m$ are degenerate, leading to non-rotating interference patterns (Long & Petersen Reference Long and Petersen1992). Because of this degeneracy, the signs of
 $m$ and
 $f$ are unimportant, and we will refer to
 $|m|$ and
 $|\,f|$ throughout this subsection.
Using the branch continuation and stability analysis techniques outlined in § 2.3, the elementary 2-DA/3-DPS steady solutions that appear in the low- ${ {Re}}$ limit are traced along
 ${ {Re}}$ and
 ${ {d}}$ to explore how the system bifurcates into more complex flow patterns. A stability map, a bifurcation diagram, and flow visualisations that characterise the non-swirling annular jet's incipient dynamics are presented in figure 4. In the bifurcation diagram, the evolution of the velocity fields is monitored through the maximum of the transverse velocity across the centreline,
 $\max |u_r(x,0)|$, since
 $|u_r(x,0)|>0$ for any
 $x$ indicates a violation of axisymmetry.
(a) Stability map in the  ${ {Re}}$–
 ${ {d}}$ plane and plot of critical frequency along the leading Hopf curves. (b) A
 $\max |u_r(x,0)|$ bifurcation diagram. (c) Flow visualisations from the indicated points illustrating the dynamics of the non-swirling annular jet. Planar visualisations show contours of axial velocity and streamline projections for the unstable 2-DA steady state in the meridional plane, and for the unstable 3-DPS steady state within and orthogonal to the plane of symmetry, as well as in an axial plane at
 $x=0.35$. The 3-D visualisations show yellow and black axial velocity isocontours from each branch of oscillatory Hopf bifurcations at a single instance of phase overlaid upon the symmetry plane from the 3-DPS steady state.
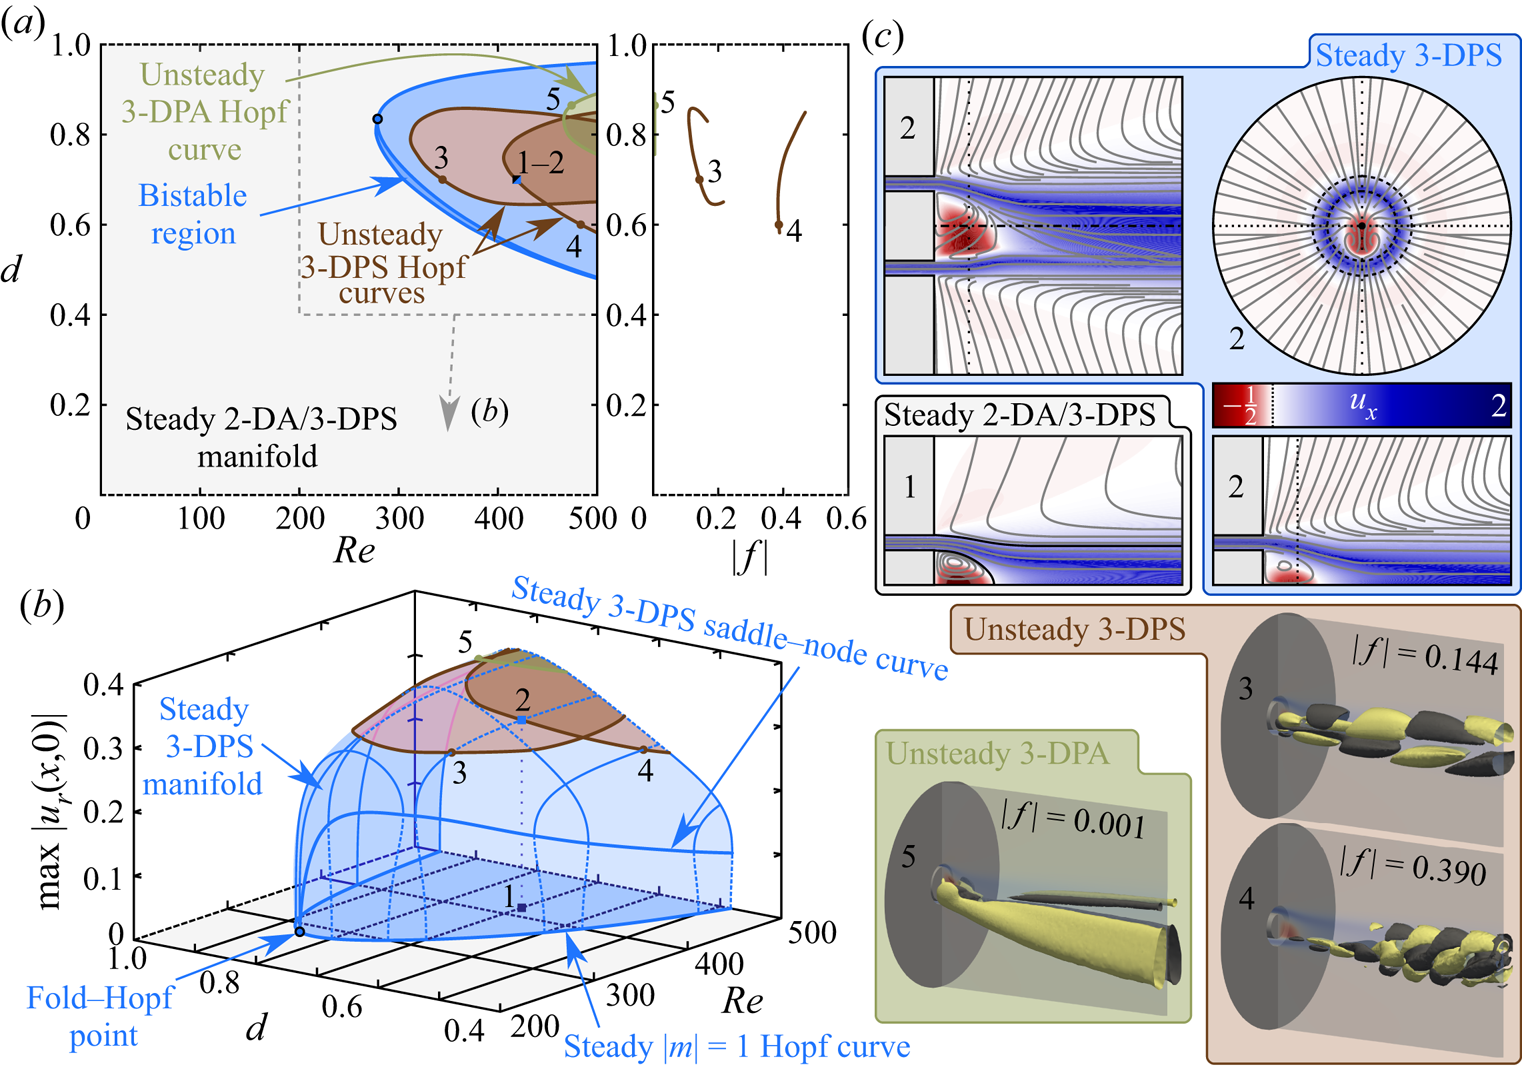
The results of figure 4 indicate that the steady 2-DA/3-DPS non-swirling annular jet bifurcates to non-axisymmetric, 3-DPS steady states beyond a certain critical Reynolds number that depends on  ${ {d}}$. This breaking of axisymmetry is triggered by a non-oscillatory (
 $|\,f|=0$)
 $|m|=1$ Hopf bifurcation (i.e. a pitchfork bifurcation with continuous rotational symmetry) that is either subcritical or supercritical in nature, for lower and higher values of
 ${ {d}}$, respectively. The interface between the subcritical and supercritical bifurcations occurs where the steady 3-DPS saddle–node curve intersects the steady
 $|m|=1$ Hopf curve at a codimension-2 fold–Hopf bifurcation point, as indicated in figure 4(b). Hence the region between this 3-DPS saddle–node curve and the steady axisymmetry-breaking Hopf bifurcation curve for
 ${ {d}}\lesssim 0.84$ yields an interval of bistability between the stable 2-DA/3-DPS and 3-DPS steady states, allowing hysteresis. Visualisations of the steady 2-DA/3-DPS flow and the steady 3-DPS flow are shown in figure 4(c) subpanels 1 and 2 at the point
 $({ {Re}},{ {d}})=(420,0.7)$.
As mentioned in the Introduction, the loss of axisymmetry in non-swirling annular jet flows is a known phenomenon (Del Taglia et al. Reference Del Taglia, Blum, Gass, Ventikos and Poulikakos2004, Reference Del Taglia, Moser and Blum2009; Vanierschot et al. Reference Vanierschot, Van Dyck, Sas and Van den Bulck2014). Nonetheless, the detailed dynamics revealed by our bifurcation analysis leads to new insights. First, the identified subcritical bifurcation behaviour in this flow for  ${ {d}}<0.84$ is a new result. This dynamics indicates a strong sensitivity of the flow to initial conditions and parameter fluctuations in the bistable region. Second, in comparison to the observations of Del Taglia et al. (Reference Del Taglia, Moser and Blum2009), the neutral curve associated with the loss of axisymmetry in our results is located over a nearly identical range of Reynolds numbers but across a wider span of centrebody diameters. We expect that this discrepancy may be attributed primarily to the lack of an inlet pipe in their configuration, which prevented their jet from developing any non-axisymmetry upstream of the dump plane.
At  ${ {Re}}$ values immediately beyond the axisymmetry-breaking bifurcation, the 3-DPS steady solution manifold is linearly stable. However, the steady 3-DPS solution manifold loses its stability at higher
 ${ {Re}}$ values through oscillatory Hopf bifurcations as the degree of non-axisymmetry grows. As shown in figures 4(a,b), three neutral curves exist on this steady manifold that each give rise to instability modes with distinct frequencies and spatial structures. Two of these bifurcations are associated with 3-DPS structures, corresponding to unsteady Bénard–von Kármán-type vortex shedding behaviours. The main distinction between these 3-DPS modes is their frequency. The slower oscillation has Strouhal numbers
 $0.1\lesssim |\,f|\lesssim 0.2$, while the faster mode reaches
 $0.4\lesssim |\,f|\lesssim 0.5$. The slower mode is visualised in figure 4(c) subpanel 3 and supplementary movie 1 (available at https://doi.org/10.1017/jfm.2022.453) at the point
 $({ {Re}},{ {d}})=(344,0.7)$, and the faster mode is shown in figure 4(c) subpanel 4 and supplementary movie 2 at
 $({ {Re}},{ {d}})=(483,0.6)$. The remaining instability is associated with 3-D plane-asymmetric (3-DPA) streamwise streak structures that correspond to a gentle side-to-side ‘wobbling’ of the wake asymmetry. This mode is nearly static, with Strouhal number
 $|\,f|\sim 0.001$. It is visualised in figure 4(c) subpanel 5 and supplementary movie 3 at
 $({ {Re}},{ {d}})=(475,0.87)$. Note that each of these bifurcations corresponds to a primary instability of the steady 3-DPS flow for some part of the parameter space.
The instabilities described in the previous paragraph provide new insight into several earlier results.
First, the structure and frequency of the slower 3-DPS instability characterised in our results match closely with the  $|\,f|=0.187$ vortex shedding mode found in the laminar
 ${ {d}}=0.65$ jet studied by Ogus et al. (Reference Ogus, Baelmans and Vanierschot2016). Our results indicate that this particular instability is not universally dominant in non-swirling annular jets, and appears only as the primary instability over a range of centrebody diameters from
 $0.65\lesssim { {d}}\lesssim 0.85$ for
 ${ {Re}}\leq 500$. Below
 ${ {d}}\sim 0.65$, the primary instability is the higher-frequency 3-DPS vortex shedding mode, while for
 ${ {d}}\geq 0.85$, the primary instability is the 3-DPA wobble mode. It should be emphasised here, however, that these neutral curves overlap at high
 ${ {Re}}$ values and are not mutually exclusive. It is likely that combinations of these basic instability modes and others will promote more complex interactions and time-aperiodic temporal dynamics as
 ${ {Re}}$ increases. As an example of this, we consider the strong similarities between the instability modes identified in our laminar study and the coherent turbulent structures observed by Vanierschot et al. (Reference Vanierschot, Percin and van Oudheusden2021). Using a proper orthogonal decomposition of their time-resolved experimental data, those authors identified three dominant coherent oscillations that mirror closely the space–time behaviour of each instability mode identified in our study. This suggests that the dominant coherent dynamics is driven by the same physical mechanisms across a broad range of Reynolds numbers, and motivates further studies in the transitional regime.
Second, it is interesting to speculate to possible connections between the elongated streak structures associated with the self-excited 3-DPA instability in annular jets and the streak structures that are known to be temporally stable but strongly spatially amplified in round jets (Nogueira et al. Reference Nogueira, Cavalieri, Jordan and Jaunet2019; Pickering et al. Reference Pickering, Rigas, Nogueira, Cavalieri, Schmidt and Colonius2020; Wang et al. Reference Wang, Lesshafft, Cavalieri and Jordan2021). It seems plausible that the recirculation zone in the centrebody wake could provide an avenue for intrinsic feedback within the lift-up mechanism that could destabilise such structures. Nevertheless, more work would certainly be necessary to evaluate this hypothesis.
Finally, it should be remarked that all of the bifurcations described in this subsection are influenced strongly by the physics of the centrebody wake, and have no analogues in circular jets (Douglas et al. Reference Douglas, Emerson and Lieuwen2021b). They do, however, possess clear similarities to the bifurcations of axisymmetric wake flows (Tomboulides & Orszag Reference Tomboulides and Orszag2000; Fabre, Auguste & Magnaudet Reference Fabre, Auguste and Magnaudet2008; Bohorquez et al. Reference Bohorquez, Sanmiguel-Rojas, Sevilla, Jiménez-González and Martínez-Bazán2011; Rigas, Esclapez & Magri Reference Rigas, Esclapez and Magri2016). The onset of unsteadiness in both cases involves an initial steady break of axisymmetry followed by subsequent instabilities of a steady 3-D solution manifold. Hence oscillatory linear instability arises from a 3-D state rather than an axisymmetric one. To illustrate this point better, we have performed stability calculations on the axisymmetric manifold beyond the leading neutral curve associated with the steady loss of axisymmetry. For the unstable steady axisymmetric flow, the minimum Reynolds number associated with an oscillatory instability is  ${ {Re}}=574$, where an
 $|m|=1$ Hopf bifurcation associated with vortex shedding at
 $|\,f|=0.325$ occurs at
 ${ {d}}=0.68$. Nonetheless, this instability is of limited physical significance as neither its critical parameter values nor its frequency are representative of the actual instabilities stemming from the 3-DPS state. This has important implications towards modelling and controlling non-swirling annular jet flows, as the instability characteristics of the axisymmetric steady state do not reflect those of the true 3-D flow.
3.3. Effect of low rotation rates on wake asymmetry
Though the system and boundary conditions remain 2-DA with  ${ {S}}\neq 0$ at low
 ${ {Re}}$, introducing any finite amount of rotation to the pipe immediately destroys the system's 3-DPS property. Hence for
 ${ {S}}\neq 0$, disturbances with positive and negative
 $m$ are no longer degenerate, leading to 3-D structures that generally rotate in time. (Note that in systems not exhibiting such exact temporal–azimuthal symmetries as ours, it is possible for robust non-axisymmetric steady or time-averaged solutions to arise at non-zero swirl; Pacheco, Lopez & Marques Reference Pacheco, Lopez and Marques2011.) In this work, as in Douglas et al. (Reference Douglas, Emerson and Lieuwen2021b), we have restricted our analysis to
 ${ {S}}\geq 0$ and
 $m\leq 0$ without loss of generality such that the sign of
 $f$ determines whether a non-axisymmetric disturbance co-rotates (
 $f>0$) or counter-rotates (
 $\,f<0$) along
 $\theta$. Nevertheless, all results will be reported in terms of
 $|m|$ to avoid confusion with other studies, which sometimes use the sign of
 $m$ to distinguish among disturbances with different rotation directions.
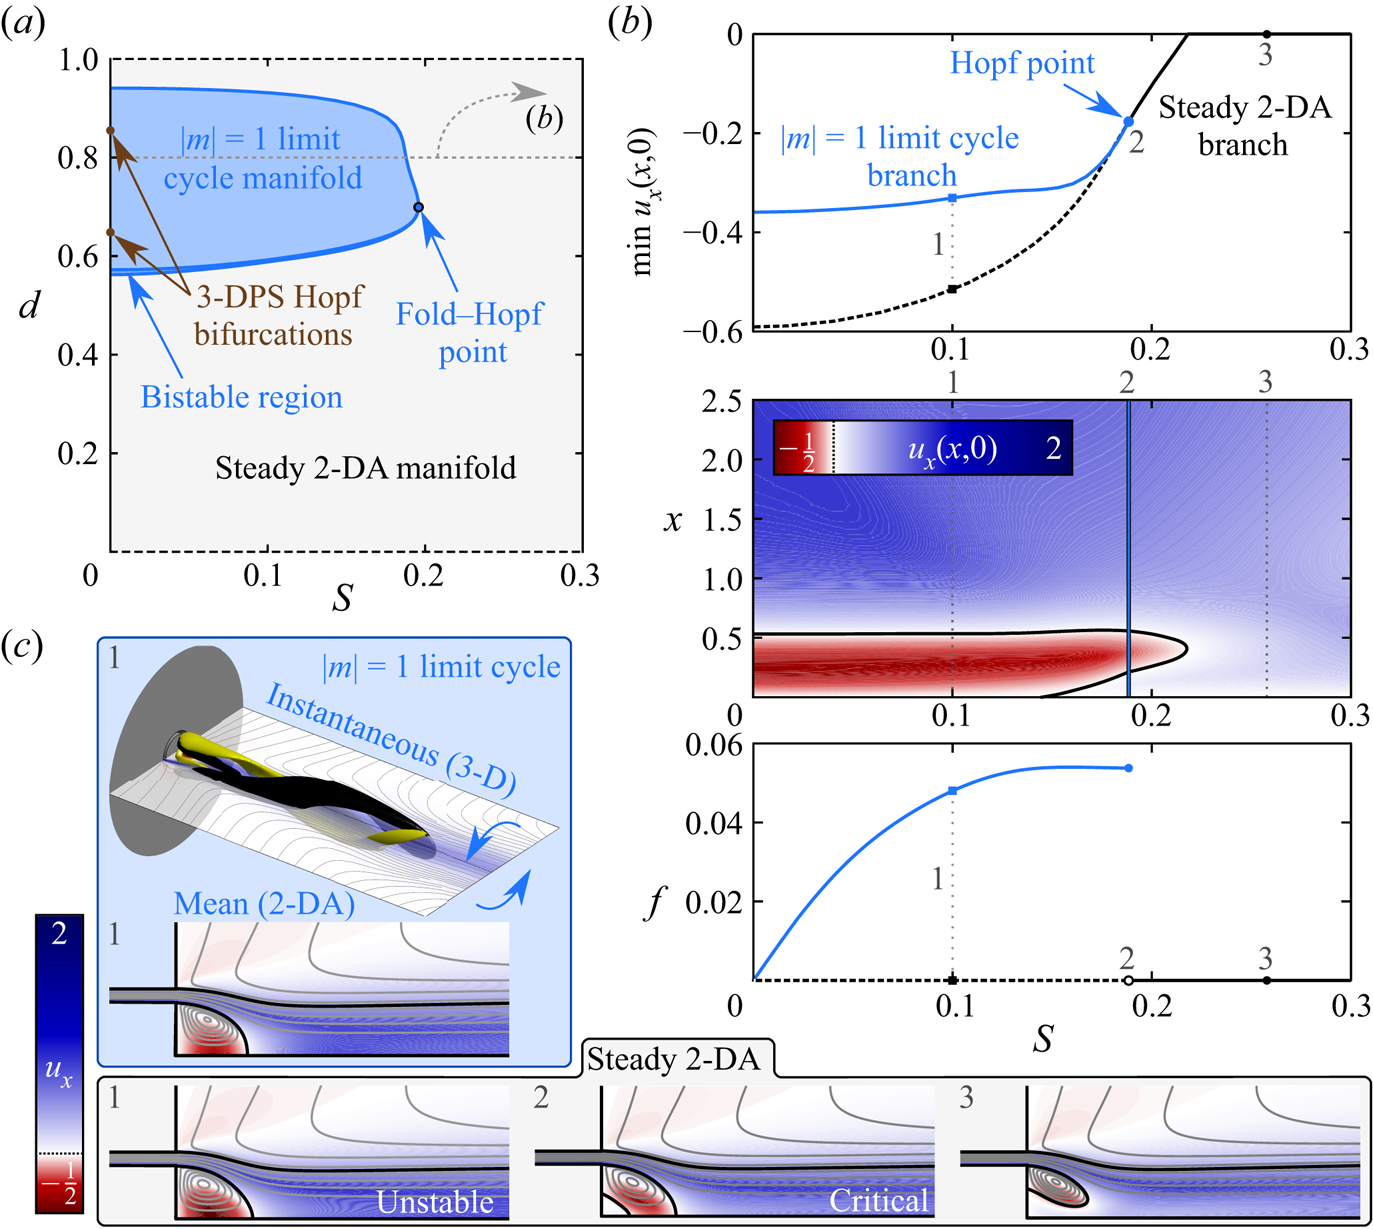
The stability map of figure 5(a) illustrates the effect of weak swirl for a range of  ${ {d}}$ and
 ${ {S}}\leq 0.3$ with the Reynolds number fixed at
 ${ {Re}}=400$. It also shows that the subcritical and bistable behaviour described above for the non-swirling jet at certain
 ${ {d}}$ values persists for non-zero
 ${ {S}}$. Taking the case of
 ${ {d}}=0.8$ as a representative example, figure 5(b) demonstrates how the steady 3-DPS solution from the non-swirling case inherits
 $f>0$ for any
 ${ {S}}>0$, manifesting a co-rotating
 $|m|=1$ limit cycle manifold. Flow visualisations provided in figure 5(c) subpanel 1 and supplementary movie 4 further reveal how the spatial structure of these limit cycle oscillations follows from a swirl-induced twisting of the steady 3-DPS structure from the non-swirling case. The end result is a co-rotating
 $|m|=1$ spiral structure that winds about the central axis in the direction opposing the pipe's rotation as the jet proceeds axially. Nonetheless, the amplitude of this limit cycle decays with increasing
 ${ {S}}$ as the structure of the wake recirculation region changes. The upward trend of
 $\min u_x(x,0)$ in figure 5(b) indicates that the reversed axial flow in the centrebody wake region diminishes with increasing swirl. As this wake recirculation weakens, the amplitude of the
 $|m|=1$ limit cycle decays until eventually the flow becomes unable to sustain the wake asymmetry. At this point, depicted in figure 5(c) subpanel 2, the system bifurcates to a stable 2-DA steady state. With further increase in
 ${ {S}}$, the secondary ‘inverted triangle zone’ vortex apparent in figure 5(c) subpanel 2 ‘penetrates’ through the primary wake vortex to yield the topology shown in figure 5(c) subpanel 3. This evolution of the time-mean and steady flow fields with increasing
 ${ {S}}$ occurs in a manner consistent with the description in § 3.1 and earlier reports (Sheen et al. Reference Sheen, Chen and Jeng1996; Ogus et al. Reference Ogus, Baelmans and Vanierschot2016).
Characterisation of the weakly swirling jet at  ${ {Re}}=400$. (a) Stability map in the
 ${ {S}}$–
 ${ {d}}$ plane. (b) Results for the case
 ${ {d}}=0.8$ with varying
 ${ {S}}$, showing a bifurcation diagram for
 $\min u_x(x,0)$, a contour plot for
 $u_x(x,0)$ of the steady and periodic solutions, and a bifurcation diagram for
 $f$. (c) Flow visualisations at
 ${ {d}}=0.8$ and three points in
 ${ {S}}$ showing meridional axial velocity contours and streamline projections for
 $(x,r)\in [-0.5,2.5]\times [0,1]$ of the 2-DA states derived from the mean component of the
 $|m|=1$ limit cycle and the steady 2-DA solutions. A 3-D visualisation of the instantaneous flow on the
 $|m|=1$ limit cycle at
 ${ {S}}=0.1$ is also shown, using a meridional slice plane and yellow and black isocontours of
 $\acute {u}_x=\pm 0.1$ for
 $(x,r,\theta )\in [-1,9]\times [0,2.5]\times [0,2{\rm \pi} ]$.
It is interesting to note that the behaviour of the co-rotating, counter-winding  $|m|=1$ limit cycle described above and in figure 5 bears a striking resemblance to the observations of Vanierschot et al. (Reference Vanierschot, Van Dyck, Sas and Van den Bulck2014) in turbulent jets. This similarity suggests that the breaking of planar symmetry caused by non-zero swirl and the subsequent weakening of the wake recirculation zone with increasing swirl are both significant dynamical effects that control the jet's coherent structures even at much higher Reynolds numbers. Hence it is plausible that low swirl could be used to manipulate the dominant frequencies present in annular jet applications.
Here, we should point out that the techniques used in our study characterise explicitly only steady and time-periodic solutions. Nonetheless, our results can be extended straightforwardly to more complex dynamics and bifurcations using the continuous parameter dependence and symmetry of (2.3). For example, the Hopf bifurcations of the 3-DPS steady state associated with 3-DPS vortex shedding at  ${ {S}}=0$ (indicated in figure 5 and detailed in figure 4) must correspond to Neimark–Sacker bifurcations of the co-rotating
 $|m|=1$ limit cycle state for
 ${ {S}}>0$ due to the destruction of the 3-DPS symmetry under finite
 ${ {S}}$. Such dynamics indicate the existence of quasi-periodic solution manifolds (i.e. limit tori) within the weakly swirling annular jet state space composed of ‘fast’ vortex shedding and ‘slow’ wake precession motions, consistent with the observations of Ogus et al. (Reference Ogus, Baelmans and Vanierschot2016). Furthermore, at
 $({ {Re}},{ {d}})$-values where at least two modes are unstable for
 ${ {S}}=0$, the slow precession that appears for
 ${ {S}}>0$ may manifest a strange attractor with chaotic dynamics via a Ruelle–Takens–Newhouse scenario (Eckmann Reference Eckmann1981).
It will be shown in the next subsection that sufficiently strong rotation promotes flow instability. Yet, based on the above results, weaker rotation levels may be viewed to have a stabilising effect from the perspective of the annular jet's intrinsic dynamics. It is worth mentioning, however, that a non-modal perspective towards flow instability may lead to a very different conclusion. Indeed, we did find ‘arc branches’ of slightly damped eigenvalues (Garnaud et al. Reference Garnaud, Lesshafft, Schmid and Huerre2013; Coenen et al. Reference Coenen, Lesshafft, Garnaud and Sevilla2017) throughout the wake regime, and weakly swirling jets are well known to amplify transiently very small extrinsic perturbations through pseudo-resonance in a manner that is not captured directly by the normal modes approach used in this study (Schmid Reference Schmid2007). For example, Montagnani & Auteri (Reference Montagnani and Auteri2019) considered weakly swirling co-axial jets (which do not have a centrebody wake) with underdeveloped velocity profiles at Reynolds numbers similar to those studied here, and showed that the optimal degree of non-modal amplification grows monotonically with swirl under the conditions that they investigated. They also showed that tremendous algebraic growth of small transient perturbations can give rise to nonlinear interactions that are sufficient to sustain oscillations and/or turbulence. Nonetheless, as their transition was triggered by extrinsic forcing, such dynamics may not be accessible to the purely self-excited system considered in our investigation. The least stable subcritical eigenvalue branches in our study suggest a preference of the steady flow towards non-modal amplification of counter-rotating  $|m|=1$ and
 $|m|=2$ disturbances, with lower
 ${ {S}}$ conditions favouring
 $|m|=1$ growth. However, non-modal analysis would be necessary to confirm this.
3.4. Influence of centrebody size on vortex breakdown and precession
As the rate of rotation increases beyond the relatively small values considered above, eventually vortex breakdown and flow instability begin to play prominent roles in the jet's dynamics. The basic mechanics of this process for the steady solutions has already been discussed in § 3.1. However, at higher Reynolds numbers, this steady dynamics is complicated by the emergence of unsteady behaviours that will be the main focus of this subsection. The present discussion will highlight the effects of varying  ${ {d}}$ and
 ${ {S}}$ at a fixed Reynolds number
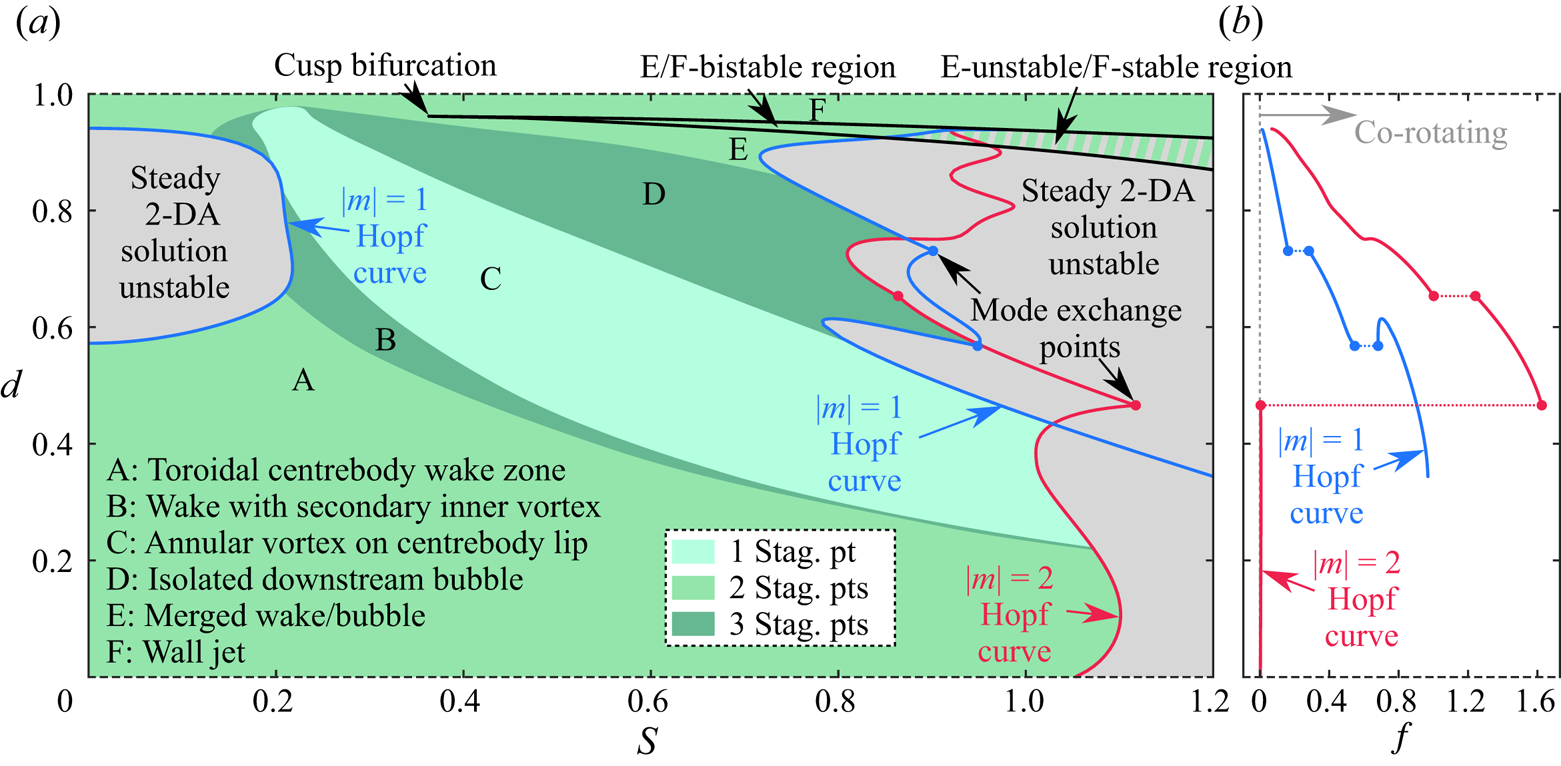
 ${ {Re}}=400$. A stability map and flow regime diagram that summarise the topology (shading) and stability limits (lines) of the 2-DA steady flow at
 ${ {Re}}=400$ are shown in figure 6.
Summary of the dynamics of the steady annular swirling jet at  ${ {Re}}=400$. (a) Stability map and flow regime diagram. (b) Plot of critical frequency along the primary
 $|m|=1$ and
 $|m|=2$ Hopf curves shown in (a). In (a), the bistable region associated with the transition between breakdown and wall jet solutions is demarcated by the black curve. The neutral curves corresponding to Hopf bifurcations associated with
 $|m|=2$ or
 $|m|=1$ structures are indicated by the solid red and blue curves. The regions where a 2-DA solution is linearly unstable are shaded grey, while the green regions indicate stable 2-DA solutions. The shading of these green regions denotes the number of stagnation points present along the centreline, which is used to classify the steady flow topology into six categories.
We begin with a brief discussion of the 2-DA steady flow topologies, and their evolution with varying  ${ {S}}$ and
 ${ {d}}$. Figure 6(a) shows that the evolution of the flow topology with
 ${ {S}}$ described by Sheen et al. (Reference Sheen, Chen and Jeng1996) and detailed in figure 2 is typical of other centrebody sizes and higher Reynolds numbers. As the rotation rate and/or the centrebody diameter change, the flow progresses through this sequence of states in a manner that can be distinguished precisely by the number of stagnation points identified on the flow centreline. As noted earlier, unlike the circular jet, the presence of the centrebody in the annular jet ensures that at least one stagnation point is always present on the centreline. Nonetheless, the presence of the centrebody wake (regime A, e.g. figure 2(c) subpanel 1), the formation of the ‘inverted triangle region’ (regime B, e.g. figure 5(c) subpanel 2), the ‘penetration’ of the inverted triangle region (regime C, e.g. figure 5(c) subpanel 3), and the formation and attachment of the vortex breakdown recirculation zone (regimes D and E, e.g. figure 2(c) subpanels 5 and 7, respectively) all introduce or eliminate stagnation points, as reflected in figure 6(a). With the exception of the bistability between the merged vortex breakdown state and the wall jet state (regime F, e.g. figure 2(c) subpanels 7 and 11, respectively), the steady 2-DA solution manifold for the swirling annular jet is single-valued, and there is no parameter overlap among these distinct steady states. Furthermore, aside from the change between regimes E and F, the transitions among these steady flow patterns are not associated with bifurcations. It will be shown below that this single-valuedness does not carry over into the unsteady regime, and that some of the steady states do experience multi-valuedness with unsteady solutions.
As was mentioned in § 2.1, the presence of the centrebody introduces a no-slip condition that distinguishes the annular jet from a circular jet even at very small values of  ${ {d}}$. Such configurations are realised practically in applications where the centrebody tapers gradually to a point (as in Ko & Chan Reference Ko and Chan1979, for example). Nonetheless, when the centrebody is sufficiently small, viscous effects dissipate quickly the central momentum deficit, and the centrebody wake plays very little role in the jet's instability behaviour. As a result, we find that the jet's unsteady dynamics is dominated by instabilities of the outer shear layer that behave very similarly to the case of a circular jet for a range of
 ${ {d}}$ dependent on the Reynolds number and the nature of the instability. Thus for annular jets at
 ${ {Re}}=400$ where the centrebody diameter lies within the range
 $0<{ {d}}\lesssim 0.4$, the primary instability occurs in the wake regime via a slowly co-rotating
 $|m|=2$ mode, as shown in figure 6. The resulting periodic orbit emerges via a subcritical Hopf bifurcation to a limit cycle associated with a slowly co-rotating
 $|m|=2$ spiral structure that also appears in the quasi-columnar regime of circular swirling jets (Billant et al. Reference Billant, Chomaz and Huerre1998; Douglas et al. Reference Douglas, Emerson and Lieuwen2021b) and is driven by azimuthal shear along the outer shear layer (Gallaire & Chomaz Reference Gallaire and Chomaz2003). Apart from this leading
 $|m|=2$ instability, the steady jet also experiences instability towards a counter-rotating
 $|m|=1$ mode, co-rotating
 $|m|=3$ modes, and other
 $|m|=2$ modes at
 ${ {S}}$ values beyond the range shown here, in a manner consistent with the description in our earlier paper. Generally, these instabilities exhibit large spatial amplification over an extended axial span, and structural sensitivity analysis shows that they are not strongly influenced by the flow structure in the interior of the jet. Thus for small
 ${ {d}}$, the annular swirling jet becomes unsteady and non-axisymmetric at
 ${ {S}}$ values before any central momentum deficit forms, and therefore does not experience vortex breakdown via a steady or axisymmetric process. Instead, the transition to vortex breakdown likely involves several competing solution manifolds (which need not be steady or periodic), with the selection of any particular attractor being dependent on the specific initial conditions. Because of the similarity of the unsteady dynamics between the small
 ${ {d}}$ annular jet in the wake regime and the circular jet in the quasi-columnar regime, we will move on to situations where the effect of the centrebody-driven inner shear layer is more prominent. The reader is referred to Douglas et al. (Reference Douglas, Emerson and Lieuwen2021b) for further details of these outer shear layer dynamics, though we must again emphasise the fundamental difference between a small-
 ${ {d}}$ annular jet and a circular jet.
At intermediate  ${ {d}}$ values, figure 6 indicates that a neutral curve associated with an
 $|m|=1$ instability crosses over the critical
 $|m|=2$ curve at
 ${ {d}}\sim 0.45$ to become the primary instability mode. The diagram reveals that just prior to criticality, the steady flow exists in the wake regime with a steady flow topology analogous to that of figure 5(c) subpanel 3. Thus the emergence of the
 $|m|=1$ instability appears prior to the emergence of the vortex breakdown recirculation bubble for
 $0.45\lesssim { {d}}\lesssim 0.6$. This indicates that the annular swirling jet at
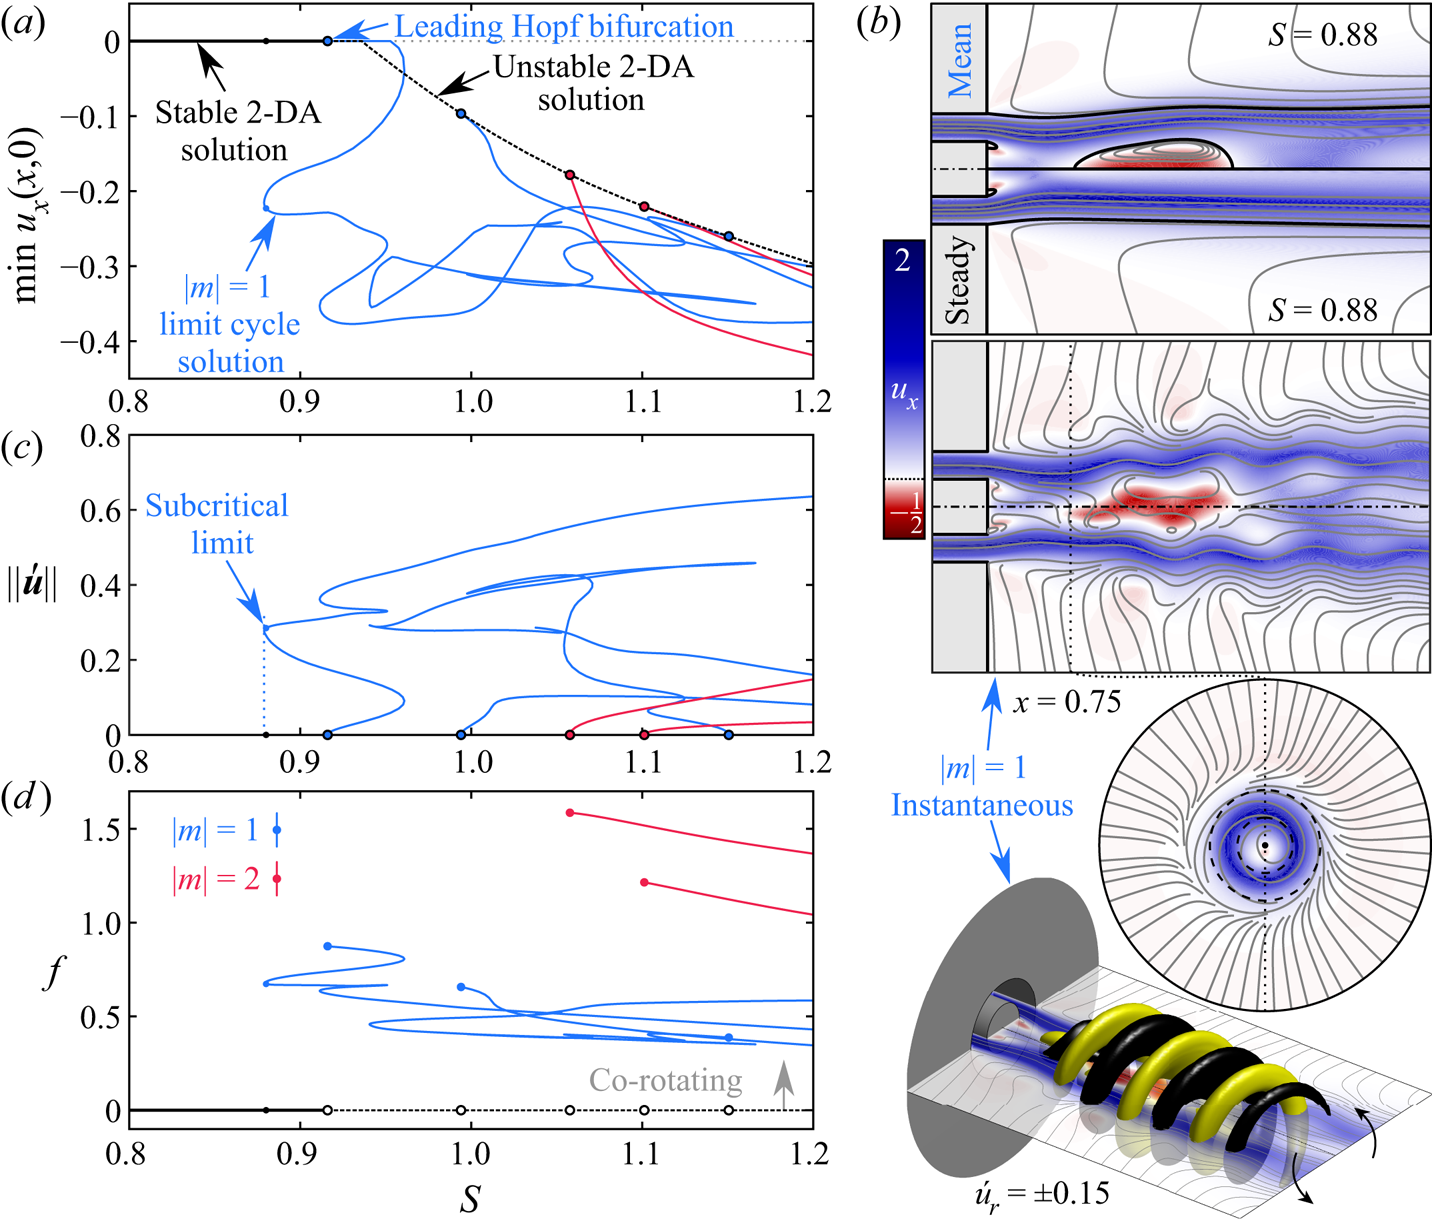
 ${ {Re}}=400$ follows an unsteady non-axisymmetric route to vortex breakdown for this range of centrebody diameters, and similar results were found for lower Reynolds numbers. An example of the resulting dynamics at
 ${ {d}}=0.5$ is considered in the bifurcation diagrams and flow visualisations of figure 7 and in supplementary movie 5. Among the bifurcation diagrams, figure 7 shows the amplitude of the limit cycle solutions as measured using the unsteady energy norm,
 $\|\acute {\boldsymbol {u}}\|=\|\boldsymbol {u}-\bar {\boldsymbol {u}}\|$. This spatially integrated quantity includes all contributions from the oscillation's fundamental and harmonic tones over all space.
(a,c,d) Bifurcation diagrams illustrating the dynamics of the vortex breakdown process at  $({ {Re}},{ {d}})=(400,0.5)$, and (b) flow visualisations of the
 $|m|=1$ PVC solution at the indicated point (
 ${ {S}}=0.88$). The bifurcation diagrams show the minimum velocity along the centreline, the limit cycle amplitude, and the oscillation frequency against
 ${ {S}}$. Visualisations consist of a comparison of the axisymmetric steady and mean flow fields in the meridional plane, as well as a snapshot of the instantaneous flow from the
 $|m|=1$ limit cycle via planar and 3-D representations. Planar graphics show contours of the axial velocity and with projected streamlines, while the 3-D graphic includes a yellow/black isocontour representation of the radial velocity fluctuations at
 $\acute {u}_r=\pm 0.15$. The black dotted line shows the intersection of the axial and meridional planes.
For the case  ${ {Re}}=400$ and
 ${ {d}}=0.5$, figure 7 shows that the base flow becomes unstable with respect to several distinct
 $|m|=1$ and
 $|m|=2$ disturbances as
 ${ {S}}$ increases. These dynamics are led by the emergence of an
 $|m|=1$ limit cycle, which bifurcates from the steady 2-DA flow before the steady 2-DA flow begins to express a central vortex breakdown recirculation zone. As this limit cycle's amplitude increases, nonlinear interactions between its mean and fluctuating components eventually begin to aid the deficit of momentum along the centreline more than a corresponding increase in
 ${ {S}}$, leading to subcritical behaviour. The resulting oscillation consists of a co-rotating, counter-winding
 $|m|=1$ PVC structure that exhibits a significant interval of multi-valuedness between itself and the steady 2-DA solution. This therefore represents a marked departure from an interpretation common to many existing studies of swirling flows. Such studies have typically adopted a linear framework for analysing flow oscillations and have focused mostly on simple swirling flow models like the Grabowski–Berger vortex. In such works, the formation of the vortex breakdown recirculation zone via an axisymmetric, steady or quasi-steady process is typically regarded as a prerequisite for unsteady vortex breakdown (Escudier, Bornstein & Maxworthy Reference Escudier, Bornstein and Maxworthy1982; Ruith et al. Reference Ruith, Chen, Meiburg and Maxworthy2003; Herrada & Fernandez-Feria Reference Herrada and Fernandez-Feria2006; Meliga et al. Reference Meliga, Gallaire and Chomaz2012). Instead, our results demonstrate that the nonlinear Reynolds stresses induced by finite-amplitude oscillations can yield a time-averaged breakdown zone and instantaneous PVC at parameter values where vortex breakdown does not occur for the steady flow. This indicates an alternative subcritical route to unsteady vortex breakdown that exists in addition to the supercritical route associated with a simultaneous emergence of the central recirculation zone and PVC oscillations (Manoharan et al. Reference Manoharan, Frederick, Clees, O'Connor and Hemchandra2020).
At higher  ${ {d}}$ values along the boundary of regions C and D in figure 6(a), the vortex breakdown recirculation zone forms in a steady manner as an isolated axisymmetric bubble downstream of the centrebody. It is only after the rotation increases well beyond the point where the internal stagnation point forms initially that self-excited flow instabilities become relevant to the overall dynamics. The primary unsteady dynamics subsequent to vortex breakdown includes co-rotating, counter-winding structures with
 $|m|=1$ or
 $|m|=2$ spatial patterns depending on the specific
 ${ {d}}$ and
 ${ {Re}}$ values. Much like the intermediate-
 ${ {d}}$ case considered just above, the limit cycle solutions that emerge from these Hopf bifurcations may arise in either a subcritical or supercritical manner depending on the specific flow circumstances at the considered parameter values. Finally, it is interesting to note from figure 6(b) that the frequencies associated with the unsteady
 $|m|=1$ and
 $|m|=2$ solutions in this regime tend to decrease with increasing
 ${ {d}}$ along the critical curves, with relatively little effect from the variations in
 ${ {S}}$.
It is interesting to compare the results described above with existing works in the annular swirling jet literature that have considered the influence of the centrebody diameter. For example, in the turbulent regime, Mukherjee et al. (Reference Mukherjee, Muthichur, More, Gupta and Hemchandra2021) and Gupta et al. (Reference Gupta, Shanbhogue, Shimura, Ghoniem and Hemchandra2021) have both suggested that PVC oscillation amplitudes may be diminished by increasing the centrebody diameter in order to merge the bubble and wake recirculation zones. This is akin to shifting the operating regime from a D- to E-type solution in figure 7. As pointed out by a referee, however, our results suggest the opposite effect, as increasing  ${ {d}}$ near
 ${ {S}}=0.8$ is associated with the destabilisation of an
 $|m|=1$ structure near the D/E transition. Even so, there are several plausible explanations for this potential discrepancy between our laminar results and the turbulent results cited above. These include effects related to configurational differences such as the swirl generation mechanism (rotating walls versus static vanes), jet profile (parabolic versus top-hat), or nozzle injection angle (perpendicular versus angled inward). It is also possible that higher Reynolds numbers and turbulence are sufficient to explain these different trends without such configurational influences. Further work will be necessary to evaluate systematically these various sensitivities and relate definitively these laminar and turbulent results.
3.5. Wall interactions and attachment
This subsection focuses specifically on the wall jet regime, which occurs at high levels of rotation. As shown in figure 3, the transition to a wall jet solution occurs via a sequence of two saddle–node bifurcations of the steady 2-DA flow whereby the vortex breakdown recirculation zone expands dramatically due to the realisation of a favourable pressure gradient along the dump plane wall related to the Coandă effect. A detailed account of the flow topology and flow physics in the wall jet regime, and its hysteretic relationship with quasi-columnar-type solutions, has been discussed in other works (Ogus et al. Reference Ogus, Baelmans and Vanierschot2016; Douglas et al. Reference Douglas, Emerson and Lieuwen2021b; Douglas & Lesshafft Reference Douglas and Lesshafft2022). The main purpose of this subsection is to note briefly the extensive interval of bistability that forms in the annular swirling jet at moderate Reynolds numbers, and to mention the implications of this physics in practical situations.
As suggested above, compared to a circular swirling jet, the annular swirling jet exhibits a very large interval of bistability in  ${ {S}}$. For
 ${ {Re}}\geq 100$, Douglas et al. (Reference Douglas, Emerson and Lieuwen2021b) showed that typically, fully developed jets without a centrebody and with flush injection exhibit a hysteresis interval of width
 $\Delta { {S}}\sim O(0.1)$. However, for annular swirling jets, figure 3 shows that
 $\Delta { {S}}\sim O(1)$ for
 ${ {d}}\lesssim 0.5$ at
 ${ {Re}}=100$, and indicates that this range grows dramatically as the Reynolds number increases. For instance, at
 ${ {Re}}=250$,
 $\Delta { {S}}\sim O(10)$ for the same range of
 ${ {d}}$, and this hysteresis interval continues to widen for higher
 ${ {Re}}$. This stark broadening of the hysteresis region indicates that a transition to or from the wall jet regime is unlikely to occur spontaneously due to fluctuations in the incoming flow rate and swirl levels pushing a given state beyond the saddle–node bifurcation at
 ${ {S}}_b$. Instead, such a transition would likely require external excitation or special initial conditions that cause the flow to ‘jump’ spontaneously between the breakdown and wall jet solution manifolds. Some experimental evidence for this scenario has been found previously in the forced turbulent study of O'Connor & Lieuwen (Reference O'Connor and Lieuwen2012), where a switch from a breakdown state to a wall jet state was reported under sufficiently strong external acoustic forcing.
The possibility of such an extreme shift in the bulk flow topology at high swirl conditions due to noise or other factors is a significant concern for engineering systems featuring swirling annular jets. The flat dump plane wall considered in our study offers a simple example of the possible dynamics associated with wall attachment at high swirl. However, more complex nozzle geometries and confinement situations could lead to hysteresis at more moderate swirl conditions (Douglas & Lesshafft Reference Douglas and Lesshafft2022). For example, Ogus et al. (Reference Ogus, Baelmans and Vanierschot2016) have provided numerical and experimental evidence of wall jet–central jet transitions in their recessed and tapered nozzle design, which seems to have shifted the interval of hysteresis to swirl levels lower than those seen in our study. Similar findings were also reported in the turbulent regime by Vanierschot & Van den Bulck (Reference Vanierschot and Van den Bulck2007a,Reference Vanierschot and Van den Bulckb).
4. Concluding remarks
This work explores the dynamics underlying the complex flow behaviours seen in laminar annular swirling jets using nonlinear branch continuation and bifurcation analysis. It demonstrates how variations in the Reynolds number  ${ {Re}}$, the swirl ratio
 ${ {S}}$, and the centrebody diameter
 ${ {d}}$ produce a clear sequence of distinct flow topologies and unsteady behaviours. Beginning at low
 ${ {Re}}$ values in the steady regime, we show how the axisymmetric flow evolves from a small centrebody wake at low
 ${ {S}}$ values to a large vortex breakdown recirculation zone at higher
 ${ {S}}$ through a sequence of intermediate states that agrees with earlier experiments by Sheen et al. (Reference Sheen, Chen and Jeng1996). Additionally, we detail a wall jet regime similar to that found by Vanierschot & Van den Bulck (Reference Vanierschot and Van den Bulck2007a), which is bistable with respect to the breakdown solution over a significant parameter range. This wall jet solution shows clear parallels with other high-
 ${ {Re}}$ experiments (O'Connor & Lieuwen Reference O'Connor and Lieuwen2012), and reinforces recent evidence that wall effects are not negligible in swirling jets (Douglas et al. Reference Douglas, Emerson and Lieuwen2021b; Douglas & Lesshafft Reference Douglas and Lesshafft2022).
Moving on to higher  ${ {Re}}$ values, results are presented for each of the three main flow regimes identified: wake, breakdown and wall jet. Our investigation of the wake regime begins with the case
 ${ {S}}=0$, where we identify a stationary
 $|m|=1$ Hopf bifurcation that gives rise to a 3-DPS steady solution resulting in a skewed wake structure behind the centrebody (Tomboulides & Orszag Reference Tomboulides and Orszag2000; Del Taglia et al. Reference Del Taglia, Moser and Blum2009). We demonstrate further that this non-axisymmetric steady solution exhibits a small interval of bistability for
 ${ {d}}\lesssim 0.8$ just before the critical
 ${ {Re}}$ and
 ${ {d}}$ values. With further increase in
 ${ {Re}}$, the non-swirling, plane-symmetric steady wake solution experiences instability to infinitesimal 3-D disturbances. These include plane-symmetric Bénard–von Kármán-type vortex shedding patterns and a very slow plane-asymmetric wobble pattern associated with quasi-static streak structures. These behaviours are strikingly similar to the dominant coherent structures that appear in the turbulent regime (Vanierschot et al. Reference Vanierschot, Percin and van Oudheusden2021). Introducing weak swirl to the flow causes the steady non-axisymmetry found in the
 ${ {S}}=0$ case to twist into a spiral shape that precesses slowly periodically in time about the centreline in the direction of swirl. Similar dynamics has been reported for weakly swirling turbulent annular jets (Vanierschot et al. Reference Vanierschot, Van Dyck, Sas and Van den Bulck2014), suggesting that
 ${ {S}}>0$ plays the same symmetry-breaking role even at much higher
 ${ {Re}}$ values. In addition, we explain the link between the linear instabilities of the non-axisymmetric steady flow at
 ${ {S}}=0$ and the emergence of quasi-periodic and chaotic solution manifolds for
 ${ {S}}>0$. Our arguments clarify the origins of the quasi-periodicity at low
 ${ {S}}$ reported by Ogus et al. (Reference Ogus, Baelmans and Vanierschot2016). Nonetheless, a Floquet analysis or time-domain study delving further into such dynamics and exploring the system's route to chaos may be an interesting direction for future work.
At more moderate rotation levels but low  ${ {d}}$, the centrebody wake is small and weak, and the inner shear layer apparently does not play an important role in the flow's instability behaviour. In such situations, the annular swirling jet behaves similarly to a circular swirling jet, expressing a form of the
 $|m|=2$ instability first identified by Billant et al. (Reference Billant, Chomaz and Huerre1998), which occurs via a subcritical bifurcation as described in Douglas et al. (Reference Douglas, Emerson and Lieuwen2021b) at
 ${ {S}}$ values well before vortex breakdown. At intermediate
 ${ {d}}$, where instability occurs near the threshold
 ${ {S}}$ value for vortex breakdown, interactions between fluctuations and the mean flow open possibilities for hysteresis between a stagnation-point-free steady 2-DA solution and a co-rotating
 $|m|=1$ PVC limit cycle solution. At higher
 ${ {d}}$, multiple
 $|m|=1$ and
 $|m|=2$ modes do become unstable, but were found to bifurcate only from a steady 2-DA flow that already exhibited a well–developed breakdown recirculation zone. Thus it is shown that the vortex breakdown stagnation zone may develop either in an unsteady manner, where the flow experiences nonlinear instability before the formation of a steady central stagnation point, or in a steady manner, where the stagnation point emerges within the steady axisymmetric flow. This finding presents an understanding of the vortex breakdown and instability process different from many previous modelling studies, which often insist that the central recirculation bubble is always a precursor to instability, rather than a possible product of it. It would be interesting for future work to consider how different flow configurations (e.g. other nozzle geometries) and parameter conditions (e.g. turbulent Reynolds numbers) influence the structure and dynamics of these unsteady flow features.
Supplementary movies
Supplementary movies 1–5 are available at https://doi.org/10.1017/jfm.2022.453.
Funding
This work was partially supported by the Air Force Office of Scientific Research under award no. FA9550-20-1-0215 (contract monitor Dr C. Li), the University Turbine Systems Research Program (contract no. DE-FE0031285, contract monitor Dr M. Freeman), and the FAA Center of Excellence for Alternative Jet Fuels and the Environment, project 55 through FAA award no. 13-C-AJFE-GIT-058 under the supervision of Roxanna Moores. Any opinions, findings, conclusions or recommendations expressed in this material are those of the authors and do not necessarily reflect the views of the FAA.
Declaration of interests
The authors report no conflict of interest.


 Open access

