Attachment theory (Bowlby, Reference Bowlby1969, Reference Bowlby1973, Reference Bowlby1980) is a lifespan developmental theory that has had an enormous impact on psychology and psychiatry and has become a common theoretical framework for many different disciplines. The development of valid and reliable measures such as the Strange Situation (Ainsworth, Blehar, Waters, & Wall, Reference Ainsworth, Blehar, Waters and Wall1978), the Adult Attachment Interview developed by Main and colleagues (George, Kaplan, & Main, Reference George, Kaplan and Main1985), and a number of self-report measures of romantic attachment style (Bartholomew & Shaver, Reference Bartholomew, Shaver, Simpson and Rholes1998) has played a crucial role in advancing attachment research. Currently, the Experiences in Close Relationships (ECR) questionnaire (Brennan, Clark, & Shaver, Reference Brennan, Clark, Shaver, Simpson and Rholes1998) is one of the most established self-report instruments to measure adult attachment style. It yields scores on two scales, named anxiety (about abandonment or insufficient love) and avoidance (of intimacy and emotional expression), which were found to have high internal consistency (Brennan et al., Reference Brennan, Clark, Shaver, Simpson and Rholes1998; Picardi, Caroppo, Toni, Bitetti, & Di Maria, Reference Picardi, Caroppo, Toni, Bitetti and Di Maria2005) and test-retest reliability (Picardi et al., Reference Picardi, Caroppo, Toni, Bitetti and Di Maria2005). Conceptually, they correspond to similar dimensions that can be observed in infants subjected to the ‘Strange Situation’ procedure (Brennan et al., Reference Brennan, Clark, Shaver, Simpson and Rholes1998).
The ECR has been widely used in the last decade to investigate links between adult attachment and a great variety of correlates, such as social competence (Mallinckrodt & Wei, Reference Mallinckrodt and Wei2005), coping (Wei, Heppner, & Mallinckrodt, Reference Wei, Heppner and Mallinckrodt2003), temperament and character (Picardi et al., Reference Picardi, Caroppo, Toni, Bitetti and Di Maria2005), the Big Five personality factors (Noftle & Shaver, Reference Noftle and Shaver2006; Picardi et al., Reference Picardi, Caroppo, Toni, Bitetti and Di Maria2005), genetic polymorphisms related to emotions and social behavior (Gillath, Shaver, Baek, & Chun, Reference Gillath, Shaver, Baek and Chun2008), immune function (Picardi et al., Reference Picardi, Di Gennaro, Meldolesi, Grammaldo, Esposito and Quarato2007), skin diseases (Jankovic et al., Reference Jankovic, Raznatovic, Marinkovic, Maksimovic, Jankovic and Djicanovic2009), anxiety sensitivity (Weems, Berman, Silverman, & Rodriguez, Reference Weems, Berman, Silverman and Rodriguez2002), and mental disorders (Marazziti et al., Reference Marazziti, Mandillo, Di Pietro, Golini, Matteoni and Tocchini-Valentini2007).
However, there is a scarcity of studies addressing the stability of the the ECR measurement properties of the ECR across different groups or, more formally, the ECR’s its measurement invariance, has been systematically neglected in empirical literature. However, Measurement invariance is an empirical issue of fundamental importance (Meredith & Teresi, Reference Meredith and Teresi2006), especially when an assessment instrument is used in clinical populations, either for diagnosis and treatment planning or for research purposes. Only an instrument that fulfills the requirement of measurement invariance actually measures the same attribute in the same way in different subpopulations (Meredith, Reference Meredith1993). Threat to measurement invariance may come from instrument’s characteristics such as item content and wording, test difficulty or length, or, more simply, from the effect of the measurement procedure (Fiske, Reference Fiske1987). Response bias, namely a consistent tendency to respond inaccurately to a substantive indicator (McGrath, Mitchell, Kim, & Hough, Reference McGrath, Mitchell, Kim and Hough2010), such as those resulting from individuals’ deliberate effort to present themselves in a positive/negative manner (Paulhus, Reference Paulhus1984), to agree or to disagree with items, and to use the extreme or the middle point of the response scale (Weijters, Reference Weijters2006), could be an additional but particularly serious problem. In fact, these biases introduce in the assessment procedure an amount of variance linked to measurement procedures, additional to that explained by the construct under investigation (Fiske, Reference Fiske1987). This unwanted variance component may inflate or suppress relationships among variables (Podsakoff, MacKenzie, Lee, & Podsakoff, Reference Podsakoff, MacKenzie, Lee and Podsakoff2003), and when method effects are not uniform it may compromise the measurement stability of a psychological instrument across groups (Van de Vijver & Leung, 1997).
The current lack of evidence of measurement invariance of the ECR leaves an element of uncertainty regarding the reliability of between-group comparisons, especially as far as clinical samples are concerned. For instance, patients may tend to present themselves as more distressed and thus give answers biased towards insecurity, in an attempt to engage the interest and sympathy of the clinicians. This response bias may occur more often in patients with severe illness, or during the first stages of treatment. In other clinical contexts, patients may tend to present themselves more favorably, and thus, in accordance with a legitimation bias (Ormel, Koester, & van den Brink, Reference Ormel, Koester and van den Brink1989), they may give answers biased towards security, if they think that their clinicians expect them to improve. Finally, patients with mental disorders may be particularly prone to biases such as acquiescence or opposition (or disagreement), due to the frequent co-occurrence of disordered personality traits.
In the present study, we examined the measurement invariance of the ECR and the impact of method variance on individual scores in four different groups consisting of non-clinical participants, dermatological patients, patients with drug-resistant epilepsy, and psychiatric inpatients. These groups encompass a wide spectrum of health conditions, such as good health, a distressing physical condition, a severe physical disease, and a severe mental disorder. They are expected to differ in ECR mean scores. As attachment insecurity is a risk factor for mental health and is associated with psychopathology (Atkinson & Zucker, Reference Atkinson and Zucker1987; Conradi & De Jonge, 2009), psychiatric patients are expected to show the highest mean scores on anxiety and avoidance. Similarly, given the substantial psychiatric comorbidity among patients with intractable epilepsy (Sanchez-Gistau et al., Reference Sanchez-Gistau, Pintor, Sugranyes, Baillés, Carreño, Donaire and Rumia2010; Swinkels, Kuyk, van Dyck, & Spinhoven, Reference Swinkels, Kuyk, van Dyck and Spinhoven2005), patients with drug-resistant epilepsy are expected to score higher than non-clinical participants on both ECR dimensions. On the other hand, dermatological patients are expected to display scores similar to those of non-clinical participants.
This study aims to advance knowledge about the psychometric stability of the ECR questionnaire, and to quantify the degree of bias (if present) associated with its administration across very different applied contexts. Clarification of this issue may help researchers and clinicians interpret ECR scores across a wide variety of populations and promote the use of the instruments in clinical settings and research contexts other than social and personality psychology.
Method
Participants
Non-clinical sample
This sample consists of 222 undergraduate and graduate students with no past or present history of severe medical or psychiatric illness (mean age 26.6 ± 9.9 years, 64% females), who were recruited at the ‘Sapienza’ and ‘Cattolica’ Universities of Rome, Italy. The participants were contacted by a researcher who gave them a letter explaining the study, and invited them to complete several assessment instruments, including the ECR.
Psychiatric sample
This sample, recruited as part of an ongoing study on individual differences and psychopathology, comprises 156 adult psychiatric inpatients, free from dementia and severe cognitive impairment as clinically determined, who were admitted over a 3-year enrolment period to the inpatient ward of a private psychiatric facility located in Rome and accredited by the Italian National Health Service. All eligible patients were approached by a research assistant, who explained them the study and invited them to participate and sign a written informed consent form. Within 3 days from admission, participants were administered a battery of self-report measures, including the ECR. A total of 156 patients (79% of all participants) returned a completed ECR and were included in the present study. Their mean age was 42.6 ± 12.6 years, and 58% were females. The more common primary psychiatric diagnoses were bipolar disorder (23%), major depressive disorder (22%), anxiety disorders (11%), substance use disorders (9%), schizophrenia (8%), and schizoaffective disorder (7%); overall, 39% of patients received a diagnosis of psychotic disorder.
Dermatological sample
This sample consists of 458 dermatological patients with skin disease (mean age 37.1 ± 12.7 years, 55% females), which were recruited at the outpatient (N = 264) and inpatient (N = 194) clinics of the IDI-IRCCS dermatological hospital, located in Rome. All patients were examined by a dermatologist and were administered several self-completed instruments, including the ECR. Sixty-four patients were diagnosed with alopecia areata, 124 with psoriasis, 32 with vitiligo, and 238 with other skin conditions such as nevi, benign skin neoplasms, mycosis, warts, keratosis, contact dermatitis, other forms of dermatitis, connective tissue disease, prurigo, bacterial and viral infections, ichthyosis, and skin ulcers. All participants provided written informed consent to participate in the study.
Drug-resistant epilepsy sample
This sample comprises 101 patients with drug-resistant epilepsy (mean age 34.8 ± 10.6 years, 47% females) who took part in an ongoing comprehensive study on the psychosocial aspects of treatment-refractory epilepsy carried out at the Epilepsy Surgery Unit of the NEUROMED-IRCCS Neurological Institute, located in Pozzilli, a small town about 100 miles from Rome. This Unit receives referrals from all over the country, particularly the Central and Southern regions. Most patients (N = 85) were affected by temporal lobe epilepsy (46 left, 39 right). Other diagnoses included frontal (5 left, 3 right), posterior (1 left, 3 right), bitemporal (N = 2), bifrontal (N = 1), and multifocal (N = 1) epilepsy. The diagnosis was based on a comprehensive presurgical assessment protocol, which was described in detail in a previous paper (Quarato et al., Reference Quarato, Di Gennaro, Mascia, Grammaldo, Meldolesi, Picardi and Esposito2005). Most patients (N = 78) were judged to be suitable candidates for epilepsy surgery and were operated, while some patients (N = 23) did not undergo surgery as they were not eligible for surgery or refused surgery. Most patients (N = 77) completed the ECR during the presurgical assessment, while 11 and 13 patients completed the instrument at the 1-year and 2-year follow-up assessment, respectively.
Measures
The ECR (Brennan et al., Reference Brennan, Clark, Shaver, Simpson and Rholes1998) is a self-completed questionnaire consisting of 36 items, each scored on a 7-point scale. The instrument yields scores on two 18-item scales, named anxiety and avoidance. People scoring high on the avoidance scale tend to avoid emotional closeness and intimacy, do not feel comfortable opening up to or depending on their partner, and are reluctant to ask their partner for comfort, advice, or help. People scoring high on the anxiety scale tend to be preoccupied with their romantic relationships, worry about being abandoned, desire to be very close to their partner, and ask the partner for more feeling and commitment. We used the validated Italian version of the instrument (Picardi et al., Reference Picardi, Vermigli, Toni, D’Amico, Bitetti and Pasquini2002), developed using multiple translators, iterative back-translation, and pilot testing in order to achieve conceptual, semantic and content equivalency of the translated instrument. In the original validation study (Brennan et al., Reference Brennan, Clark, Shaver, Simpson and Rholes1998), the internal consistency of ECR scales as measured by coefficient alpha was found to be .91 for anxiety and .94 for avoidance. In the present study, the alpha coefficients for anxiety were .90, .86, .90, and .92 for the non-clinical, psychiatric, dermatological and neurological sample, respectively. The alpha coefficients for avoidance were .92, .89, .89, and .89 for the non-clinical, psychiatric, dermatological and neurological sample, respectively.
Modeling procedures
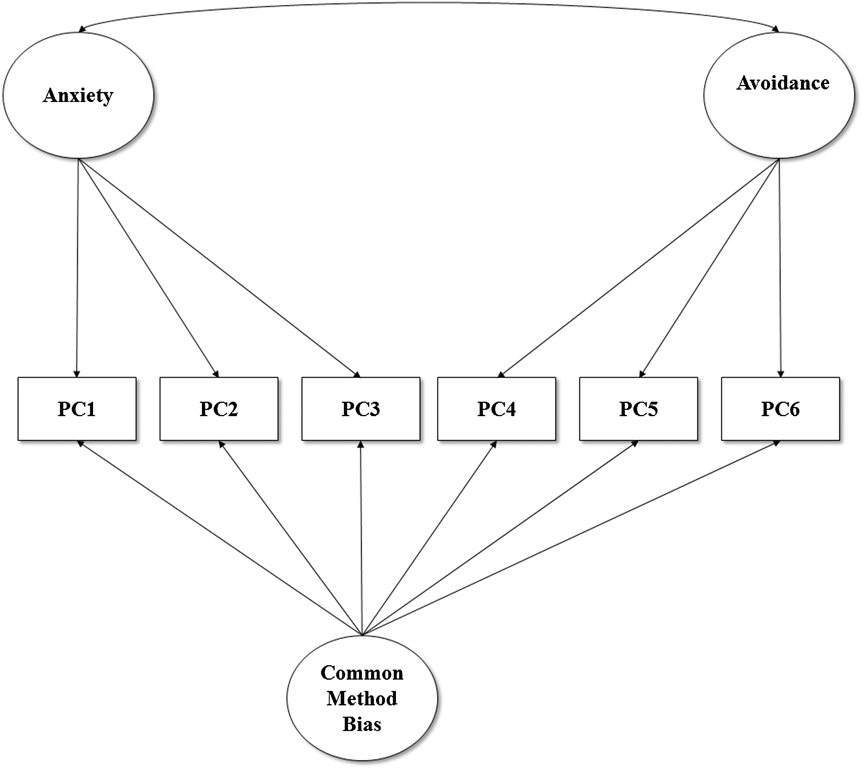
In the present study, we used an integrative model that allows the analysis of the measurement invariance of the ECR, while controlling for method effects (Figure 1). In particular, we submitted the ECR scale to a Confirmative Factor Analysis by following the procedures recommended by Shaver and colleagues (Alonso-Arbiol, Balluerka, Shaver, & Gillath, Reference Alonso-Arbiol, Balluerka, Shaver and Gillath2008).
The combined ECR model

Building on this work, we built three parcels of items for the avoidance subscale and three parcels for the anxiety subscale. A parceling approach is optimal for the current research because: (a) of the small size of some samples and the relative large number of indicators; (b) the approach allows for the modeling of measurement error in the ECR measure with a minimal amount of extra parameters, and (c) the main focus of the current study is the stability of the ECR scores, rather than the exact relationships among items. Moreover, with small sample sizes, item parceling is likely to increase the stability of the parameter estimates, to improve the variable to sample size ratio, and to reduce the effects of non-normality (see Little, Cunningham, Shahar, & Widaman, Reference Little, Cunningham, Shahar and Widaman2002). Use of item parcels or composites instead of items is not novel in the study of measurement invariance (see, for instance, Van de Vijver & Leung, 1997). Accordingly, items were randomly combined into three parcels of six items, separately for each dimension (Little et al., Reference Little, Cunningham, Shahar and Widaman2002). In doing so, we followed a suggestion by Little et al. (Reference Little, Cunningham, Shahar and Widaman2002), which advocated the use of three parcels because fewer parcels lead to local under-identification and more parcels lead to local over-identification. In general, for our objectives, a just-identified latent variable is preferable to an over-identified one (Little et al., Reference Little, Cunningham, Shahar and Widaman2002).
Thus, the final model was composed by six manifest indicators (parcels), represented by the individuals’ mean scores on six items belonging to one of the two ECR scales (see APPENDIX 1). Three parcels were for anxiety, three parcels were for avoidance. Each manifest indicator was allowed to load simultaneously on two latent variables. The first was the factor representing avoidance or anxiety, the second was a general factor representing the amount of variance introduced by the effect of the assessment procedures (i.e. the common method bias). Whereas anxiety and avoidance were allowed to correlate, the common method factor (henceforth CMB) was specified uncorrelated with each of them. Under this model, the proportions of variance attributable to anxiety, avoidance and method effect can be partitioned and quantified. More precisely, considering only a group at a time, the decomposition of the observed scale becomes:
 $$\sigma _{\rm{y}}^2 = [(\Sigma {\rm{\lambda }}_{{\rm{i1}}} )]^2 + [(\Sigma {\rm{\lambda }}_{{\rm{i2}}} )^2 + (\Sigma {\rm{\lambda }}_{{\rm{i3}}} )^2 + 2\phi _{23} (\Sigma {\rm{\lambda }}_{{\rm{i2}}} )(\Sigma {\rm{\lambda }}_{{\rm{i3}}} )] + [(\Sigma {\rm{\theta }}_{\rm{i}} )],$$
where ɸ23 is the correlation between anxiety and avoidance factors, λi1 is the loading for the CMB factor, λi2 is the loading for the anxiety factor, λi3 is the loading for the avoidance factor, and θi the vector of measurement errors. Notice that the variance of anxiety and avoidance factors cannot be separated. In the above formulation,
 ${\rm{\sigma }}_{\rm{y}}^2$
represents total variance, [(Σλi1)]2 represents the variance due to CMB factor; [(Σλi2)2 + (Σλi3)2 + 2ɸ23(Σλi2)(Σλi3)] represents the variance due to anxiety and avoidance, and [(Σθi)] represents the variance due to measurement error. Accordingly, the ratio Pmbf = [(Σλi1)]2 /
 ${\rm{\sigma }}_{\rm{y}}^2$
represents the proportion of variance explained by the CMB factor, whereas Pan+av = [(Σλi2)2 + (Σλi3)2 + 2ɸ23(Σλi2)(Σλi3)] /
 ${\rm{\sigma }}_{\rm{y}}^2$
represents the proportion of variance explained by anxiety and avoidance together. Finally PER = [Σθi] /
 ${\rm{\sigma }}_{\rm{y}}^2$
represents the proportion of variance explained by measurement error.
As anxiety and avoidance factors are correlated, their respective variance proportions cannot be separated at the scale level. Accordingly, two variance components can be compared: trait variance (i.e. anxiety + avoidance) and method variance.
Steps of invariance analysis
In a first step, we examined the factor structure of the measures of the ECR model (Figure 1) separately in each group, using linear confirmatory factor analysis (CFA). In a second step, after the fit of the ECR model was established separately for each of the four groups, we used multigroup CFAs to examine measurement invariance. Following recommendations by Vandenberg & Lance (Reference Vandenberg and Lance2000), a sequence of nested models was tested. In the First (unconstrained) model (Table 1, Model 1), the factor loadings, the item intercepts, and the error variances were allowed to differ across groups (configural invariance). This level of invariance is an application to factorial invariance of the Thurstone’s principle of simple structure, stating that items comprising the measurement instruments should exhibit the same configuration of salient and insalient loadings across groups. In a third step (Model 2), the factor loadings (λi) for both anxiety and avoidance were constrained to be equal across groups (metric invariance). Because the factor loading represents the strength of the linear relation between each factor and its associated items (Bollen, Reference Bollen1989), the equivalence of loadings of the items on the underlying factor suggests that the observed score differences on an item can be meaningfully considered indicative of cross-group differences in the underlying construct. In a fourth step (Model 3), we constrained the loadings for the CMB factor to be also invariant. This level of invariance extends the equivalence of score differences at the level of CMB factor. In a fifth step (Model 4), we maintained the restrictions of the fourth step and imposed the additional constraint of equal first-order intercept invariance (i.e, scalar invariance: equal τ). This latter level of invariance is of special interest, because it is required for comparing latent means across groups (Vandenberg & Lance, Reference Vandenberg and Lance2000), and refers to equality of scale’s origin between groups. In other words, observed mean differences on the manifest variables imply that there are group differences on the latent means. Otherwise, mean level comparisons will be biased.
Tests of measurement invariance of the ECR scale across clinical and non clinical groups

Statistical analyses
All models were tested using Mplus 4.01 (Muthén & Muthén, Reference Muthén and Muthén2004). The following criteria were employed to evaluate the goodness of fit: chi-square likelihood ratio statistic, Tucker Lewis fit index (TLI), the comparative fit index (CFI), the root mean square error of approximation (RMSEA) with associated confidence intervals, and the standardized root mean square residual (SRMR). The chi-square statistic is sensitive to large sample sizes and easily produces a statistically significant result (Bollen, Reference Bollen1989). Thus, we accepted model resulting in CFI values greater than .90 (Bentler, Reference Bentler1990), RMSEA values lower than .08 (Browne & Cudeck, Reference Browne, Cudek, Bollen and Long1993), and SRMR values lower than .06 (Hu & Bentler, Reference Hu and Bentler1999).
To test differences among the base model and the more restricted models, we calculated restricted chi-square tests (Δχ²) with an alpha level of .05 (Bollen, Reference Bollen1989). If a step resulted in a significant chi-square difference test, the particular restriction was rejected and parameters with the highest modification index (MI; Muthén & Muthén, Reference Muthén and Muthén2004) were sequentially estimated. When partial measurement invariance was established, the sequence of models was continued.
Results
Model fitting and variance decomposition
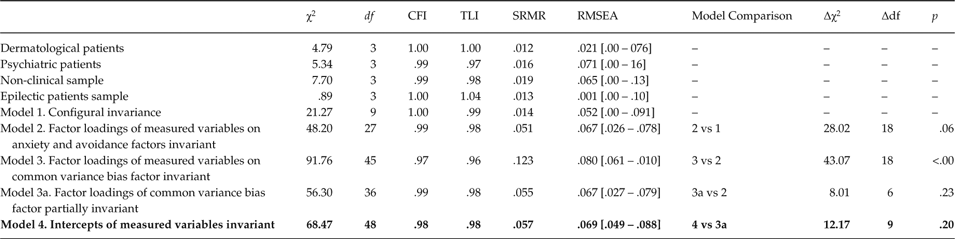
Data analyses revealed a close fit of the hypothesized model within each of the four samples (Table 1).
Indeed, the chi-square test resulted not significant, and all fit indices exceeded the more restrictive criteria suggested by Hu & Bentler, (1999). In all groups, item loadings on anxiety and avoidance were significant and above .40 (except for some loadings on the CMB factor). Anxiety and avoidance were found to be significantly correlated (i.e. φ = .41, SE=.15) in the psychiatric sample, but not in the non-clinical sample (φ = .06, SE=.26), in the dermatological sample (i.e. φ = .10, SE = .15), or in the drug-resistant epilepsy sample (φ = .08, SE = .19). Using unstandardized parameter estimates, we computed the percentages of trait variance (i.e. anxiety + avoidance) and CMB variance separately for the four samples. The percentages of trait variance were 61%, (non-clinical sample), 71%, (dermatological sample), 50% (psychiatric sample), and 49% (drug-resistant epilepsy sample). The percentages of CMB variance were 27% (non-clinical sample), 20% (dermatological sample), 42% (psychiatric sample), and of 48% (drug-resistant epilepsy sample). Finally, the percentages of error variance were 12% (non-clinical sample), 8% (dermatological and psychiatric samples), and 3% (drug-resistant epilepsy sample).
Measurement invariance analysis
Having established the good fit of the hypothesized model, we proceeded with examining configural invariance (Figure 1). The configural model fitted the data well, and was not significantly different from Model 2 (Table 1).
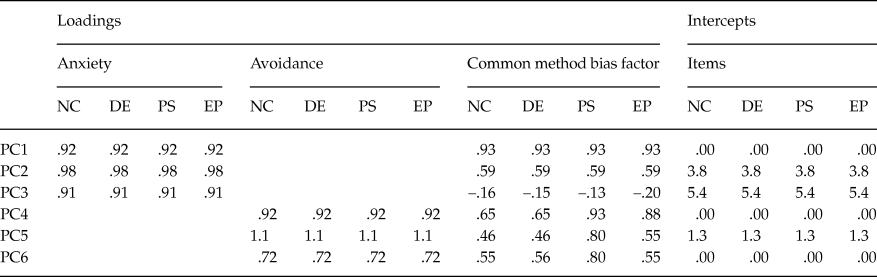
However, when we constrained the loadings for the CMB factor to be equal across the four groups (Model 3), the change in overall chi-square was significant (for this and all other comparisons refer to Table 1). This led us to introduce a slightly modified model (Model 3a), in which two loadings were relaxed to be different in the psychiatric sample, four in the dermatological sample, and three in the drug-resistant epilepsy sample. After that, the chi-square difference test supported the viability of partial metric invariance for the CMB. When the intercepts were constrained to be equal across groups, the chi-square difference test became non-significant (Model 4). Thus, the hypothesis of scalar invariance was not rejected (Table 2).
Unstandardized values of loadings and intercepts from the best fitting Model 4

Note: PC1-PC6: item parcels. NC = Non clinical patients; DE= Dermatological patients ; PS= Psychiatric patients ; EP : Drug resistant epilepsy patients; One value under each column means invariant constraints (i.e., the same factor loading/intercept held for non-clinical participants and for dermatological, psychiatric and drug resistant epilepsy patients). Different values on the same row indicate that the constraint was relaxed (i.e., there were different factor loadings/intercepts for non-clinical, dermatological and psychiatric patients).
Latent means comparison
When we constrained the factor means for anxiety and avoidance separately to be equal across the four samples, the chi-square difference tests between this model and the less constrained model were both significant (anxiety: Δχ2 (3) = 43.27, p < .001; avoidance: Δχ2 (3) = 43.27, p < .001). Therefore, latent means should be considered different across groups. We conducted several post hoc comparisons, by fixing two means at a time (e.g., psychiatric and non-clinical) to be equal. To control for the number of comparisons performed, we fixed the significance of chi square at p < .001. In order to assess the magnitude of the differences, standardized effect sizes (d) were computed by dividing the mean difference by the within-groups pooled standard deviation. With regard to avoidance, psychiatric patients scored higher than dermatological patients (d = .53), non-clinical participants (d = .39), and drug-resistant epilepsy patients (d = .17). As regards anxiety, psychiatric patients scored higher than dermatological patients (d = .60), non-clinical participants (d = .54), and drug-resistant epilepsy patients (d = .24); also, dermatological patients scored lower than non-clinical participants (d = –.23). These results, according to Cohen’s criteria (Cohen, Reference Cohen1988), indicate small to moderate differences between groups.
Discussion
The ECR is widely appreciated as a valid and reliable self-report measure of the two main dimensions underlying adult attachment style, and has had a substantial impact in the field of attachment research. However, there has been little work on evaluating its measurement invariance across different populations. This study corroborated the stability of its psychometric properties across four different samples ranging from individuals who were free from clinically significant illness to patients with skin diseases, drug-resistant epilepsy, or severe psychiatric disorders. The results of CFA provided evidence of configural, partial-metric, and partial-scalar invariance across groups. This suggests that even individuals belonging to very different populations tend to give the same meaning to the items representing anxiety and avoidance, and respond using the same scale of measurement. However, a slight degree of bias was found to be present, because some loadings from the CMB factor were non-invariant and thus differed from a group to another. This finding suggests that method effects may affect to some extent comparisons of raw scores across groups. Indeed, construct equivalence represents a prerequisite for unambiguously interpreting differences in factor scores, As both metric and scalar invariance were at least partially verified, the use of latent means may be preferred to use of linear score combinations (i.e., means or summative scores) in order to compare scores obtained in very different administration settings.
With regard to the incidence of method bias on individual scores on the ECR scales, across the four samples the percentage of method variance was found to be considerably lower as compared to trait variance. These findings are consistent with those reported by Williams, Cote, and Buckley (Reference Williams, Cote and Buckley1989), who found a percentage of 25% of method variance in a reanalysis of a large body of multi-trait multi-method studies. However, there were some differences across samples in the percentage of variance accounted for by method factor. The proportion of method variance was roughly similar for non-clinical subjects and dermatological patients, while it was higher for psychiatric inpatients and patients with drug-resistant epilepsy. Given that both patients with epilepsy and patients with mental disorders were hospitalized at the time of the assessment, a possible explanation of this finding is that measurement context is an important determinant of the amount of method variance, as it likely differed substantially between inpatient wards and other contexts such as outpatient clinics or non-clinical settings.
Of importance, in all but the psychiatric sample, the inclusion of the CMB factor zeroed the correlation between anxiety and avoidance. Theoretically, it is assumed that attachment-related anxiety and avoidance are orthogonal dimensions (see Mikulincer, Shaver, Sapir-Lavid, & Avihou-Kanza, Reference Mikulincer, Shaver, Sapir-Lavid and Avihou-Kanza2009). However, in research practice they are often found to be inter-correlated to some degree. A recent meta-analysis of 242 studies (Cameron, Finnegan, & Morry, Reference Cameron, Finnegan and Morry2012) reported a combined correlation of .20 (95% CI = .18 to .22) between anxiety and avoidance as assessed by the ECR and ECR-R. Interestingly, the correlation varied from .17 (95% CI = .13 to .17) in studies using the ECR to .41 (95% CI = .37 to .44) in those using the ECR-R. Likely, method factors (such as item wording, position in the scale, etc.) might contribute to introduce this limited degree of inter-correlation. Thus, it is not surprising that the correlation between anxiety and avoidance was found to be reduced in the model including a CMB factor.
In conclusion, our findings corroborate the notion that the ECR has fine psychometric properties. Whereas method variance bias may affect parameter estimates to some degree, this effect can be practically reduced, although not completely eliminated, and it can be controlled for and quantified. In this study, after controlling for method variance bias, the ECR revealed robust psychometric properties across a wide variety of contexts. From a test construction perspective, one may wonder about the psychometric relevance of method bias in this instance. Theoretically, a slight revision of the ECR may help reduce method effects associated with wording biases. Unfortunately, the sample size prevented us from investigating the impact of method bias at the item level in order to identify items that may need revision. Indeed, it should be recognized that no psychological instrument can be considered completely free from method biases and that such effects likely affect most, if not all, instruments (Podsakoff et al., Reference Podsakoff, MacKenzie, Lee and Podsakoff2003). Indeed, we are persuaded that our psychometric model might apply to the major part of psychological instruments (Podsakoff et al., Reference Podsakoff, MacKenzie, Lee and Podsakoff2003), as far as researchers would be likely to recognize and to investigate these effects. In closing, the main practical implication of our findings is that caution should be applied when comparing ECR scores obtained in very different settings or populations; in such situations, researchers may consider the use of latent means in place of raw scores.
APPENDIX 1 Parcels’ composition
Avoidance
Parcel 1: Item25, Item13, Item5, Item19, Item9, Item29.
Parcel2: Item35, Item15, Item17, Item7, Item21, Item23.
Parcel 3: Item27, Item1, Item11, Item31, Item33, Item3.
Anxiety
Parcel 1: Item36, Item4, Item18, Item20, Item28, Item12.
Parcel 2: Item30, Item16, Item6, Item8, Item24, Item34.
Parcel 3: Item26, Item10, Item14, Item32, Item22, Item2.