Introduction
The calcareous green alga Halimeda is widely distributed across the tropics and subtropics (Verbruggen & Kooistra, Reference Verbruggen and Kooistra2004; Dijoux et al., Reference Dijoux, Verbruggen, Mattio, Duong and Payri2012; Cremen et al., Reference Cremen, Huisman, Marcelino and Verbruggen2016). It can utilize bicarbonate (HCO3−) for calcification and precipitates aragonite crystals in its intercellular spaces (Borowitzka & Larkum, Reference Borowitzka and Larkum1976). It is one of the main calcium carbonate (CaCO3) producers that contribute to the marine carbonate budget in tropical reefs and lagoons (Ree et al., Reference Ree, Opdyke, Wilson and Henstock2007; Mayakun et al., Reference Mayakun, Bunruk and Kongsaeng2014; Carneiro & Morais, Reference Carneiro and Morais2016; Kaewsrikhaw et al., Reference Kaewsrikhaw, Prathep, Darakai and Beer2016; McNeil et al., Reference McNeil, Webster, Beaman and Graham2016; Perry et al., Reference Perry, Morgan and Salter2016; Carneiro et al., Reference Carneiro, Pereira and Matthews-Cascon2018; Prathep et al., Reference Prathep, Kaewsrikhaw, Mayakun and Darakrai2018; Mayakun & Prathep, Reference Mayakun and Prathep2019). For instance, global estimates showed that Halimeda species contributed around 2 kg CaCO3 m−2 year−1 (Drew & Abel, Reference Drew, Abel, Harmelin-Vivien and Salvat1985; van Tussenbroek & van Dijk, Reference van Tussenbroek and van Dijk2007; Perry et al., Reference Perry, Morgan and Salter2016) or accumulated around 0.15 Gt CaCO3 year−1 (Milliman, Reference Milliman1993), resulting in ~8% of total world carbonate production (Hillis, Reference Hillis, Lessios and Macintyre1997). When only tropical reefs are considered, Halimeda can produce ~54.37 g m−2 year−1 of carbonate sediments (Carneiro et al., Reference Carneiro, Pereira and Matthews-Cascon2018), equivalent to at least 13,050.14 kg year−1 or around 42% of total sedimentary organic carbon (Tuntiprapas et al., Reference Tuntiprapas, Hayashizaki, Ogawa, Panyawai, Tamada, Stankovic and Prathep2019). Studies have shown that the carbonate production of Halimeda can vary due to abiotic and biotic factors. For abiotic factors, the CaCO3 production varied depending on local, environmental parameters such as temperature, light (Kaewsrikhaw et al., Reference Kaewsrikhaw, Prathep, Darakai and Beer2016; Ortegón-Aznar et al., Reference Ortegón-Aznar, Chuc-Contreras and Collado-Vides2017) or seawater inorganic carbon (Ci) (Peach et al., Reference Peach, Koch, Blackwelder and Manfrino2017). For biotic factors, CaCO3 production and sediment generation varied within and among Halimeda species because of differences in growth rates, calcification rates, segment sizes, turnover rates and life stages (Hillis-Colinvaux, Reference Hillis-Colinvaux1980; Perry et al., Reference Perry, Morgan and Salter2016; Mayakun & Prathep, Reference Mayakun and Prathep2019). However, the effect of biotic interactions that regulate Halimeda dominance is less commonly studied (but see Davis & Fourqurean, Reference Davis and Fourqurean2001; Barry et al., Reference Barry, Frazer and Jacoby2013).
In the Indo-Pacific Ocean, H. macroloba is a common widespread Halimeda species ranging from the tropics to subtropics (Pongparadon et al., Reference Pongparadon, Zuccarello and Prathep2017). Its abundance has been reported in shallow subtidal and intertidal zones at population densities from 24–200 thalli m−2 in seagrass-free or seagrass-poor ecosystems (Sinutok et al., Reference Sinutok, Pongparadon and Prathep2008; Mayakun et al., Reference Mayakun, Bunruk and Kongsaeng2014; Mayakun & Prathep, Reference Mayakun and Prathep2019). Producing one to two new segments daily, thalli grew by 0.021 g dry weight thallus−1 day−1. Total CaCO3 production by H. macroloba was 291.94–908.11 g m−2 y−1 and the CaCO3 content increased with age (Mayakun & Prathep, Reference Mayakun and Prathep2019). Due to its fast growth, and high CaCO3 productivity, this alga is a significant contributor to carbonate budgets (Mayakun et al., Reference Mayakun, Kim, Lapointe and Prathep2012a, Reference Mayakun, Kim, Lapointe and Prathep2012b, Reference Mayakun, Bunruk and Kongsaeng2014; Mayakun & Prathep, Reference Mayakun and Prathep2019).
Halimeda macroloba is a common and abundant species in seagrass beds in the shallow subtidal zone of Dongsha Island (also known as Pratas Island), South China Sea. Despite some fishing disturbances around the margins of Dongsha Atoll, a no-take reinforcement in the Dongsha Island (i.e. with total fishing restrictions, see the definition in Rolim et al., Reference Rolim, Langlois, Rodrigues, Bond, Motta, Neves and Gadig2019) is implemented via the establishment of Dongsha Atoll National Park under Taiwan governance as a marine protected area since January 2007. Thus, the island, as well as the atoll, is currently considered a less disturbed spot for marine biodiversity in South China Sea (Huang et al., Reference Huang, Lee, Chung, Hsiao and Lin2015). Due to the highly sandy environments, Dongsha Island harbours various seagrass species, resulting in a seagrass-dominated ecosystem (Lin et al., Reference Lin, Hsieh and Liu2005). The estimation of carbonate contribution by H. macroloba has primarily focused on Halimeda-dominated areas in tropical ecosystems (Mayakun et al., Reference Mayakun, Bunruk and Kongsaeng2014; Mayakun & Prathep, Reference Mayakun and Prathep2019). However, estimation of the carbon contribution by H. macroloba remains unexplored for most tropical seagrass-dominated areas where seagrass seems to both facilitate and compete with H. macroloba. So, the CaCO3 contribution by H. macroloba in the seagrass-dominated area should be different from that in the Halimeda-dominated area. Due to its diverse macrophyte community, Dongsha Island is an ideal research site to investigate the growth rate, number of new segments, standing stock and CaCO3 content of this carbonate sediment producer in seagrass-dominated settings. Therefore, understanding the standing stock of H. macroloba and its actual CaCO3 contribution in Dongsha Island would provide a valuable comparative insight into the carbonate contribution of Halimeda in the global context. The aim of this study was to estimate the standing stock and CaCO3 content of this species in a seagrass-dominated ecosystem and provide a better understanding of the potential role of H. macroloba as a CaCO3 producer in comparison to other Halimeda-dominated ecosystems. The outcome of this study will also benefit efforts to produce a better global estimate of carbonate production by H. macroloba.
Materials and methods
Study site
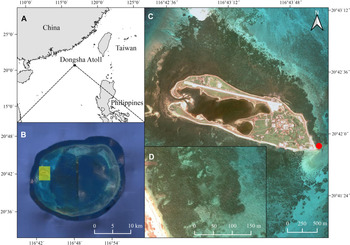
The Dongsha Atoll is located on the northern part of the South China Sea and is 25 km in diameter (Figure 1A, B). This study was carried out at Dongsha or Pratas Island, located on the western margin of the Dongsha Atoll (Figure 1B). Dongsha Island is around 2.80 km long and 0.87 km wide. This site has two seasons: a winter season dominated by the north-east monsoon (October–April) and a summer season dominated by the south-west monsoon (May–September). The marine environment around Dongsha Island and its atoll provides different types of habitat, including seagrass beds, coral reef and a mixture of both. Halimeda macroloba and Caulerpa spp. (including C. cupressoides, C. oligophylla and C. sertularioides) are abundant seaweeds in the seagrass beds of Dongsha Island and its atoll (our own observations) (Supplementary Figure S1). Dongsha Island protects the lagoon from much of the disturbance caused by ocean waves. In addition, the water inside the lagoon is exchanged daily with water from outside the lagoon through north-western and south-western inlets, where the coral reefs are relatively less extensive with a mixture of corals and sandy substrates that allow the development of seagrass beds. Seven seagrass species have been identified around Dongsha Island: Cymodocea rotundata, Cymodocea serrulata, Halodule uninervis, Halophila ovalis, Syringodium isoetifolium, Thalassia hemprichii and Thalassodendron ciliatum (Chou et al., Reference Chou, Chu, Chen, Syu, Hung and Soong2018). This study was conducted in the seagrass beds on the east coast of Dongsha Island (Figure 1C) on 23 May–20 June 2019. The study site has sandy substrates and over 70% of the area was covered by seagrasses (Figure 1D). The seagrass meadows are broadly distributed in the shallow subtidal zones, ranging between 1.5 and 3 m in depth at low tide based on depth gauges during scuba diving. Nitrate and phosphate concentrations where we conducted our survey were roughly 0.16 and 0.11 μmol l−1 according to point measurements made over the course of our survey period (N = 3). Additionally, the water temperature was measured using HOBO Pendant Temperature/Light Data Loggers (Onset Computer Corporation, USA), averaging 30.9°C over the course of our survey.
Study site: (A) Location of Dongsha Island in the South China Sea; (B) Location of the main island (Dongsha Island) in the atoll; (C) Location of our surveyed site (labelled as the red dot) on the Dongsha Island; (D) The dark area surrounding the Dongsha Island is the seagrass bed.

Density of macrophytes
The density of macrophytes (i.e. H. macroloba, Caulerpa spp. and seagrasses) were measured using eight line transects of 50 m. Line transects were laid perpendicular to the shoreline, each 20 m apart. Two quadrats (50 × 50 cm) were placed at 5 m intervals along each line transect to estimate the density of macrophytes based on percentage cover of seaweeds and shoot density of seagrasses, resulting in a total of 176 quadrats in the surveyed 7000 m2 area.
Growth rate and calcium carbonate accumulation rate
To investigate the growth rate and calcification rate, 15 H. macroloba specimens with no epiphytes were collected from the site where Cymodocea rotundata and Syringodium isoetifolium were the dominant seagrass species. Halimeda macroloba thalli were stained with Alizarin Red-S (a concentrated solution = 1 g per 100 ml of seawater) for 10–12 h. Then, each sample was tied to a wooden stick and transplanted back into the field. After 7 days, the dyed thalli were collected and taken back to the laboratory at Tunghai University to measure growth and calcification rates. All thalli without their basal holdfast were cleaned of epiphytes and bleached in a 5–10% sodium hypochloride solution for 20–30 min until the thalli lost their green colour. The segments were separated into (1) the stained segments or old segments and (2) the unstained segments or new segments. The numbers of segments in each part were counted and dried in a drying oven at 65°C to constant dry weight. The dried segments were weighed and recorded. The dry weight of the unstained segments (new segments) was used to calculate the growth rate (g DW thallus−1 day−1). After the determination of the dry weight of the calcified segments, the new segments were decalcified in 5% hydrochloric acid for 10–15 min then rinsed with fresh water. These decalcified segments were placed in a drying oven at 65°C to achieve constant dry weight and then weighed to determine their somatic weight. The CaCO3 accumulation rate was calculated based on the difference in the dry weight of the calcified new segments and their somatic weight produced per thallus and per day (g CaCO3 thallus−1 day−1) (van Tussenbroek & van Dijk, Reference van Tussenbroek and van Dijk2007; Mayakun et al., Reference Mayakun, Bunruk and Kongsaeng2014; Mayakun & Prathep, Reference Mayakun and Prathep2019). The mean value was expressed in terms of per thallus because it can convert to annual CaCO3 production rate (g CaCO3 m−2 year−1) by multiplying CaCO3 thallus−1 day−1 by mean density and 365 days.
Segment CaCO3 content and number of aragonite crystals of life stages
To examine whether segment CaCO3 content increased with age, we measured CaCO3 content, number and width of aragonite crystals of each life stage of H. macroloba. In this study, four developmental stages were categorically defined in our H. macroloba samples as follows: stage 1: newly recruited plant; stage 2: young plant with 3–4 new segments and 1–2 levels of segment; stage 3: partially calcified plant with 3–4 levels of segment; and stage 4: mature calcified plant. We followed such developmental categorization according to the definition of Mayakun & Prathep (Reference Mayakun and Prathep2019). Unfortunately, stage 5: fertile plant with reproductive cells and stage 6: dead plant, were rarely found and could not be collected. For the segment CaCO3 content, 210 thalli were haphazardly selected and at least 10 thalli of each stage of H. macroloba were collected. All thalli without their basal holdfast were cleaned and brought back to the laboratory, Tunghai University. The number of both old and new segments in each thallus and stage was counted, and dried at 65°C to determine their calcified dry weight. Then, the segments were decalcified by placing in 5% hydrochloric acid for 10–15 min then rinsed with fresh water for several times. These decalcified segments were dried at 65°C and then weighed afterward to determine their somatic weight. The segment CaCO3 content per segment of each life stage was derived from the difference in the dry weight of the calcified segments and their somatic weight (g CaCO3 segment−1). Dry segments of each stage were brought back to Prince of Songkla University, Thailand to examine the number and the width of aragonite crystals. For number of aragonite crystals, images of aragonite crystals were examined among the four life stages to calculate crystal numbers using a scanning electron microscope (SEM-Quanta) operating at 20 kV. Specimens at each of the four life stages were mounted on aluminium stubs using double-sided carbon adhesive tape, and sputter-coated with gold. An area of 1 μm2 was selected (N = 10 per stage), the aragonite crystals were counted (number μm−2) and the width of aragonite needles was measured.
Statistical analyses
Density of H. macroloba (number of thalli per quadrat; N = 88) was fitted using a general linear regression. We subsequently included principal coordinates of neighbour matrices (PCNM) eigenvectors to de-trend the spatial pattern of the density of H. macroloba (number of thalli per quadrat) and then included polynomial terms (degree of 1 and 2) of seagrass density. Each PCNM eigenvector and polynomial term of seagrass density were imported for the downstream analyses only if P-value was smaller than 0.05 and its inclusion increased the adjusted R 2. We partitioned the variation of the H. macroloba density into the seagrass spatial pattern effect and the seagrass density effect (Borcard et al., Reference Borcard, Legendre and Drapeau1992) and performed type III F-tests to examine the marginal effects. One-way analysis of variance (ANOVA) was used to test for differences in the number and the width of aragonite crystals and CaCO3 content among stages of H. macroloba. Tukey's multiple comparisons were used. All data were analysed using R statistical package and the software SPSS v. 13.0.
Results
The field survey revealed that Cymodocea rotundata and Syringodium isoetifolium were common and dominant species with 626.36 ± 26.58 and 290.93 ± 18.56 shoots m−2, respectively. Three common Caulerpa species were found in the seagrass beds in this area: C. cupressoides, C. oligophylla, C. sertularioides, with cover around 0.09 ± 0.06%, 7.93 ± 0.99%, 0.19 ± 0.11%, respectively. Coral cover was around 3.51 ± 0.90%. The mean density of H. macroloba was 8.82 ± 1.57 thalli m−2. Given that our surveyed area is 7000 m2, the standing stock of this species was estimated at 61,740–72,730 thalli (calculated as mean density multiplied by the area of occurrence). Our PCNM analyses revealed that the distribution of H. macroloba is spatially clustered in certain regions in our surveyed area (Figure 2A). A total of seven different spatial clusters of H. macroloba were extracted by the PCNM analyses (Supplementary Figure S2). The variation partitioning analysis revealed that the spatial clustering of seagrass contributed to about 37% (F = 6.686, df = 7, 78; P < 0.001) of total variance in terms of the distribution pattern of H. macroloba, followed by the seagrass density contributing 5% (F = 3.287, df = 2, 78; P = 0.043) of the total variance on the H. macroloba distribution (Figure 2B). As expected, without removing the effect of spatial factor that is likely associated with other unmeasured abiotic and biotic factors, we did not observe a significant relationship between H. macroloba density and seagrass density (total R 2 = 0.018, adjusted R 2 = −0.006, F = 0.762, df = 2, 85; P = 0.470; Figure 2C). However, after de-trending the spatial factor (treated as a confounding factor herein given that we want to explore whether or not the seagrass competition (or density) might have any influences on the density of H. macroloba), the seagrass density (i.e. the main biotic factor measured in this study) and its quadratic term were entered to increase the goodness of fit (multiple R 2 = 0.386, adjusted R 2 = 0.315; Figure 2D), and we observed a trend that H. macroloba was more dominant and associated with seagrass at densities of 150–400 shoots m−2 and decreased when it occurred with seagrass densities below 100 or above 400 shoots m−2 (Figure 2D).
(A) Principal coordinates of neighbour matrices (PCNM) results showing the spatial distribution of H. macroloba in our surveyed area; (B) relative effects of the spatial structure and seagrass shoot density on H. macroloba distribution; (C) the relationship between H. macroloba density and seagrass density before; (D) after the spatial de-trend.

Thalli of H. macroloba produced 1–2 new segments day−1, giving a daily dry weight growth rate per thallus of 0.003 ± 0.001 g. Multiplying mean density by daily growth rate, the daily increase of algal biomass was calculated to be 0.03 g DW m−2 day−1 or 9.66 g DW m−2 year−1. It was estimated that in each square metre H. macroloba produced around 8.82–17.64 new segments per day.
For the CaCO3 accumulation rate, H. macroloba accumulates CaCO3 around 0.002 ± 0.001 g CaCO3 thallus−1 day−1 or 6.44 g CaCO3 m−2 year−1. The mean CaCO3 content of H. macroloba was around 0.32 ± 0.05 g CaCO3 thallus−1. For the segment CaCO3 content of each stage, the segment CaCO3 content was assessed from a total of 1301 segments and 59 individual thalli. The segment CaCO3 content increased with age and H. macroloba accumulated less CaCO3 in stage 1 than in stages 2, 3 and 4 (Figure 3). The lowest CaCO3 content was found in stage 1 and the highest content was found in stage 3 (0.014 ± 0.004 and 0.044 ± 0.004 g CaCO3 segment−1, respectively). There was a significant difference in CaCO3 content among the 4 stages (P < 0.05).
CaCO3 content at each studied life stage of H. macroloba: Boxes illustrate the 25th, 50th and 75th percentiles. Whiskers indicate the 10th and 90th percentiles. Different letters (a, b, c) indicate significant differences among groups (Tukey, P < 0.05).

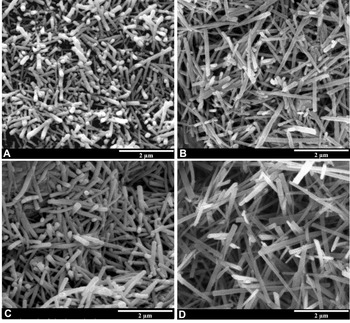
For the aragonite crystals, the highest number of crystals was found in stage 2 with 16.65 ± 0.57 crystals μm−2 and the lowest number of crystals was found in stage 4 with 14.00 ± 0.58 crystals μm−2 (Figure 4A). There was a significant difference in the number of aragonite crystals between the four stages of H. macroloba (P = 0.013). The number of aragonite crystals was significantly greater in stage 2 than in stages 1 (P = 0.01) and 4 (P = 0.005). The crystals of stage 3 were the widest at 0.15 ± 0.01 μm and the crystals in stage 1 were the thinnest at 0.11 ± 0.00 μm. There was a significant difference in the width of crystals between the four stages (P < 0.001) (Figure 4B). SEM photos of aragonite crystals showed that thin and short aragonite needles presented in stage 1 specimens and wider aragonite needles presented in specimens from stages 2, 3 and 4 (Figure 5).
(A) Number and (B) width of aragonite crystals in each studied life stage of H. macroloba: Box plots illustrate the 25th, 50th and 75th percentiles. Whiskers indicate the 10th and 90th percentiles. Different letters (a, b, c) indicate significant differences among groups (Tukey's post hoc test, P < 0.05).

Scanning electron microscope (SEM) photographs show aragonite crystals from specimens of H. macroloba at four stages of development: (A) newly recruited plant; (B) young plant with 3–4 new segments and 1-2 levels of the segment; (C) partially calcified plant with 3–4 levels of the segment; (D) mature and calcified plant. Scale bar = 2 μm.

Discussion
This study is the first to estimate the standing stock, growth rate, CaCO3 accumulation rate, aragonite crystal numbers and CaCO3 content of H. macroloba in the rarely studied Dongsha Island in the South China Sea. This study provides baseline data and an understanding of the potential role of H. macroloba as a CaCO3 contributor to the marine carbonate budget and in comparison to other Halimeda-dominated ecosystems. Such baseline data can improve the rough global estimate of carbonate production in H. macroloba. We observed that H. macroloba grows fast, producing 1–2 new segments day−1. Overall, annual biomass and CaCO3 production were low in Dongsha Island because these are determined by H. macroloba density, which can be influenced by many abiotic and biotic factors. However, in this study, we found that seagrass density is not the main driver regulating H. macroloba density although our statistical analysis reveals that seagrass density can play a role in regulating H. macroloba density. Thus, the low annual biomass and CaCO3 production in the seagrass-dominated ecosystem in Dongsha Island might be largely controlled by other factors, instead of seagrass competition. The growth rate of H. macroloba is estimated in the literature to be 0.0015-0.021 g thallus−1 day−1, implying the production of 1–2 new segments per day, and CaCO3 production ranging between 1.87 (the lowest estimate) and 908.11 (the highest estimate) g m−2 year−1 (Sinutok et al., Reference Sinutok, Pongparadon and Prathep2008; Mayakun et al., Reference Mayakun, Bunruk and Kongsaeng2014; Mayakun & Prathep, Reference Mayakun and Prathep2019). Our growth rate and annual CaCO3 production estimation (0.003 g thallus−1 day−1 and 6.44 g m−2 year−1, respectively) fell within the lower limits of studies conducted in mono-specific patches of H. macroloba in the tropical intertidal ecosystem (Table 1). Davis & Fourqurean (Reference Davis and Fourqurean2001) showed that the interspecific competition among seagrass, Thalassia testudinum (400–800 short- shoots m−2) and Halimeda incrassata (100 thalli m−2) in mature seagrass bed decreased the growth rate and size of Halimeda thalli by competing for nitrogen resources. Other than nutrients, seagrass is also a superior competitor for space and light after its establishment and can decrease algal abundance (Barry et al., Reference Barry, Frazer and Jacoby2013). Thus, the low production of H. macroloba estimated in this study is partially because H. macroloba in Dongsha Island coexists with the large seagrass species – Cymodocea and Syringodium – that impose an interspecific competition for resources such as space, nutrients and light. In results comparable to this study, Sinutok et al. (Reference Sinutok, Pongparadon and Prathep2008) and Sinutok (Reference Sinutok2008) reported a low growth rate and CaCO3 production for H. macroloba at Tangkhen Bay, Phuket, Thailand (Table 1). In their study site, H. macroloba, however, experienced very low interspecific competition from the seagrass, Halophila ovalis, which grew primarily underneath H. macroloba. Thus, the low growth rate and CaCO3 production of Halimeda may be explained by other factors in their study. Personal communications with the authors indicated that high sedimentation and strong wave action are present at the Tangkhen Bay site. These two physical disturbances could explain the unexpectedly low growth and carbonate accumulation in Halimeda. Without seagrass competition, high sedimentation, and strong waves, Mayakun et al. (Reference Mayakun, Bunruk and Kongsaeng2014) and Mayakun & Prathep (Reference Mayakun and Prathep2019) showed much higher density, growth rate and CaCO3 production of H. macroloba at Ko Mat Sum, in the Gulf of Thailand (with mean density of 11.70 ± 1.77 thalli m−2) and Lidee Island in the Andaman Sea (with mean density of 44.42 ± 13.95 thalli m−2), respectively.
Comparison of CaCO3 production for Halimeda in situ

nr, not reported.
Seagrass has been shown to compete with Halimeda for space, light and nutrients (Davis & Fourqurean, Reference Davis and Fourqurean2001; Barry et al., Reference Barry, Frazer and Jacoby2013) and limit the Halimeda establishment at higher seagrass densities. Thus, we expect to observe a negatively correlated relationship between Halimeda density and seagrass density if they indeed compete with each other for resources. From our field survey, we unexpectedly observed that the density of H. macroloba seems to reach a peak when the seagrass densities range between 150–400 shoots m−2. In other words, the density of H. macroloba is lower when the shoot density of seagrasses is below 100 or above 400 shoots m−2. Harney & Fletcher (Reference Harney and Fletcher2003) showed that the low or moderate density of seagrasses can benefit the recruitment of algal germlings by providing space, reducing strong wave action and trapping and stabilizing sediments. But, if the seagrass density is too high, seagrass would over-compete H. macroloba. Thus, our observation might partially support the ‘resource competition’ point of view when the seagrass density is not too high. In contrast, we observed a trend that H. macroloba density is low when seagrass density is also low. Additionally, we often observed bite marks on segments of H. macroloba in low seagrass density. A follow-up field study using a video camera revealed that H. macroloba was quickly consumed by herbivorous fishes such as parrotfishes within 1–2 days when we placed H. macroloba in bare sands whereas those placed in the seagrass beds were not (data not shown). According to these observations, we hypothesize that the moderate density of seagrasses might benefit H. macroloba by providing it with a refuge and reducing the grazing impact from herbivorous fishes. Thus, H. macroloba density that reaches a peak between low and high density of seagrasses could possibly be the outcome of the ecological trade-off between herbivorous grazing and seagrass competition. Alternatively, the sand size or microhabitat type at the edge of the seagrass bed in which the ecosystem transits from a seagrass-dominated to a coral-dominated area might not be suitable for the growth of both seagrasses and H. macroloba in our surveyed area. The relative contribution of unmeasured biotic (e.g. grazing) and abiotic (e.g. microhabitat type) factors on the spatial distribution of H. macroloba await further examination.
In this study, we found that CaCO3 production significantly varied with different age in H. macroloba. The CaCO3 content and number of crystals increased with age, being highest in stages 2, 3 and 4. Small and short aragonite needles were found in new segments in early stages and wider aragonite needles were found in later stages. The trend that emerged from the present study was similar to that reported from Thailand by Mayakun & Prathep (Reference Mayakun and Prathep2019) who found the lowest number of crystals and short needles in stages 1 and 2 while small, long needles were found in stages 3 to 6, indicating that aragonite deposition increased with age. Borowitzka & Larkum (Reference Borowitzka and Larkum1977) suggested that the calcification of Halimeda coincides with growth and development, peripheral utricles fusion and photosynthesis. Once CaCO3 was precipitated, the crystals began as small granules and then the deposition spread over the entire intercellular space. Overall, these observations raise an interesting question as to whether or not the CaCO3 production of Halimeda under different developmental stages can also be regulated by the seagrass density. Although it is beyond the scope of this study, the effects of the ecological trade-off between seagrass competition and grazing pressure on CaCO3 production in Halimeda would be an interesting topic for further examination.
This study supported the view that H. macroloba has a role in CaCO3 production. Although untested, our preliminary observations suggested that shading by seagrass might be detrimental to the growth rate and CaCO3 production of H. macroloba in this area. Qualitative and quantitative studies based on population dynamics, standing stock, reproduction and accurate measurement of growth rate and CaCO3 production are very important and useful in monitoring of Halimeda populations and estimation of CaCO3 production by the species. Unlike the Halimeda-dominated ecosystems observed in tropical areas such as Thailand, competition with seagrasses might impose an adverse condition for the occurrence of H. macroloba in the seagrass bed in this tropical area. Nevertheless, the co-occurrence of H. macroloba and seagrasses is a common ecological phenomenon in Dongsha Island in comparison to tropical areas where these two benthic organisms rarely co-occur abundantly. Based on our field observations about the grazing pressure on the H. macroloba populations in low density seagrass beds or bare sands at the edge of seagrass beds, we hypothesize that the moderate density of seagrasses might serve as a refuge to relieve H. macroloba from the grazers (i.e. the seagrass-refuge hypothesis). Dongsha Island is located in an area of the South China Sea that is predicted to be highly impacted by climate change (Tkachenko & Soong, Reference Tkachenko and Soong2017). Thus, the co-occurrence of H. macroloba and seagrass in Dongsha Island provides an interesting ecological setting to further explore the trade-off between interspecific competition and grazing and the effect of changes in unmeasured factors (e.g. microhabitat types) on their spatial distribution.
Supplementary material
The supplementary material for this article can be found at https://doi.org/10.1017/S0025315420001113
Acknowledgements
The authors would like to express gratitude to Professor Keryea Soong for providing a grant to conduct this research and for accommodation at the Dongsha Atoll Research Station (DARS). We would also like to thank Dr Chen-Lu Lee for assistance with fieldwork. Thanks to Mr Thomas Duncan Coyne for assistance with the English and Milica Stankovic for mapping in Figure 1.
Financial support
This study was financially supported by the Dongsha Atoll Research Station (DARS), managed by Taiwan's National Sun Yat-Sen University (NSYU) Sun Yat San (J.M.), the Dongsha Atoll Research Award (2019); and the Prince of Songkla University (PSU) (J.M., the International Research Grant 2019, SCI6202121N).