




No CrossRef data available.
DYNAMIC TAYLOR RULES AND THE PREDICTABILITY OF INTEREST RATES
Published online by Cambridge University Press: 14 July 2005
Abstract
Recent research shows that when commonly estimated dynamic Taylor rules, which are augmented with a lagged interest, are embedded in a variety of macroeconomic models, they imply a greater amount of predictable information about future movements in interest rates than is actually evident in the yield curve. We extend the analysis to consider more generally the predictability of the arguments of the Taylor rule—inflation and the output gap—in addition to the interest rate. Specifically, we compare the predictability of these three variables in a macroeconomic model with a dynamic Taylor rule to their predictability in real-time surveys of macroeconomic forecasters or a VAR model. We find that the strongest evidence against the dynamic Taylor rule is that while it is easy to predict the variables that enter the rule, it is very hard to predict actual interest rate changes. This disparity suggests that dynamic Taylor rules neglect important aspects of monetary policy behavior.
Information
- Type
- ARTICLES
- Information
- Copyright
- © 2005 Cambridge University Press
INTRODUCTION
In theoretical analyses of monetary policy, central bank behavior is often modeled as a Taylor (1993) rule, where the nominal interest rate is set as a linear function of current inflation and output, and typically the lagged interest rate. Empirical applications of this dynamic Taylor rule tend to find a large coefficient on the lagged interest rate, a finding that is often interpreted as deliberate interest rate smoothing by the monetary authorities [see, for instance, Clarida et al. (2000)].
Recently, this finding has been challenged. Rudebusch (2002b) argues that a large coefficient on the lagged interest rate would imply that future interest rate changes are highly predictable. However, yield curve evidence suggests that interest rate predictability is low, so Rudebusch concludes that the dynamic Taylor rule is a misspecified representation of monetary policy.
It is not clear, however, what drives the high predictability of interest rates in Rudebusch's model: whether it is due only to monetary policy inertia (the lagged interest rate), or whether it comes from predictability in inflation and output (the other variables that enter the Taylor rule). This paper tries to shed some light on this issue.1
Several other papers (English et al. (2003), Rudebusch and Wu (2003), and Gerlach-Kristen (2004)) have focused on the econometric properties of dynamic Taylor rules—in particular, the distinction between policy inertia and autocorrelated shocks. This is not the topic of the current paper.
It is therefore possible that the excess predictability in interest rate changes is driven by inertia in the aggregate demand and supply curves. To assess this possibility, we study the predictability of interest rate changes, inflation, and the output gap in survey data and VAR models. By comparing the predictability of these variables, we conclude that the dynamic Taylor rule is unlikely to be a good description of monetary policy. In particular, we find that the right-hand-side variables of the dynamic Taylor rule are fairly easy to predict, but it is more or less impossible to predict the interest rate changes (the left-hand-side variable).
The outline of the paper is as follows. Section 2 summarizes the findings of Rudebusch (2002b) who shows that estimated dynamic Taylor rules with interest rate smoothing imply much higher predictability of interest rate changes than what is suggested by yield curve data. Section 3 discusses the mechanism behind the high predictability of the dynamic Taylor rule and finds that the direct effect of interest rate smoothing is small and that most of the predictability of interest rate changes comes from predictability of inflation and the output gap. Section 4 brings in survey data and a few VAR models. It shows that the survey data and the VAR models support the yield curve evidence of low predictability and that there is little support for the dynamic Taylor rule. Section 5 discusses our findings and concludes.
THE PUZZLE
This section summarizes the findings of Rudebusch (2002b). The main message is that estimated dynamic Taylor rules imply a much higher predictability of interest rate changes than what yield curve data suggest.
Empirical Findings from Yield Curve Data
Rudebusch (2002b) focuses on the R2 from a prediction equation where quarterly interest rate changes, Δit+k = it+k − it+k−1, are regressed on lagged forward rates:

In this equation, it is the average federal funds rate in quarter t, and fk,t denotes the interest rate at the end of quarter t on a Eurodollar futures contract that settles k quarters ahead.2
For the Eurodollar rates, quarters are defined to start at the futures contract settlement dates (which occur about two weeks before the start dates of the usual quarters).
The reason for studying the performance of this particular prediction equation is that forward rates are believed to carry a lot of information about market expectations. For instance, if risk premia are constant (the expectations hypothesis of interest rates), then this equation should give the best possible forecast (in a mean square sense); that is, it should coincide with the mathematical expectation. In this case, fk,t = Etit+k plus a constant so that the regressor in (1) equals EtΔit+k.
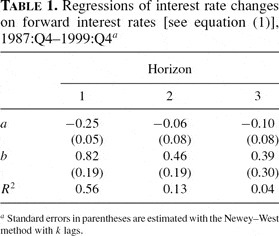
Equation (1) is estimated on quarterly U.S. data from 1987:Q4 to 1999:Q4, using a three-month Eurodollar futures as predictor. These futures contracts are based on the 90-day London Interbank Offered Rate, and have been traded since the mid 1980s. Table 1 reiterates the findings of Rudebusch (2002b): the R2 of (1) is very low beyond the first quarter (0.56 for k = 1, 0.13 for k = 2, and 0.04 for k = 3).
These results suggest that interest rate changes are not predictable beyond the first quarter. A possible counterargument is that futures rates are bad signals of expectations because of changes in risk premia. We later study this possibility in some detail (using, among other things, survey data), and conclude that the futures data probably have the same forecasting power as market expectations.3
Gürkaynak et al. (2002) reach a similar conclusion based on the forecasting power of different predictors. The literature on the expectations hypothesis of interest rates [see, for instance, Shiller (1990) and Froot (1989)] deals with a different, but related, topic. In terms of (1), that literature studies whether b = 1 (and possibly a = 0) without paying any particular attention to the R2. The approach here is the converse.

Role of the Dynamic Taylor Rule in a Calibrated Macro Model
The typical dynamic Taylor rule with interest rate smoothing is (constant omitted)

where it is a three-month T-bill rate (quarterly average),
annual (four-quarter) inflation in the GDP deflator, and yt is the output gap (the percentage deviation of real GDP from potential GDP).4
The choice of interest rate variable does not affect our results. The three-month T-bill rate and the average federal funds rate have a correlation of 0.99 in our sample (0.93 in first differences).
The analysis by Rudebusch (2002b) focuses on the effects of a high “interest rate smoothing” parameter (ρ), which is the typical result from most estimations of the dynamic Taylor rule. It is clear that ρ has a direct (autoregressive) effect on the predictability of the interest rate, but it is also likely to have indirect effects by affecting the predictability of inflation and the output gap. To study this, we use the dynamic Taylor rule in a New Keynesian–inspired empirical model estimated by Rudebusch (2002a). The model is specified for quarterly data and includes a Phillips-type supply equation and an IS-like demand equation:


where
is annual inflation, and εt and ηt are cost push and demand shocks, respectively.
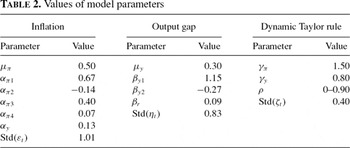
To parameterize the model, we choose the values for the α and β parameters and the standard deviations of the shocks εt and ηt estimated by Rudebusch (2002a), shown in Table 2.5
Estimated using OLS on quarterly U.S. data (with survey expectations) for the period 1968:Q3–1996:Q4.

For different values of the interest rate smoothing parameter ρ in equation (2), we solve and simulate the model (2)–(4) 2,000 times using 80 observations. In each simulation, we estimate the prediction regression

for the forecasting horizons k = 1, 2, 3. The regressor EtΔit+k is the model-consistent rational expectation of the interest rate change (calculated from the state vector of the model).
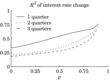
Figure 1 shows that R2 of the regression (5) increases with ρ. For instance, for the two-quarter horizon (k = 2), R2 = 0.21 for ρ = 0 but 0.55 for ρ = 0.8 (a common value in the empirical literature). The model results give so much higher R2 than the yield curve evidence in Table 1 that something must be wrong (with either the model or the yield curve evidence).

R2 of Δit+k in model simulations, 2000 simulations of 80 quarters.
FORECASTING IMPLICATIONS OF THE DYNAMIC TAYLOR RULE
This section analyzes the importance of the interest rate smoothing parameter (ρ) in the dynamic Taylor rule. The goal is to explain why and how this parameter matters for the predictability of interest rate changes and other model variables.
The first subsection demonstrates that the direct effect of ρ on the predictability of interest rate changes is unlikely to be large. The conclusion is that, in the model, a high ρ increases the predictability of interest rate changes by increasing the predictability of inflation and the output gap. The second subsection uses model simulations to show how this happens. The third subsection summarizes some general forecasting implications of the dynamic Taylor rule.
For this analysis, it is useful to rewrite the dynamic Taylor rule (2) as

The interest rate is changed for two reasons: the policy shock and the partial adjustment toward the “target” interest rate (
). The latter is the preferred interest rate in the absence of inertia and policy shocks—and corresponds to Taylor's original rule. The important forecasting implication of (6) is that forecasting the interest rate change is the same as forecasting the difference between the target interest rate and the lagged interest rate (the term in square brackets). For notational convenience, we refer to this deviation as the “target gap.”
Two Simple Analytical Cases
This section uses two stylized cases to argue that smoothing of the interest level does not necessarily imply predictability of interest changes: Smoothing gives predictability of the interest rate level, not the changes.
We first consider the simplest case when inflation and the output gap in the dynamic Taylor rule (6) are white-noise processes so all predictability in the interest rate change is due to the lagged interest rate—and therefore the ρ parameter. This case is easy to analyze since it becomes an AR(1) process: the R2 for the regression (5) is asymptotically given by (1 − ρ)/2 for the one-period horizon (see the Appendix for a derivation). This shows that the interest rate change becomes less predictable as smoothing (ρ) increases. In the limit (at ρ = 1) the interest rate level is a random walk with unpredictable changes.
In our second simple case, we let inflation and the output gap be predictable. To focus on the direct effect of ρ, we assume that inflation and the output gap are uncorrelated with lagged interest rates and the current policy shock. This eliminates the possibility that changing ρ affects their predictability. For the one-period horizon, we then have the R2 for the regression (5) (see the Appendix):

where R2πy measures the coefficient of determination from predicting
with its rational expectation. Note that (7) simplifies to the previous expression (R2 = (1 − ρ)/2) if inflation and the output gap are unpredictable. Otherwise, predictable inflation and output will help to make interest rate changes predictable—especially if the monetary policy shocks are small [which increases the ratio of variances in (7)]. However, the effect of increasing ρ is as before: A higher ρ reduces the predictability of interest rate changes.
In these examples, ρ has a negative effect on R2. Although the examples are highly stylized, they suggest that the direct (pure autoregressive) effect of ρ is unlikely to explain the higher R2 found in the model simulations. In the next section, we show that the basic mechanism is instead that a high ρ makes inflation and the output gap more predictable. In terms of (7), this would mean that a higher ρ also gives a higher R2πy.
Model Results
The preceding section suggested that the direct autoregressive effect is probably not able to explain the model results. We therefore take a second look at the model to see what happens as ρ increases. In particular, we use model simulations to find the R2 for prediction equations of the following type:

where xt+k is either annual inflation
, the output gap yt+k, or the target gap (
). The predictor, Etxt+k, is the model-consistent rational expectation of the dependent variable.
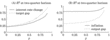
Figures 2A and B show the R2 from (8) for the two-quarter horizon. Figure 2B shows that the predictability of inflation is high (above 0.8) for all values of ρ, but becomes very high (0.9 or higher) at typical empirical values of ρ. The same figure also shows that the predictability of the output gap increases quite rapidly as ρ increases: R2 is 0.4 at ρ = 0.5 but 0.68 at ρ = 0.85.

R2 from using the optimal predictor (Etxt+k) in modelsimulations, two-quarter horizon, 2,000 simulations of 80 quarters.
As a consequence, the target interest rate (
) becomes highly predictable at high values of ρ, which carries over to the target gap—see Figure 2A. The increase in predictability is so rapid that it more than compensates for the fact that the target gap gets a lower weight (1 − ρ) in the dynamic Taylor rule (6) as ρ increases, and the unpredictable policy shock gets a relatively higher weight. This explains the high predictability of the interest rate changes in the same figure.
The reason for why a high ρ makes inflation and the output gap predictable is that monetary policy becomes fairly passive (in the short run) as the central bank smooths interest rate movements. For instance, a positive output shock is not met by a quick and large increase of the interest rate. Instead, the interest rate is increased slowly: the shock is allowed to affect the output gap. Since the output gap is partly autoregressive, this generates predictable movements. A similar story holds for the inflation shock/Phillips curve.
Compared with yield curve evidence, the model indeed implies too much predictability of interest rate changes—and this problem is larger for high values of ρ as pointed out by Rudebusch (2002b). This section has, however, shown that the effect of a high ρ is indirect, that is, it works through the predictability of inflation and the output gap. It is therefore hard to say where the problem with the model lies. It could be the dynamic Taylor rule, but it could equally well be that the Phillips curve or the aggregate demand equation are misspecified. The natural way of disentangling these effects is to bring in more direct evidence on the predictability of inflation and the output gap, which we do in Section 4. Before we do that, we take a careful look at the dynamic Taylor rule to point out some further implications for forecasting.
Forecasting Interest Rate Changes and the Target Gap
According to the dynamic Taylor rule (6), predicting interest rate changes is the same thing as predicting the target gap (
). This section outlines the forecasting implications, which are studied on survey data and a VAR model in Section 4.
First, if it is possible to predict the target gap, then the dynamic Taylor rule implies that it is possible to predict interest rate changes, too. To verify that this indeed holds in the macro model discussed earlier, we compute the R2 of the prediction equation (8). The first three columns of Table 3 show the results. The target gap is highly predictable in the model and the interest rate changes are somewhat less predictable because they are hit by the unpredictable policy shocks, but the difference will not be large unless the policy shocks are really volatile (discussed in some detail later).

Second, the dynamic Taylor rule implies that the best predictor of the interest rate change, EtΔit+k, should predict interest rate changes and the target gap about equally well. To study this, we compute the R2 from the following prediction equation:

The last three columns in Table 3 show that, in the model, EtΔit+k predicts both interest rate changes and the target gap well.
Third, the dynamic Taylor rule also implies that the best predictor of interest rate changes, EtΔit+k, should be close to an optimal predictor of the target gap. To study this, we compare the R2 of (9) and (8). The second line in Table 3 shows that EtΔit+k is indeed a very good predictor of the target gap in the model—the difference to the optimal predictor is negligible.
In Section 4, we study whether these implications are verified by survey data and a VAR model. We hope that this will reveal whether the predictability (if any) in interest rate changes is actually generated by the mechanism in the dynamic Taylor rule. Note that these implications follow directly from the dynamic Taylor rule—and do not depend on the rest of the model.
OTHER EVIDENCE ON PREDICTABILITY
This section studies what survey data and a VAR model can tell us about the predictability of interest rate changes, inflation, the output gap, and the target gap. This can help to assess the yield curve evidence and dynamic Taylor rule in at least two ways. First, it gives new measures of the predictability of interest rate changes, which can help us to decide which is closer to the truth: the yield curve evidence (low predictability) or the results from the estimated/calibrated model (high predictability). Second, it gives direct evidence on the forecasting implications of the dynamic Taylor rule. In particular, it can tell us if forecasting the interest rate change is indeed the same as forecasting the target gap.
As a background, Figure 3 shows the ex post data we use. Our sample period starts in 1987:Q4 and ends in 1999:Q4. The interest rate is the average of daily interest rates (in percent, annual basis) on a three-month Treasury bill, the annual inflation rate is the four-quarter change (in percent) in the GDP deflator (seasonally adjusted), and the output gap is the deviation (in percent) of real GDP (chained 1996 dollars, seasonally adjusted) from potential GDP as estimated by the Congressional Budget Office [see Congressional Budget Office (1995)].6
Data sources: Bureau of Economic Analysis (inflation), Federal Reserve Bank of St. Louis (GDP and interest rate), Congressional Budget Office (potential GDP), and Federal Reserve Bank of Philadelphia (survey data).
(using the parameters in Table 2). The interest rate changes and the target gap look fairly similar for the first half of the sample, but quite different for the second half. Both have jagged patterns, whereas inflation and the output gap are smoother.

U.S. macro data 1987:Q4–1999:Q4.
Survey Data
This section shows that survey data suggest little predictability of interest rate changes, and that the implications of the dynamic Taylor rule are not supported.
The survey data are from the Survey of Professional Forecasters (SPF), which is a quarterly survey of some 30 forecasters' views on key economic variables. The respondents, who supply anonymous answers, are professional forecasters from the business and financial community. See Croushore (1993) for further details.
It is well established, in both theory and practice, that some kind of combination (mean or median) of several different methods/forecasters typically increases the forecast precision, and that such combined forecasts are hard to beat with any method [see, for instance, Grangera and Ramanathan (1984)]. We therefore use the median of the individual forecasts of the three-month T-bill rate, quarterly GDP deflator inflation, and real GDP (GNP before 1992). From these data, we calculate the implied forecasts of the variables that enter the dynamic Taylor rule: interest rates changes, annual (four-quarter) inflation, and the output gap (assuming that potential output over the next four quarters is known).
The results for the survey data are summarized in Table 4. The first three columns show results from regressions of the same type as (8), that is, with the survey forecast of the same variable (“Etxt+k”) as predictor. For the interest rate changes, the results are very similar to the yield curve evidence in Table 1: some predictability at the one-quarter horizon, but none for longer horizons. If anything, the survey data suggest even less predictability than the yield curve data. It seems relatively safe to conclude that market expectations of interest rate changes have had low predictive power—in contrast to the model results.

The survey data therefore suggest that something is wrong with the model. But what? With the information we have so far, we cannot really be sure that the dynamic Taylor rule is at fault—it could equally well be that the Phillips curve and the aggregate demand curve generate too much predictability. Moreover, the dynamic Taylor rule implies that forecasting Δit+k is pretty much the same thing as forecasting the target gap (
)—see Section 3.3. This should hold irrespective of what the rest of the model looks like and is therefore a way of assessing the dynamic Taylor rule directly. Table 4 provides evidence on these issues.
First, the survey is pretty good at forecasting the target gap (by using the implied survey forecast of the target gap itself), but bad at forecasting interest rate changes. As mentioned earlier, this could possibly be explained by unpredictable policy shocks (or other omitted, unpredictable, variables). However, the difference in R2 is so large (for instance, 0.56 versus 0.05 on the two-quarter horizon) that this would require implausibly large policy shocks. For instance, the policy shocks (or omitted variables) would have to be 10 times more volatile (in terms of the standard deviation) than in the model calibration to push the R2 of the interest rate changes down to something like 0.20. However, if so much of the policy rule is driven by shocks (or omitted variables), then the rule becomes fairly uninteresting as a description of actual policy. Notice that this finding is not sensitive to the relative weights on inflation and the output gap in the dynamic Taylor rule (we use the traditional values,
) since both inflation and the output gap are quite predictable over the next few quarters.
Second, it could actually be argued that “ EtΔit+k” (the forecast of the interest rate change) does predict interest rate changes and the target gap equally well. That is, equally poorly: The R2 is very low (with the possible exception of interest rate changes at the one-quarter horizon).
Third, the interest rate forecasts are far from being an optimal predictor of the target gap. For instance, at the two-quarter horizon, using “Etxt+k” as the predictor gives an R2 of 0.56, but using “ EtΔit+k” as the predictor gives an R2 of 0.01.
The results in Table 4 are very hard to reconcile with a dynamic Taylor rule. It seems that the predictability of actual interest rate changes is more or less unrelated to the predictability of what the interest rate changes should be according to the dynamic Taylor rule. This is not too surprising since the data in Figure 3A showed large and persistent differences between the interest rate change and the target gap.
The reason for why the model generates too much predictability of interest rate changes is not that it generates too much predictability in inflation and the output gap, because survey data strongly suggest that these variables are quite predictable—see Table 4. The reason is instead that the model uses a dynamic Taylor rule.
Couldn't the model be saved by assuming a much lower interest rate smoothing parameter, ρ? Figure 2 shows that a much lower value of ρ would change the interest rate predictability in the right direction (although insufficiently so), but at the price of making the predictability in the output gap (and therefore the target gap) much too low. In these experiments, we have assumed unpredictable policy shocks. In contrast, Rudebusch (2002b) suggests setting ρ = 0 and letting the policy shocks be autocorrelated. He shows that this brings down the predictability of interest rate changes in the model, while preserving good econometric properties of estimated policy rules. To study this, we simulate the model with the suggested policy rule ((2) but with ρ = 0 and ζt+1 = 0.85ζt + vt+1 where Std(vt) = 0.4). The results (not shown) indicate that the autocorrelated shocks make relatively little difference: The overall picture is the same as with just a low ρ discussed earlier.
VAR Model
This section repeats the steps in the survey data section, but with forecasts from a VAR model instead.
Table 5 shows the R2 from forecasts made by a VAR(3) model of interest rates, inflation, and the output gap. The VAR model is estimated on first differences and then transformed to fit our data definitions (quarterly interest rate changes, annual inflation, and output gap). To approximate the information set available to the futures market and the survey respondents, the VAR is estimated on a moving data window of 40 quarters. For instance, the forecasts made in 1987:Q4 use a VAR model estimated on 1978:Q1–1987:Q4, while the forecasts made in 1988:Q1 use a VAR model estimated on 1978:Q2–1988:Q1, and so forth. The VAR results confirm most of the findings from survey data: Interest rate changes are not predictable, it is possible to forecast the target gap but not interest rate changes, and the forecast of interest rate changes is far from an optimal predictor of the target gap.

It may seem surprising that the VAR results are so different from the model simulations. After all, the model (2)–(4) is a dynamic system with a few lags, and so, its reduced form is essentially a low-order VAR system. It is then a bit strange that an estimated VAR produces so much less predictability than an estimated/calibrated model (especially for interest rate changes). There may be several explanations for this, but we believe that the tendency for OLS to overfit in small samples plays an important role.
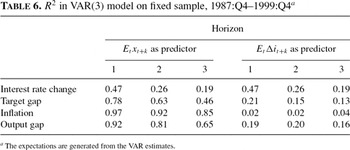
To illustrate this, we reestimated the VAR on a fixed sample (1987:Q4–1999:Q4). The results are shown in Table 6. The most striking result is that the interest rate changes appear to be much more predictable than in the VAR estimated on a moving data window (see Table 5). Some experimenting with the VAR system (estimating some equations on a fixed sample and other equations on a moving data window) suggests that most of the difference is due to the interest rate equation.
The intuition for this result is that the VAR is estimated with OLS, which always tries to maximize the in-sample R2 of the one-step-ahead forecasts. With many coefficients to pick, OLS typically can create a good fit in small samples. Since the macro model (2)–(4) is estimated in a fairly similar way, we believe that part of the high predictability in the model is caused by similar in-sample overfitting—perhaps mostly in the estimated dynamic Taylor rule.

DISCUSSION
Taylor (1993) argued that the Federal Reserve should, and indeed had (during 1987–1992), set the federal funds rate as a simple linear function of the current levels of inflation and the output gap. It was clear already from Taylor's analysis, however, that there had been persistent deviations between actual monetary policy and the interest rate implied by the simple Taylor rule. For the main arguments Taylor wanted to make, the deviations are not very important. In empirical estimates of reaction functions of the Taylor type, the deviations result in a high coefficient on the lagged interest rate. It has been debated whether this reflects deliberate interest rate smoothing or misspecification of the policy rule.
Rudebusch (2002b) argues that empirical dynamic Taylor rules are misspecified. One argument that he uses to support this claim is that typical estimates of the coefficient on the lagged interest rate imply that interest changes should be much more predictable than they seem to be. Rudebusch derives the theoretical predictability from a New Keynesian model augmented by a dynamic Taylor rule and compares the result with the predictive power of forward interest rates. However, the discrepancies between the theoretical implications and the yield curve evidence could be due to mechanisms other than the dynamic Taylor rule. The New Keynesian model could be a misspecification of the processes driving inflation and output, or the forward rates might be bad predictors because of time-varying risk premia.
In this paper we study the predictability of all the variables that enter the dynamic Taylor rule: the interest rate, the inflation, and the output gap. By comparing model results with evidence from the yield curve, survey data, and a VAR model, we support Rudebusch's critique of the dynamic Taylor rule. We find that interest rate changes are not predictable, but inflation and the output gap are. The fact that the right-hand side of the dynamic Taylor rule is quite predictable, but interest changes are not, shows that there are problems with the dynamic Taylor rule. Our evidence also shows that a lower coefficient on the lagged interest rate is unlikely to solve the problem. Although a lower coefficient can improve some macromodels, it does not overcome the survey and VAR evidence that the two sides of the Taylor rule do not match up.
What does this tell us about monetary policy? It is nowadays generally agreed that monetary policy should be predictable and therefore based on some fairly easily understood rules. Yet, interest rate changes are largely unpredictable. One possibility is that the low predictability of interest rate changes is due to monetary policy being entirely unsystematic, that is, interest rate changes are largely driven by monetary policy shocks. This does not seem very likely. Another possibility is that monetary policy responds systematically to other kinds of shocks than those considered in the dynamic Taylor rule (as assumed, for instance, in analyses of monetary policy using identified VARs). The nature of those shocks remains to be investigated.
It should be stressed that the fact that interest rate changes are unpredictable does not imply that monetary policy is erratic. It is highly unlikely that the policy instrument follows a random walk, but the fact that a random walk is a good approximation reflects the fact that the interest rate level is very persistent. It remains to be shown under what circumstances this would be an optimal monetary policy.
An alternative to the dynamic Taylor rule formulation of monetary policy is the targeting rule approach advocated by, for instance, Svensson (2003). In another paper (Söderström et al., 2005), we show that the Rudebusch model with optimal discretionary monetary policy can be made to match some stylized facts of the U.S. economy, assuming that the central bank has a large preference for interest rate smoothing, but virtually no preference for stability of the output gap. Interestingly, preliminary results suggest that the calibrated model implies fairly low predictability of interest rate changes, while inflation and output are very predictable, in line with the empirical results in this paper. These results indicate an interesting avenue for future research.
APPENDIX
R2 WHEN it IS AN AR(1) PROCESS
The R2 of Δit = a + bEt−kΔit + ut is the explained variation divided by the total variation, that is, R2k = Var(Et−kΔit)/Var(Δit).
Write (2) as it+1 = ρit + εt+1 where εt+1 is i.i.d. with variance σ2. It follows that

and

Direct calculations then give

and

Dividing gives

where k = 1, 2, … is the forecasting horizon. Note that this holds even if σ2 depends on ρ as it does if we think of εt+1 in the AR(1) as representing
from (2).
DERIVATION OF (7)
Write (6) as

The R2 for the one-period horizon is

Assume that inflation and the output gap are uncorrelated with the current policy shock and with the lagged interest rate. This implies that zt+1 is uncorrelated with it, and this carries over to the expectation Etzt+1 as well.
We can then use the dynamic Taylor rule, it+1 = (1 − ρ)zt+1 + ρit + ζt+1, to find the variance of the interest rate as

We can also rewrite the R2 as

Use the expression for Var(it) to simplify this as

which is (7).
We are grateful to Richard Dennis, Nils Gottfries, Eric Leeper, Glenn Rudebusch, an anonymous referee, as well as seminar participants at ECB, Federal Reserve Bank of San Francisco, Sveriges Riksbank, University of New South Wales, University of Basel, University of St. Gallen, and Uppsala University for comments; and to Glenn Rudebusch for providing the yield curve data. The views expressed in this paper are solely the responsibility of the authors and should not be interpreted as reflecting the views of the Executive Board of Sveriges Riksbank.
References
Clarida Richard,
Jordi Galí and
Mark Gertler
2000
Monetary policy rules and macroeconomic stability: Evidence and some theory.
Quarrterly Journal of Economics
115,
147–
180.Google Scholar
Congressional Budget Office
1995
CBO's Method for Estimating Potential Output.
Memorandum.
Croushore Dean
1993
Introducing: The survey of professional forecasters.
Federal Reserve Bank of Philadelphia Business Review
3–
13.Google Scholar
English William B.,
William R. Nelson and
Brian P. Sack
2003
Interpreting the significance of the lagged interest rate in estimated monetary policy rules.
Contributions to Macroeconomics
3,
1073.Google Scholar
Froot K.A.
1989
New hope for the expectations hypothesis of the term structure of interest rates.
Journal of Finance
44,
283–
304.Google Scholar
Fubrer Jeffrey C.
2000
Habit formation in consumption and its implications for monetary-policy models.
American Economic Review
90,
367–
390.Google Scholar
Fubrer Jeffrey C. and
George Moore
1995
Inflation persistence.
Quarterly Journal of Economics
110,
127–
159.Google Scholar
Gerlach-Kristen Petra
2004
Interest rate smoothing: monetary policy inertia or unobserved variables?
Contributions to Macroeconomics,
Working paper series 25B,
European Central Bank.
Granger Clive J. and
Ramu Ramanathan
1984
Improved methods of combining forecasts.
Journal of Forecasting
3,
197–
204.Google Scholar
Gürkaynak Refet S.,
Brian Sack and
Eric Swanson
2002
Market-Based Measures of Monetary Policy Expectations.
Finance and Economics Discussion paper 2002-40,
Board of Governors of the Federal Reserve System.
Rudebusch Glenn D.
2002a
Assessing nominal income rules for monetary policy with model and data uncertainty.
Economic Journal
112,
1–
31.Google Scholar
Rudebusch Glenn D.
2002b
Term structure evidence on interest rate smoothing and monetary policy inertia.
Journal of Monetary Economics
49,
1161–
1187.Google Scholar
Rudebusch Glenn D. and
Tao Wu
2003
A Macro-Finance Model of the Term Structure, Monetary Policy, and the Economy.
Working paper 2003-17,
Federal Reserve Bank of San Francisco.
Shiller R.J.
1990
The term structure of interest rates.
In B.M. Friedman and
G.H. Hahn (eds.),
Handbook of Monetary Economics,
Amsterdam:
Elsevier Science.
Söderström Ulf,
Paul Söderlind and
Anders Vredin
2005.
New-Keynesian Models and Monetary Policy: A Reexamination of the Stylized Facts.
Scandinavian Journal of Economics
(In press).
Svensson Lars E.O.
2003
What Is Wrong with Taylor Rules? Using Judgment in Monetary Policy Through Targeting Rules.
Journal of Economic Literature
41,
426–
477.Google Scholar
Taylor John B.
1993
Discretion versus policy rules in practice.
Carnegie-Rochester Conference Series on Public Policy
39,
195–
214.Google Scholar
Regressions of interest rate changes on forward interest rates [see equation (1)], 1987:Q4–1999:Q4a
Values of model parameters
R2 of Δit+k in model simulations, 2000 simulations of 80 quarters.
R2 from using the optimal predictor (Etxt+k) in modelsimulations, two-quarter horizon, 2,000 simulations of 80 quarters.
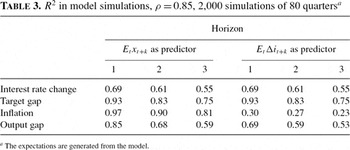
R2 in model simulations, ρ = 0.85, 2,000 simulations of 80 quartersa
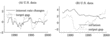
U.S. macro data 1987:Q4–1999:Q4.
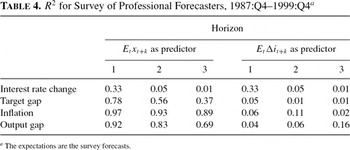
R2 for Survey of Professional Forecasters, 1987:Q4–1999:Q4a
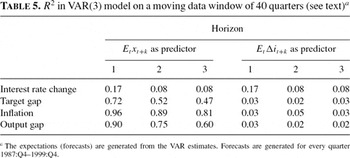
R2 in VAR(3) model on a moving data window of 40 quarters (see text)a
R2 in VAR(3) model on fixed sample, 1987:Q4–1999:Q4a
 You have
Access
- 27
- Cited by