INTRODUCTION
Herbage accumulation is determined by the tissue turnover of individual plants and by the patterns of regulation of the number of individuals in a plant population, i.e. tiller appearance and death. Both act jointly to enable swards to adapt to variations in growth and management conditions. Tissue turnover for individual plants occurs according to a priority pattern for the allocation of assimilates. During the vegetative phase of development, the main sinks are the leaf meristems, whose growth patterns are regulated by plant morphogenesis (Lemaire & Agnusdei Reference Lemaire, Agnusdei, Lemaire, Hodgson, Moraes, Nabinger and Carvalho2000). In turn, the plant population comprises individuals that interact with each other and are affected by and react to environmental conditions, altering their form and function (Lemaire Reference Lemaire, Gomide, Mattos and Da Silva2001) in a continuous cycle of interactions. For forage grasses, the plant population comprises the basal tillers and those originating from the activation and development of axillary buds, the aerial tillers (Jewiss Reference Jewiss1972). In the case of tussock species (bunchgrasses), the integration among the aerial (daughter) and parental tillers results in the formation of integrated physiological units (IPUs), which are autonomous in terms of assimilate sharing and allocation (Watson & Casper Reference Watson and Casper1984). This autonomy is determined by common vascular connections (VC) and root systems among plants within each IPU, in which the resources appear to be allocated to ensure similar growth potential for all individuals within the IPU (Derner et al. Reference Derner, Briske and Polley2012).
For Lemaire & Chapman (Reference Lemaire, Chapman, Hodgson and Illius1996), plant responses to defoliation may be seen as a means of re-establishing and maintaining the homoeostatic patterns of growth through which all resources are used to define an optimal path for plant growth. In that context, the mechanisms for restoring the photosynthetic surface following defoliation may involve an increase in the number of IPUs per unit ground area or an increase in the number of tillers per IPU (Derner et al. Reference Derner, Briske and Polley2012). The relative importance of a particular mechanism as a strategy for restoring sward leaf area appears to be dependent on environmental and management factors, which modify relationships with light within the canopy or through apical dominance and, consequently, among plant sinks, causing the activation of axillary buds (Murphy & Briske Reference Murphy and Briske1992). Defoliation strategies that favour the decapitation of apical meristems, such as long grazing intervals associated with severe grazing, may favour an increase in the number of tillers per IPU because they create stronger competition for light within the sward canopy (Casal et al. Reference Casal, Sanchez and Deregibus1986). Under those conditions, stem elongation and the accumulation of senescent and dead material in the central base of tussocks (Wan & Sosebee Reference Wan and Sosebee2002) favour the activation of axillary meristems rather than the initiation and development of basal tillers.
Experimental studies of Brachiaria decumbens cvar Basilisk under continuous stocking management have demonstrated that basal and aerial tillers, although genetically identical, may present different growth potential and tillering patterns depending on the structural and resource-sharing characteristics of the individuals within the IPUs (Santos et al. Reference Santos, da Fonseca, Gomes, da Silva and Pimentel2010). That may result in variations in the turnover of sward leaf and senescing tissues, interfering with net herbage accumulation and forage yield. According to Eissenstat & Caldwell (Reference Eissenstat and Caldwell1987), even though bunchgrasses may present similar characteristics in terms of phenological patterns of growth, biomass allocation, efficiency in water and nutrient use, seasonal patterns of tillering and the capture of light resources, they may differ quite significantly in their competitive ability with respect to how rapidly the ground area is occupied following defoliation and the manner in which that occurs. As a result, grazing management strategies that interfere with the proportion of basal and aerial tillers in the tiller population may define distinct patterns of growth and occupation of horizontal spaces and of the vertical profile of the sward canopy, with potential impacts on the components of herbage accumulation.
Elephant grass is a bunchgrass with erect stems forming well-defined tussocks (Alcântara & Bufarah Reference Alcântara and Bufarah1983). The abundant tillering and significant participation of aerial tillers in the tiller population (Corsi et al. Reference Corsi, Silva, Faria, Peixoto, Moura and Faria1996) suggest that grazing management strongly influences the growth dynamics of elephant grass and its herbage accumulation as it interferes with the regulatory processes between tiller classes in the tiller population. Although it is a forage grass widely known for its high potential for herbage production, the prevailing components and strategies of its growth are not fully understood.
Thus, the objectives of the present experiment were as follows:
-
(1) To describe variations in the population density of basal tillers (TPDb) and the population density of aerial tillers (TPDa) and the number of aerial tillers per supporting unit in elephant grass cvar Napier subjected to strategies of intermittent stocking management; and
-
(2) To determine the relative importance of basal and aerial tillers to leaf and stem growth, leaf senescence and net herbage accumulation in elephant grass cvar Napier.
MATERIALS AND METHODS
The present experiment was carried out at E.S.A. ‘Luiz de Queiroz’ (ESALQ), University of São Paulo, Piracicaba, SP, Brazil (22°43′S, 47°25′W and 554 m a.s.l.) on an elephant grass pasture (Pennisetum purpureum Schum. cvar Napier) established in 1970 on Eutroferric Red Nitosol. Since its establishment, the area has been grazed intermittently by dairy cows. The experiment began in January 2011, after an initial grazing of the experimental paddocks followed by mowing to 35 cm, and was conducted until April 2012. The measurements were grouped into six seasons of the year defined as follows: summer I (January–March 2011), autumn (April–June 2011), winter (July–September 2011), early spring (October–mid-November 2011), late spring (mid-November–December 2011) and summer II (January–April 2012). The average soil chemical characteristics of the 0–20 cm layer were pH CaCl2=5·9; organic matter=54·9 g/dm3; P (ion-exchange resin extraction method)=29·43 mg/dm3; Ca=117·5 mmolc/dm3; Mg=35·62 mmolc/dm3; K=3·4 mmolc/dm3; H + Al=53·93 mmolc/dm3; sum of bases=148·91 mmolc/dm3; cation exchange capacity=190·63 mmolc/dm3; and per cent base saturation=82%. According to the Köppen classification, the climate is Cwa (sub-tropical with dry winter) with an average annual rainfall of 1328 mm. The average air temperatures during the experimental period (January 2011–April 2012) followed the historical pattern of variation (1917–2012), with lower temperatures recorded in June 2011 (16·3 °C) and higher temperatures recorded in February 2012 (25·7 °C). Summer I (i.e. the period January–March 2011) was characterized by greater rainfall than summer II (January–March 2012). The rainfall began earlier (early spring) relative to the historical average (late spring), with lower precipitation during February and March 2012 (summer II). There were three periods of soil water deficit: in February 2011 (summer I), from July to the beginning of October 2011 (early spring) and from March to mid-April 2012 (late summer II).
The treatments corresponded to combinations of two post-grazing (post-grazing heights of 35 and 45 cm) and two pre-grazing conditions (0·95 and maximum canopy light interception during regrowth – LI0·95 and LIMax) and were allocated to experimental units (850 m2 paddocks) according to a 2×2 factorial arrangement and in a complete randomized block design, with four replications.
During the first pasture growing season (January–April 2011), a total of 250 kg N/ha was applied, with 80 kg/ha after mowing and 170 kg/ha in instalments during the remainder of the season. During the second pasture growing season (November 2011–March 2012), a total of 300 kg N/ha was applied in instalments throughout the season. Fertilizer applications were performed following grazing using a commercial N : P : K formula (20 : 0 : 8). Because the grazing interval was not constant (a consequence of the way the experimental treatments were defined), the amount of N applied to each paddock was divided across the grazing cycle and was proportional to the rest period for each paddock, ensuring that all of the paddocks had received the same amount of fertilizer by the end of the experiment.
Canopy light interception was monitored with a canopy analyser LAI 2000 (LI-COR, Lincoln, Nebraska, USA); measurements were taken on a weekly basis during regrowth until interception reached 0·90, when the measurements began to be taken every 2 days to ensure that the LI0·95 and LIMax targets were reached precisely. Maximum canopy light interception (LIMax) was attained when the recorded value did not change over two consecutive evaluations and corresponded to an average of 0·98. The effective values of canopy light interception for treatments LI0·95/35, LI0·95/45, LIMax/35 and LIMax/45 were 0·954, 0·956, 0·984 and 0·982, respectively. Readings were taken from six random sampling areas per paddock that were representative of the sward condition at the time of sampling (visual assessment of sward herbage mass and height). In each sampling area, one reading was taken above the canopy, and five were acquired at ground level, with a total of six readings above the canopy and 30 at ground level per experimental unit.
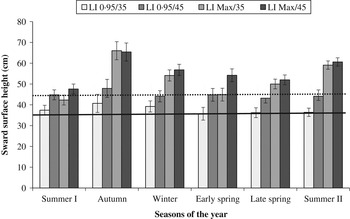
Sward height was monitored throughout each regrowth cycle using a stick graduated in cm through 80 systematic readings along four transect lines (20 readings per line) in each paddock. Readings of sward height were taken from ground level using the ‘leaf horizon’ on the top of the sward as a reference, even when the plants were reproductive and produced taller, flowering stems. Post-grazing heights were maintained as planned on the paddocks managed with the LI0·95 target but remained above the target for the LIMax condition (Fig. 1). Grazing was performed by dairy cows, both lactating and non-lactating, or dairy heifers, and the number of animals required to finish grazing in 10–12 h (day grazing only) was calculated using the mob stocking method (Gildersleeve et al. Reference Gildersleeve, Ocumpaugh, Quesenberry and Moore1987). The average grazing interval during the experiment was 23·6, 21·3, 32·4 and 29·4 days for treatments LI0·95/35, LI0·95/45, LIMax/35 and LIMax/45, respectively.
Post-grazing height (cm) of elephant grass cvar Napier subjected to strategies of intermittent stocking management from January 2011 to April 2012. Solid and broken lines represent the post-grazing height targets of 35 and 45 cm, respectively. Bars represent s.e.m., n=4.

Herbage accumulation was calculated based on the results of the evaluations of the morphogenetic and structural characteristics of the individual tillers. The measurements were obtained from tillers specifically marked for that purpose, with monitoring performed throughout the entire regrowth period. Six tussocks were chosen per experimental unit in representative areas of the average sward condition (visual assessment of height and basal area of the tussocks) at the time of the tagging procedure. In each tussock, five tillers were selected (minimum of two basal tillers) and identified using plastic rings (Bircham & Hodgson Reference Bircham and Hodgson1983). Tillers in both the central and peripheral areas of each tussock were selected to represent the average condition of the tussocks (Wan & Sosebee Reference Wan and Sosebee2000). A total of 30 tillers were marked per experimental unit, i.e. 120 tillers per treatment. Measurements were taken every 5 days during the seasons with fast plant growth (summer I and II and late spring) and every 7 days during seasons with slow plant growth (autumn, winter and early spring). At the end of each measurement period (i.e. the regrowth cycle), the marked tillers were harvested, and the lengths of the leaf lamina (expanding and mature (expanded+senescing) leaves) and the stems were measured separately for the basal and aerial tillers. The morphological components were hand separated and dried in a forced draught oven at 65 °C until a constant mass was reached. After weighing, a conversion factor (CF) between length and weight (g/cm) was calculated by dividing the total mass of each morphological component (g) by the total corresponding length (cm). Components of the herbage accumulation dynamics were calculated based on variation in the lengths of the leaf lamina and stems throughout the measurement periods. Positive variations in both leaves and stems were used to calculate the rates of leaf and stem elongation, respectively, while negative variations were used to calculate the rates of senescence. The resulting rates of elongation and senescence per tiller (cm/tiller/day) were used to calculate the rates of sward growth and senescence (kg/ha/day) using the CF generated for each morphological component for the basal and aerial tillers (CF of expanding leaves for the calculation of leaf growth, CF of mature leaves for the calculation of senescence, and CF of stems for the calculation of stem growth) and the corresponding average values of tiller population density (TPD) (Bircham & Hodgson Reference Bircham and Hodgson1983).The contribution of the basal and aerial tillers to sward growth and senescence was calculated as a proportion of the total growth and senescence (basal+aerial tillers). The rates of net herbage accumulation were calculated as the difference between the rates of leaf growth and senescence. The senescence-to-growth ratio was calculated for basal and aerial tillers and for the sward as the ratio between leaf senescence and leaf accumulation rates in kg/ha/day.
The TPD was determined by counting the number of tillers within three 0·75×1·25 m metallic frames positioned at points representative of the average sward condition at the time of sampling (visual assessment of herbage mass and height). This procedure was performed at three stages during regrowth: post-grazing, mid regrowth and pre-grazing. During each measurement event, all tillers within the frames were counted, and the data were used to calculate the average TPD values for each regrowth cycle. The counting considered three categories: basal tillers, aerial tillers and decapitated tillers with aerial tillers attached (referred to subsequently as vascular connections, VC). The data were used to calculate the number of aerial tillers per support unit, where the support unit corresponded to basal plus decapitated tillers (A/B+VC).
Analysis of variance was performed using the Mixed Procedure function in Statistical Analysis System (SAS®), version 8.2 for Windows®. The choice of the covariance matrix was made using the Akaike Information Criterion (AIC) (Wolfinger Reference Wolfinger1993), and the analysis was performed considering pre-grazing light interception, post-grazing height, tiller class (basal and aerial), season of the year and their interactions as fixed effects and the blocks as a random effect (Littell et al. Reference Littell, Milliken, Stroup and Wolfinger1996). Season of the year was treated as a repeated measure; when appropriate, the treatment means were calculated using the ‘LSMEANS’ statement, and comparisons were made using Student's t test at P< 0·05.
RESULTS
Tiller population density
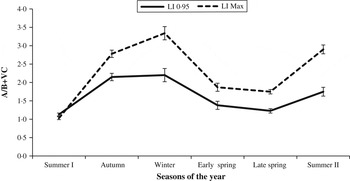
The number of aerial tillers per support unit (A/B+VC) varied with light interception pre-grazing (P<0·001), season of the year (P<0·001) and the LI pre-grazing×season of the year interaction (P<0·001). With the exception of summer I, the values followed a similar pattern of variation throughout the year, with greater values recorded during autumn and winter and smaller values recorded during early and late spring. The swards managed with the LIMax target had greater numbers of aerial tillers per support unit than the swards managed with the LI0·95 target from autumn onwards (Fig. 2).
Number of aerial tillers per support unit (A/B+VC) in elephant grass cvar Napier subjected to strategies of intermittent stocking management with pre-grazing targets of 0·95 and maximum canopy light interception from January 2011 to April 2012. Bars represent s.e.m., n=8.

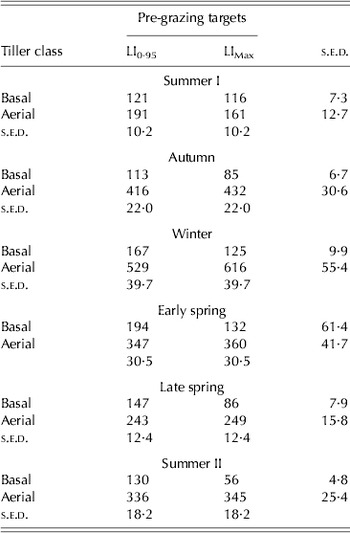
The TPD varied with season of the year (P<0·001), tiller class (P<0·001) and the interactions of post-grazing height×season of the year (P<0·05), LI pre-grazing×tiller class (P<0·05), tiller class×season of the year (P<0·001), and LI pre-grazing×tiller class×season of the year (P<0·001). For both of the LI pre-grazing targets during all seasons of the year, TPDa was greater than TPDb (Table 1). From autumn onwards, the swards managed with the LI0·95 target had greater TPDb than those managed with the LIMax target. Only during summer I did the swards managed with the LI0·95 target have greater TPDa than the swards managed with the LIMax target (Table 1).
Population density of basal and aerial tillers (tillers/m2) of elephant grass cvar Napier subjected to strategies of intermittent stocking management characterized by pre-grazing targets of 0·95 and maximum canopy light interception from January 2011 to April 2012

s.e.d. – Standard error of difference. n=8, d.f.=141 for both groups (pre-grazing targets and tiller class).
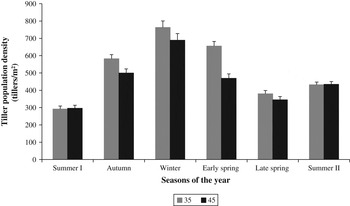
The pattern of variation in TPD throughout the experiment was similar for the treatments with post-grazing height targets of 35 and 45 cm, with values increasing from the beginning of the experiment in summer I until the winter, when the greatest TPD values were recorded. The TPD values decreased during early and late spring and then remained stable until the end of the experiment in summer II. There was a difference between the post-grazing height target treatments only during autumn and early spring, with greater TPD values recorded for the swards managed with a post-grazing height of 35 cm (Fig. 3).
Tiller population density (tillers/m2) in elephant grass cvar Napier subjected to strategies of intermittent stocking management with post-grazing height targets of 35 and 45 cm from January 2011 to April 2012. Bars represent s.e.m., n=8.

Components of total and net herbage accumulation
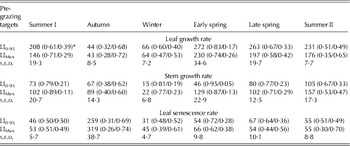
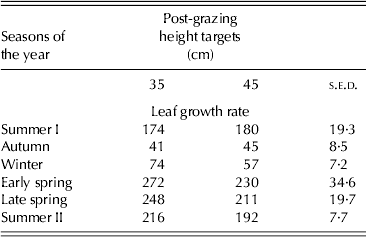
The leaf growth rate varied with LI pre-grazing (P<0·001), post-grazing height (P<0·05), season of the year (P<0·001), and the interactions of LI pre-grazing×season of the year (P<0·001) and post-grazing height×season of the year (P<0·05). In general, for both LI pre-grazing targets, lower leaf growth rates were recorded during autumn and winter, and higher rates were recorded during early and late spring (Table 2). There were differences between the LI pre-grazing targets during summer I, late spring and summer II, with greater rates recorded for the swards managed with the LI0·95 target. Similar patterns of variation were recorded throughout the year for the different post-grazing height target treatments, with the lowest leaf growth rates recorded in autumn, followed by those in winter. Differences between the post-grazing height target treatments were detected only during winter and summer II (Table 3), with greater leaf growth rates recorded for the swards managed at 35 cm v. those managed at 45 cm.
Rates of leaf and stem growth and leaf senescence (kg/ha/day) in elephant grass cvar Napier subjected to strategies of intermittent stocking management characterized by pre-grazing targets of 0·95 and maximum canopy light interception from January 2011 to April 2012

s.e.d. – Standard error of difference. n=8, d.f.=69.
* Numbers within parentheses represent the proportion of the basal/aerial tillers within the sward.
Leaf growth rate (kg/ha/day) in elephant grass cvar Napier subjected to strategies of intermittent stocking management with post-grazing target heights of 35 and 45 cm from January 2011 to April 2012
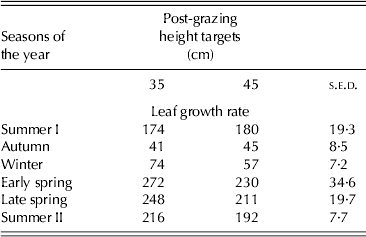
s.e.d. – Standard error of difference, n=8, d.f.=69.
The rates of stem growth varied with LI pre-grazing (P<0·001), post-grazing height (P<0·05), season of the year (P<0·001), and the LI pre-grazing × season of the year interaction (P<0·05). Lower rates were recorded during winter for both LI pre-grazing targets, with differences between the LI pre-grazing target treatments recorded only in early spring and summer II, when greater rates were recorded for the swards managed with the LIMax target relative to those managed with the LI0·95 target (Table 2). Overall, the swards managed at the 35 cm post-grazing height presented rates of stem growth that were 25% greater than that of the swards managed at 45 cm (91·4±6·89 and 73·1±6·89 kg/ha/day for the 35 and 45 cm targets, respectively).
Leaf senescence varied with season of the year (P<0·001) and the LI pre-grazing×season of the year interaction (P<0·01). In general, the rates of senescence followed a similar pattern of variation throughout the year, with higher rates recorded during autumn and lower rates during the remaining seasons of the year. Differences between the LI pre-grazing target treatments were detected only during winter, when the swards managed with the LI0·95 target exhibited lower leaf senescence rates than those managed with the LIMax target (Table 2).
The contribution of the tiller classes to leaf and stem growth and senescence is shown in Table 2. For swards managed with the LI0·95target, the basal tillers represented the largest contribution to leaf growth, except during autumn, when the aerial tillers contributed 0·68. For swards managed with the LIMax target, the basal tillers represented the largest proportion of leaf growth during summer I and early and late spring, with a greater contribution of the aerial tillers in autumn, winter, and summer II. During summer I, the aerial tillers contributed proportionately more to leaf growth than the basal tillers for the swards managed with the LI0·95 target compared with those managed with the LIMax target. However, from winter until the end of the experiment in summer II, a greater contribution of aerial tillers was recorded for the swards managed with the LIMax target. Overall, the basal tillers represented a major contribution to stem growth for both LI pre-grazing targets, except during autumn, when the largest contribution came from the aerial tillers. Differences between the LI pre-grazing targets for the same tiller class were recorded during summer I, when the swards managed with the LI0·95 target had a greater contribution of aerial tillers than did the swards managed with the LIMax target (0·21 and 0·11, respectively), and during summer II, when the inverse occurred, with the aerial tillers contributing 0·33 and 0·47 of the stem growth for the swards managed with the LI0·95 and LIMax targets, respectively. Leaf senescence originated essentially from the basal tillers for the swards managed with the LI0·95 target, except during winter, when 0·52 of the senescence originated from the aerial tillers. A greater proportion of the senescence originated from the aerial tillers for the swards managed with the LIMax target, except during early spring, when the basal tillers contributed 0·62. During autumn, c.0·70 of the senescence originated from the aerial tillers, regardless of the LI pre-grazing target used.
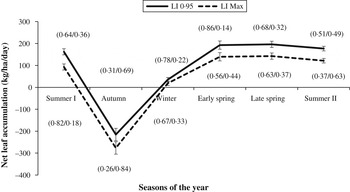
The net leaf accumulation varied with LI pre-grazing (P<0·001), season of the year (P<0·001) and the LI pre-grazing×season of the year interaction (P<0·05). Overall, the pattern of variation was similar for both LI pre-grazing targets, with lower rates recorded during autumn, followed by those recorded during winter. The recorded net leaf accumulation rates were greater for the swards managed with the LI0·95 target, except during autumn, when there was no difference between the LI pre-grazing targets (Fig. 4).
Rates of net leaf accumulation (kg/ha/day) in elephant grass cvar Napier subjected to strategies of intermittent stocking management with pre-grazing targets of 0·95 and maximum canopy light interception from January 2011 to April 2012. The numbers in parentheses represent the proportion contribution of the basal and aerial tillers to net leaf accumulation. Bars represent s.e.m., n=8.

DISCUSSION
Tussock-forming species have a modular clonal growth habit, with tillers grouped in a compact arrangement (Derner & Briske Reference Derner and Briske1998), a consequence of the small space between the meristems and the frequent recruitment of plants from axillary buds (Huber-Sannwald et al. Reference Huber-Sannwald, Pyke and Caldwell1996). This pattern of morphological organization, in which subunits as a group act as semi-autonomous structures in their assimilation, distribution and use of carbon, their patterns of transport, and their use of mineral nutrients and hormones (Watson & Casper Reference Watson and Casper1984), characterizes an IPU. In some species, successive generations from the same IPU function in a cooperative manner to allocate and use resources, whereas competition exists among IPUs within a tussock (Marshall Reference Marshall1996). Each IPU has a certain autonomy in its reactions to local environmental stimuli (Vuorisalo & Hutchings Reference Vuorisalo and Hutchings1996), which provides significant plasticity to the plant population in both the structural arrangement of the morphological components along the vertical profile of the sward canopy and the potential for nutrient capture and coverage of the soil surface (Derner & Briske Reference Derner and Briske1998). Although the strategies commonly used by plants are the result of a genetically controlled sequential development programme (Vuorisalo & Hutchings Reference Vuorisalo and Hutchings1996), changes in the strategy of growth for a given species during its developmental process (Hartnett & Bazzaz Reference Hartnett and Bazzaz1983) or in response to variations in environmental and management factors (Vuorisalo & Hutchings Reference Vuorisalo and Hutchings1996) may be a key factor for successful establishment and persistence of some plants.
Tillers that originate from axillary buds, the aerial tillers, share VC with the parental generations (Marshall Reference Marshall1996) and, as a result, are involved in cooperative relations (Vuorisalo & Hutchings Reference Vuorisalo and Hutchings1996; Stuefer Reference Stuefer1998) with them, in agreement with the IPU concept described above. In the current experiment, the swards managed with the LIMax target showed a greater number of aerial tillers per support unit (A/B+VC) than those managed with the LI0·95 target, except during summer I, when the paddocks were still adapting to the imposed defoliation regimes. During summer I, the tussock size decreased, and the tussock number increased, leading to a reduction in the proportion of bare ground and achieving a stable condition only in early spring (Paiva Reference Paiva2013). Under those conditions, most of the results represent this adaptation phase and not treatment effects. However, the present results indicate that aerial tillering may be a strategy by which elephant grass maintains growth/development under competition for light resources caused by longer regrowth intervals and the taller post-grazing sward heights of the swards managed with the LIMax target (Fig. 1). Rêgo et al. (Reference Rêgo, Cecato, Canto, Martins, Santos, Cano and Peternelli2002) demonstrated that an increase in post-grazing height as a result of long regrowth intervals (similar to the LIMax condition in this experiment) was associated with stem elongation and the elevation of apical meristems in Panicum maximum cvar Tanzânia. These results favour the decapitation of apical meristems by defoliation, which in association with greater deposition of senescent and dead material in the central and basal area of the tussocks in the swards managed with the LIMax target, seems to enhance the recruitment of tillers from the axillary buds (aerial tillers) instead of those originating from the basal buds (basal tillers) (Table 1). Greater deposition of dead material at the base of the swards managed with the LIMax target was also reported by Carnevalli et al. (Reference Carnevalli, Da Silva, Bueno, Uebele, Bueno, Hodgson, Silva and Morais2006) for P. maximum cvar Mombaça, which was attributed to the accumulation of senescent material during regrowth and the physical damage and rejection of herbage during grazing.
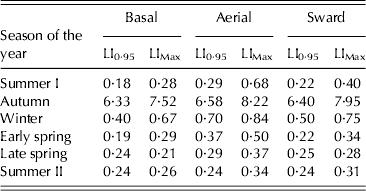
Aerial tillers are characterized by the need for supporting structures, including the stems and root system of their parents, for water and nutrient uptake from the soil (Marshall Reference Marshall1996; Vuorisalo & Hutchings Reference Vuorisalo and Hutchings1996). In this context, the activation and development of the axillary buds characterize a growth strategy based on the increase in tiller numbers per IPU (Derner et al. Reference Derner, Briske and Polley2012). Gold & Caldwell (Reference Gold and Caldwell1990) demonstrated that, after defoliation, some modifications in the physiological characteristics of individuals, such as an increase in photosynthetic activity, operate in association with changes in sward structure, such as the modification of the leaf angle of the remaining leaves, to maximize carbon uptake by the plant as a whole. Individuals in a plant community are sensitive to variations in the microclimatic conditions in their environment and are therefore capable of triggering responses that maximize the exploitation of patches of nutrients in the soil or light resources along the vertical and/or horizontal profile of the sward canopy (Stuefer Reference Stuefer1998). The increase in post-grazing height (Fig. 1) maintains the axillary meristems in the vertical strata of the sward with better light availability; therefore, the recruitment of the aerial tillers corresponds to a more efficient growth strategy for the restoration of the photosynthetic surface after defoliation of the swards managed with the LIMax target. These results suggest a strategy for maximizing the occupation of the vertical structure of the sward because horizontal expansion via exploitation of the soil surface by basal tillers is restricted. Although such a strategy may ensure some advantage in the initial growth, the larger senescence-to-growth ratio of the aerial v. basal tillers suggests a greater susceptibility to competition of this tiller class, particularly when associated with longer regrowth intervals (Table 4).
Senescence-to-growth ratio of basal and aerial tillers and the whole sward of elephant grass cvar Napier subjected to strategies of intermittent stocking management with pre-grazing targets of 0·95 and maximum canopy light interception from January 2011 to April 2012
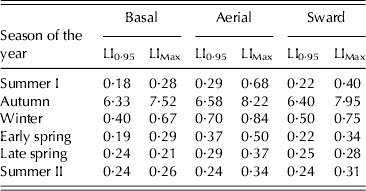
The senescence-to-growth ratio was calculated by the quotient between leaf senescence and leaf growth rates
The swards managed with the LI0·95 target also used aerial tillering as a growth strategy, as demonstrated by the similar values of TPDa for both of the LI pre-grazing targets (Table 1). However, frequent defoliation, as for the LI0·95 target, decreases competition for light, resulting in lower stem elongation (Table 2). Such a grazing strategy seems to induce the gradual decapitation of apical meristems of the basal tillers throughout the growth season, which in association with reduced deposition of dead material at the sward base favours greater numbers of basal tillers in the tiller population (Table 1).
During autumn and winter, there was a reduction in the rates of leaf and stem growth regardless of the pre- and post-grazing targets (Tables 2 and 3), resulting in lower rates of leaf accumulation (negative values during autumn), which is certainly a consequence of the lower temperature and rainfall of those seasons. During autumn, singular patterns in the proportions of basal and aerial tillers in the tiller population were recorded. Aerial tillers comprised >0·60 of the leaf growth and senescence and stem growth for both of the LI pre-grazing targets. In autumn, the plants flower, indicating changes in the growth pattern going into their reproductive development state. In elephant grass, such changes are triggered by changes in the length of daylight, although variations in temperature and seasonal patterns of precipitation may act concomitantly as modulating factors of changes between the vegetative and reproductive development states in forage grasses (Colasanti & Coneva Reference Colasanti and Coneva2009). Elephant grass is considered a short-day plant, with a critical daylight length of 12–15 h, conditions that normally occur during April and May (autumn). The reproductive phase is characterized by a sequence of changes in the developmental programme of the plants, which include modifications in the source–sink relations and assimilation partitioning among organs and changes in leaf morphology and anatomy (Sylvester et al. Reference Sylvester, Parker-Clark and Murray2001) and in patterns of tillering. In elephant grass, one of the main physiological modifications that indicates a switch between the vegetative and reproductive growth phases is stem elongation and the elevation of the apical meristems into the grazing stratum of the swards. This process increases the probability of decapitation, favouring the loss of apical dominance and the activation of axillary buds (Murphy & Briske Reference Murphy and Briske1992; McSteen Reference McSteen2009; Assuero & Tognetti Reference Assuero and Tognetti2010), resulting in an increase of aerial tillers at that time of the year (Table 1 and Fig. 3).
Activation and development of the axillary buds are commonly inhibited in the majority of grasses because reproductive structures are considered strong sinks for assimilates and act to inhibit the development of axillary buds through apical dominance in several species. However, McWilliam (Reference McWilliam1968) reported that inhibition by the apical meristems is lost immediately after anthesis, indicating that if the hormonal mechanisms signalling reproductive development are maintained as active (low auxin/cytokinin ratio and stable levels of gibberellic acid), then fast growth from tillers originating from axillary buds may occur. According to McWilliam (Reference McWilliam1968), perennial and annual grasses from the Phalaris genus have distinct growth and persistency mechanisms. Annual species are capable of using aerial tillering as a means of maximizing reproductive development. The loss of apical dominance after anthesis favours activation of axillary buds, which quickly begin to elongate and flower. This mechanism, which is associated with greater rates of decapitation of apical meristems, may explain the increase in TPDa recorded during autumn and winter in this experiment (Table 1 and Fig. 3).
In the current study, leaf growth remained low during winter, and the rates of stem growth and leaf senescence were the lowest recorded during the experiment for both LI pre-grazing targets. Although tissue turnover was low, the greatest TPD was recorded during autumn and winter (Table 1 and Fig. 3), with aerial tillers representing the greatest contribution to growth and senescence for the swards managed with the LIMax target relative to those managed with the LI0·95 target (Table 2). These results are the opposite of those for Brachiaria decumbens cvar Basilisk (Morais et al. Reference Morais, Fonseca, Nascimento, Ribeiro, Fagundes, Moreira, Mistura and Martuscello2006) and Mombaça guinea grass (P. maximum cvar Mombaça) (Carnevalli Reference Carnevalli2003), which exhibited a reduction in TPD during autumn and winter, indicating that the increase in aerial tillers is specific to the studied species, corresponding to an evolutionary mechanism or a plastic response to environmental conditions.
The increase in precipitation and air temperature favoured sward recovery in early spring. This season was characterized by an increase in TPDb tillers (Table 1), a response that certainly influenced the herbage production and sward responses in the subsequent seasons. The leaf growth rates changed from 65 kg/ha/day in winter to 250 kg/ha/day in early spring. The basal tillers contributed significantly to plant growth for both of the LI pre-grazing targets and were the main component of plant growth at that time of the year (Table 2). The contribution of the basal tillers to leaf growth was greater for the swards managed with the LI0·95 target than those managed with the LIMax target, corresponding to 0·83 and 0·74, respectively. Similarly, stem growth increased, with the basal tillers contributing >0·85 of the recorded values. Large differences in stem growth rates between the LI pre-grazing targets were recorded during spring, with values 2·8 times greater for the swards managed with the LIMax target, essentially reflecting the longer periods of regrowth and competition for light under those conditions. This pattern of response resulted in great difficulty in achieving the targeted post-grazing heights for the swards managed at LIMax throughout the experimental period and simply reflected the growth conditions related to that target pre-grazing. Stems are known to represent a physical barrier to grazing (Benvenutti et al. Reference Benvenutti, Gordon and Poppi2008) and are usually located in the bottom half of the vertical sward profile (Fonseca et al. Reference Fonseca, Mezzalira, Bremm, Filho, Gonda and Carvalho2012). In the present experiment, for the LIMax treatments, the pre-grazing heights were c.120 cm, and the post-grazing height represented about half of the pre-grazing height, consistent with the position of the stem in the sward profile (Zanini et al. Reference Zanini, Santos and Sbrissia2012) but indicating a similar severity of grazing between the LI0·95 and LIMax targets. As an adaptation mechanism and as a result of the greater rate of decapitation of the apical meristems under the LIMax treatments, the aerial tillers contributed relatively more than the basal tillers to the plant growth and herbage accumulation for the swards managed with the LIMax target.
In spite of the differences in leaf growth for the LI pre-grazing targets from winter onwards, the variations in the relative contribution of each tiller class to sward growth and net herbage accumulation followed similar patterns. There was an increase in the participation of the aerial tillers for both of the LI pre-grazing targets from early spring onwards, with maximum values recorded during summer II. Derner et al. (2012) described the increase in tiller numbers per IPU as a strategy for maximizing resource capture by plants when conditions for the development of basal tillers are restricted. Although such a strategy may be efficient in the short term as a mechanism of adaptation of the plant population to the management conditions, in the long term, the sharing of resources among individuals within the IPU, the restricting of light conditions within the sward canopy, and the formation of new IPUs result in decreased potential for dry matter production, reduced soil occupation ability and persistence of the swards managed with the LIMax target. These results are illustrated by the rates of net leaf accumulation, which were higher for the swards managed with the LI0·95 target relative to those managed with the LIMax target (Fig. 4). Basal tillers exhibited higher rates of growth and lower rates of senescence than did the aerial tillers (Tables 2 and 3). In that context, even with a greater proportion of aerial tillers in the total TPD (Table 1), the basal tillers contributed a larger proportion of the net leaf accumulation (Table 2 and Fig. 4), explaining the higher rates of net leaf accumulation for the swards managed with the LI0·95 target.
The effect of the post-grazing height targets was small relative to that of the LI pre-grazing targets and corresponded to differences in the rates of leaf growth during winter and summer II (Table 2), stem growth throughout the experimental period, and TPD during autumn and early spring (Fig. 3), with greater values recorded for the swards managed at 35 cm compared with those managed at 45 cm. Severe defoliation may reduce the size and quality of the residual leaf area and decrease the rate at which the swards recover. However, there was no difference in the grazing interval between the post-grazing height targets when they were associated with the LI pre-grazing target of 0·95. As a result, the swards managed at 35 cm may present greater herbage accumulation. More severe defoliation resulted in greater total herbage accumulation in Mombaça (Carnevalli et al. Reference Carnevalli, Da Silva, Bueno, Uebele, Bueno, Hodgson, Silva and Morais2006) and Tanzânia (Barbosa et al. Reference Barbosa, do Nascimento, Euclides, Da Silva, Zimmer and Torres2007) guinea grass subjected to analogous experimental protocols. Furthermore, the post-grazing height target strongly influences the grazing efficiency. In Mombaça guinea grass, the recorded values of grazing efficiency corresponded to 0·80 and 0·68 for swards managed with the LI0·95 target and post-grazing heights of 30 and 50 cm, respectively (Carnevalli et al. Reference Carnevalli, Da Silva, Bueno, Uebele, Bueno, Hodgson, Silva and Morais2006), whereas in Tanzânia guinea grass, the values corresponded to 0·90 and 0·50 for the post-grazing heights of 25 and 50 cm, respectively (Difante et al. Reference Difante, Nascimento, Euclides, Da Silva, Barbosa and Gonçalves2009). For swards managed within the limits of plant resistance to grazing (Da Silva et al. Reference Da Silva, Bueno, Carnevalli, Uebele, Bueno, Hodgson, Matthew, Arnold and Morais2009), more severe grazing associated with frequent defoliations favours light penetration into the sward canopy, maximizing tillering and leaf growth (Barbosa et al. Reference Barbosa, do Nascimento, Euclides, Da Silva, Zimmer and Torres2007) and resulting in reduced grazing losses (Carnevalli et al. Reference Carnevalli, Da Silva, Bueno, Uebele, Bueno, Hodgson, Silva and Morais2006). In that context, the targets of post-grazing height may influence the response variables relative to the total herbage accumulation and the harvesting efficiency. However, although small differences in growth patterns have been detected between post-grazing height targets in some seasons, the definition of a target to be used as a field guide for the management of elephant grass cvar Napier must consider the foraging behaviour and herbage intake of the grazing animals as well as the chemical characteristics of the consumed herbage, particularly at the end of the grazing period (Fonseca et al. Reference Fonseca, Mezzalira, Bremm, Filho, Gonda and Carvalho2012), because these characteristics directly influence animal performance and system productivity.
The results from this experiment indicate that elephant grass cvar Napier is highly adaptable to imposed grazing strategies due to the plasticity of responses both on a tiller (rates of physiological processes between tiller classes) and on a population level (variation in tiller numbers and the proportion of different tiller classes in the tiller population). The targets of LI pre-grazing play a central role in the definition of the growth strategy that plants will use, influencing their competitive ability. Such strategies are primarily related to variations in the numbers of basal and aerial tillers in the total tiller population, which strongly influence the components of the herbage accumulation and total dry matter production.
CONCLUSION
Distinct strategies for growth/development were used by elephant grass cvar Napier in response to the LI pre-grazing targets, as characterized by changes in the tiller classes among the tiller population. For swards managed with the LIMax target, the population density of the basal tillers was smaller and the number of aerial tillers per support structure was greater than on those managed with the LI0·95 target. Such a strategy resulted in lower rates of leaf growth and higher rates of stem growth, with a consequent reduction in net leaf accumulation for swards managed with the LIMax target.
The authors thank FAPESP and CNPq for sponsorship: Lilian Elgalise Techio Pereira and Eliana Vera Geremia were sponsored by FAPESP while Adenilson José Paiva and Sila Carneiro da Silva were sponsored by CNPq.