Implications
Birth weight is an important trait for meat-type animals and it has important effects on growth and survival. This study showed that an area on ovine chromosome 1 has a significant association with birth weight in sheep. Three genes located on this chromosome, including RAB6B, Tf and GIGYF2, could be considered as candidate genes for birth weight analysis in future studies. The results of this study could be used in marker-assisted selection and genomic evaluation programmes for genetic improvement of productivity in sheep.
Introduction
In the past few decades, progress of molecular genetics resulted in detection of various genes or associated genetic markers affecting important traits in farm animals. This progress provided an opportunity to increase the selection efficacy, especially for the traits which are difficult to be improved by conventional selection methods (Dekkers, Reference Dekkers2004).
Identification of DNA polymorphism and the genes associated with BW traits provides necessary information for marker-assisted selection and gene-based selection (Goddard and Hayes, Reference Goddard and Hayes2009). Major genes affecting economic traits in farm animals have been detected using genomic scan and animal genetic fine mapping. Body weight is affected by several genes such as IGF-I, Leptin, MSTN and ADRB3, located on chromosomes 3, 4, 2 and 26, respectively (Forrest et al., Reference Forrest, Hickford and Frampton2007; Gholibeikifard et al., Reference Gholibeikifard, Aminafshar and Hosseinpour Mashhadi2013). After introducing multiple quantitative trait loci (QTL) for production traits in cattle, some QTL studies have been conducted in sheep (Margawati et al., Reference Margawati, Raadsma, Martojo and Muladmo2006). Development of high-throughput single-nucleotide polymorphism (SNP) genotyping technologies led to the use of genome-wide association studies (GWASs) to detect candidate genes for quantitative traits, which provides this opportunity to enhance the efficiency of animal breeding programmes. Currently, GWAS is used for identification of major QTLs for economic traits in various species of farm animals (Al-Mamun et al., Reference Al-Mamun, Kwan, Clark, Ferdosi, Tellam and Gondro2015).
Body weight is one of the most important traits for meat-type animals that can be measured at birth or at other life stages. This trait has high impacts on growth performance and is used for various reproduction, nutrition and preventive management decisions (Buzanskas et al., Reference Buzanskas, Grossi, Ventura, Schenkel, Sargolzaei, Meirelles, Mokry, Higa, Mudadu, da Silva, Niciura, Torres, Alencar, Regitano and Munari2014). Birth weight is the earliest available BW trait with considerable impacts on lamb survivability and growth performance traits (Ptáček et al., Reference Ptáček, Ducháček, Stádník, Haki and Fantová2017). On the other hand, birth weight influences lambing ease, which in turn influences animal welfare and profitability (Li and Brown, Reference Li and Brown2015). Birth weight is influenced by various genetic and non-genetic factors and its estimate of heritability is noticeably influenced by maternal genetic and environmental effects (Zamani and Mohammadi, Reference Zamani and Mohammadi2008). Several GWASs such as Zhang et al. (Reference Zhang, Liu, Zhao, Ren, Xu, Lu, Zhang, Zhang, Wei, Lu, Zheng and Du2013), Matika et al. (Reference Matika, Riggio, Anselme-Moizan, Law, Pong-Wong, Archibald and Bishop2016) and Mudadu et al. (Reference Mudadu, Porto-Neto, Mokry, Tizioto, Oliveira, Tullio, Nassu, Niciura, Tholon, Alencar, Higa, Rosa, Feijó, Ferraz, Silva, Medeiros, Lanna, Nascimento, Chaves, Souza, Packer, Torres, Siqueira, Mourão, Coutinho, Reverter and Regitano2016) have been conducted for BW traits but birth weight remains poorly known. Detection of major genes affecting birth weight is one of the most important ways to understand genetic structure and physiological pathways affecting this trait, which in turn helps to enhance efficacy of selection strategies to improve growth traits of meat-type animals. The hypothesis is that there are some genetic markers or QTLs associated with birth weight which could be used in genomic evaluation and marker-assisted selection programmes. The aim of this study was to perform a GWAS to detect possible candidate genes or QTLs, associated with birth weight in meat-type sheep.
Material and methods
Studied population
The studied population was a Lori-Bakhtiari flock at Shooli sheep breeding station in Shahrekord, Iran. The Lori-Bakhtiari sheep is a heavy meat-type breed of sheep, mainly raised in western and south-western parts of Iran. The studied flock is managed under semi-extensive system. The animals graze on rangelands during May to December, while in other months they are kept indoors and fed manually by diets, mainly based on alfalfa, barley grain and wheat straw, which are balanced according to nutrient requirements of sheep (National Research Council, 2007). Mating season elongates from late August to late October and thus lambing begins in late January.
Data and estimation of breeding values
A dataset including 8634 birth weight records, collected during 1989 to 2017 were used in this study. The pedigree included 9299 animals, consisting of 368 sires and 2540 dams; numbers of animals with unknown sire, unknown dam and unknown parents were 366, 341 and 221, respectively. Genetic parameters and breeding values for birth weight were estimated using the following model:
 $${\mib{y}} {\equals}{\mib{Xb}} {\plus}{\mib{Z}} _{{\mib{a}} } {\mib{a}} {\plus}{\mib{Z}} _{{\mib{m}} } {\mib{m}} {\plus}{\mib{Z}} _{{\mib{c}} } {\mib{c}} {\plus}{\mib{e}} $$
where y is vector of birth weight records; b is vector of fixed effects including birth year-season in 66 levels as combinations of 27 years (1989 to 2017) and three seasons (spring, summer and winter), sex (male or female), birth type (1, 2 or 3) and dam age (2 to 8 years); a, m, c and e are vectors of random direct additive genetic (breeding values), maternal additive genetic, maternal environmental and residual effects, respectively; X, Z a, Z m and Z c are design matrices relating observations to the corresponding elements in b, a, m and c, respectively. Fixed effects of the model, including birth year-season, sex, birth type and dam age, had been determined based on a preliminary generalized linear model analysis, using SAS 9.4 (SAS Institute, 2013).
Variance structures of a, m, c and e were assumed as A  ${\mib{\sigma }} _{{\mib{a}} }^{2} $, A
 ${\mib{\sigma }} _{{\mib{m}} }^{2} $,
 ${\mib{I}} _{{\mib{d}} } {\mib{\sigma }} _{{\mib{c}} }^{2} $ and
 ${\mib{I}} _{{\mib{n}} } {\mib{\sigma }} _{{\mib{e}} }^{2} $, respectively, where
 ${\mib{\sigma }} _{{\mib{a}} }^{2} $,
 ${\mib{\sigma }} _{{\mib{m}} }^{2} $,
 ${\mib{\sigma }} _{{\mib{c}} }^{2} $ and
 ${\mib{\sigma }} _{{\mib{e}} }^{2} $ are direct additive genetic, maternal additive genetic, maternal environmental and residual variances, respectively; A is the additive numerator relationship matrix, I d and I n are identity matrices with orders equal to numbers of dams and records, respectively.
Variance components and breeding values for birth weight were estimated based on average information algorithm of restricted maximum likelihood, using Wombat software (Meyer, Reference Meyer2007).
Sampling and DNA extraction
A total of 132 sheep were sampled from the studied population. Among the sampled animals, 66 female sheep were selected based on the case-control method, according to the estimated breeding values (EBVs) (33 high and 33 low EBVs) and the remaining 66 sheep (8 males and 58 females) were selected randomly. The sampled animals were offspring of 68 sires and 120 dams. Blood samples (10 ml per sheep) were collected from jugular vein. Genomic DNA was extracted from whole blood using CinnaGen kit (CinnaGen Co., Iran).
Genotyping and quality control
The samples were genotyped using the Illumina OvineSNP50 BeadChip (Illumina Inc., San Diego, CA, USA), including 51 135 SNPs. The samples with call rates <99% were removed from the analysis. The SNPs with GenCall (GC) scores <0.6, genotype call rates <95%, minor allele frequencies <0.05 and significant Hardy-Weinberg disequilibrium at 10−6 were removed from the analysis. Plink 1.90 beta (Chang et al., Reference Chang, Chow, Tellier, Vattikuti, Purcell and Lee2015) and R software (R Development Core Team, 2008) were used for various stages of the quality control. A total of 130 animals and 41 323 variants remained after quality control.
Genome-wide association study
Genome-wide association analysis was conducted to detect genome regions associated with EBVs for birth weight, using Plink 1.90 beta (Chang et al., Reference Chang, Chow, Tellier, Vattikuti, Purcell and Lee2015). In GWAS, the SNPs were tested individually and the first five principal components were included as covariates in the model to consider population structure. Based on SNP numbers remaining after quality control, level of 0.05/41300 = 10−6 was considered as genome-wide and level of 0.05 was set as Bonferroni-adjusted significant thresholds. GWAS plots, including Q-Q and Manhattan plots were constructed using ‘qqman’ package of R software (Turner, Reference Turner2014). Linkage disequilibrium (LD) between SNPs was computed as |D′|, using Haploview version 4.2 (Barrett et al., Reference Barrett, Fry, Maller and Daly2005). Linkage disequilibrium blocks were created for the SNPs, located within a window of 500 kb around the significant SNPs. Genetic variations attributed to the SNPs were estimated using GCTA software (Yang et al., Reference Yang, Lee, Goddard and Visscher2011a). In this analysis, a genomic relationship matrix was built for 26 autosome chromosomes using the mapped SNPs. The GCTA software was also used to estimate genomic heritability, based on adjusted records. Residuals of a GLM fitting birth weight on the fixed effects of year-season, sex, birth type and dam age were considered as the adjusted records. Genotypic frequencies and least square means for the detected variants were estimated using the SAS software (SAS Institute, 2013).
Genes and quantitative trait loci in the detected regions
According to the latest version of sheep genome map (Illumina Infinium Ovine SNP50 v1 BeadChip, including 54241 SNPs) in SNPchiMp V.3 (Nicolazzi et al., Reference Nicolazzi, Caprera, Nazzicari, Cozzi, Strozzi, Lawley, Pirani, Soans, Brew, Jorjani, Evans, Simpson, Tosser-Klopp, Brauning, Williams and Stella2015), a BLAST search using the BioMart-Ensembl (http://www.ensembl.org/Biomart) and NCBI (https://www.ncbi.nlm.nih.gov/) databases was performed to look for ovine genes, located in 50 kbp distances from the detected variants. Previously published QTLs in QTL database (http://www.animalgenome.org/QTLdb) were also searched for possible previously reported QTLs.
Results
Genetic parameters and estimated breeding values
Heritability estimate for birth weight in the studied population was 0.31 ± 0.028. Descriptive statistics of the observed phenotypes and EBVs for birth weight in the sampled animals are presented in Table 1.
Descriptive statistics for phenotype and estimates of breeding values for birth weight in the sampled Lori-Bakhtiari sheep

EBV = estimate of breeding value; n = number of observations; Min = minimum observation; Max = maximum observation.
Quality control
Two samples were removed due to call cates <99%. These two samples had call rates <70%. Among the 51 135 SNPs, 3081 SNPs were removed through GC-score <0.6, 3978 SNPs due to minor allele frequency <0.05 and 1 SNP due to Hardy-Weinberg disequilibrium (P <10−6). A total of 1520 SNPs were also removed due to missing genotype rate <0.05. Moreover, 1232 SNPs are located on sex chromosomes and thus were withdrawn from the analysis. After quality control, 130 sheep and 41 323 variants were used for final analysis.
Genome-wide association study and linkage disequilibrium
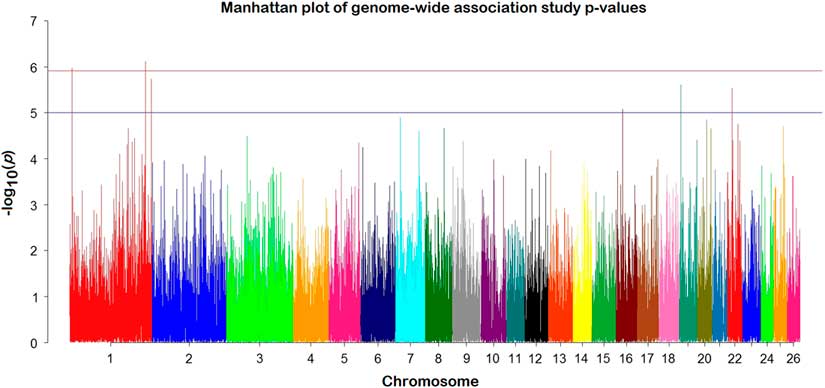
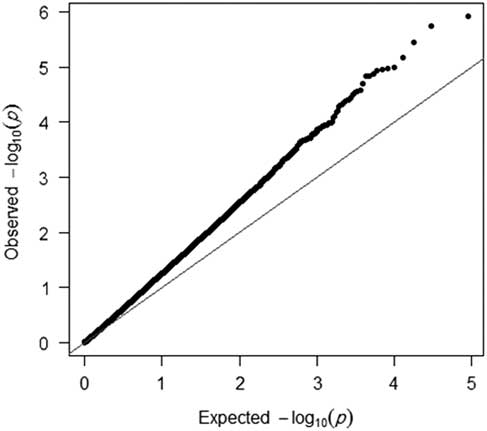
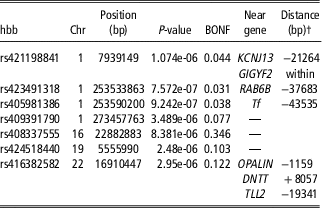
Manhattan and Q-Q plots for the association analysis are presented in Figures 1 and 2, respectively. According to the Manhattan plot and based on the unadjusted genome-wide P-values, seven significant SNPs were identified on chromosomes 1 (four SNPs), 16 (one SNP), 19 (one SNP) and 22 (one SNP) (Figure 1). The SNPs s54564.1 (rs423491318) and s63115.1 (rs405981386), located on chromosome 1, had the highest significance levels (P = 7.572e-07 and 9.242e-07, respectively), while the SNP OAR16_24956553.1 (rs408337555) located on chromosome 16 had the lowest significance level (P = 8.381e-06) among the seven significant SNPs (Table 2). However, only three SNPs on chromosome 1, including s54564.1, s63115.1 and OAR1_7546163.1 (rs423491318, rs405981386 and rs421198841, respectively) had significant associations with EBVs, after Bonferroni adjustment of P-values (P <0.05). More detailed information about the identified variants are presented in Table 2. Distributions of the observed v. expected genome-wide P-values in the Q-Q plot showed a deviation from the 45° line (Figure 2).
Manhattan plot of genome-wide association study (GWAS); −log10(P-values) in the studied population of Lori-Bakhtiari sheep.

Quantile-quantile plot for –log10(P-values) for the association analysis (λ = 1.23) on the studied population of Lori-Bakhtiari sheep. The dots represent −log10(P-value) of the single nucleotide polymorphisms (SNPs) and the 45° line represents the expected values under the null hypothesis for no association.

Significant SNPs associated with estimates of breeding values for birth weight in the studied population of Lori-Bakhtiari sheep

SNP = single nucleotide polymorphism; Chr = chromosome; BONF = Bonferroni-adjusted P-values
† Positive and negative distances are upstream and downstream of the genes, respectively.
The most significant SNPs, rs405981386 and rs423491318 are located in a 56 kb distance (253533863 and 253590200 bp, respectively) on chromosome 1 (Table 2). These two SNPs were tightly linked together (D′ confidence interval = 0.92 to 1.00) and thus are seen together as the longest column on chromosome 1 in Manhattan plot (Figure 1). However, no haplotype block was found for the significant variants in this interval (Supplementary Figure S1).
Estimate of genomic heritability for birth weight was 0.28, which was slightly lower than the heritability estimated for total population (0.31). Genotypic frequencies and least square means for EBV and proportions of total genetic variation explained by the detected SNPs are presented in Table 3. The detected variants explained relatively low proportions of total genetic variation, whereby a total of 1.2% of total genetic variation was accounted by the detected SNPs. The significant SNPs, based on Bonferroni-adjusted P-values, on chromosome 1 (rs423491318, rs405981386 and rs421198841), however, explained 0.8% of total genetic variation.
Genotypic frequencies, least square means of estimated breeding values, allele substitution effect and proportion of total genetic variance explained by the detected single nucleotide polymorphisms, in the studied population of Lori-Bakhtiari sheep

SNP = single nucleotide polymorphism; LSM of EBVs = least square means of estimated breeding values; α = allele substitution effect (reference allele in the parentheses); PTGV = proportion of total genetic variance explained by the SNP.
Detected genes
In BLAST search in the Biomart-Ensembl and NCBI databases, no candidate gene was found for the SNPs OAR1_296010698.1 (rs409391790), OAR16_24956553.1 (rs408337555) and s40021.1 (rs424518440), located on chromosomes 1, 16 and 19, respectively. Three significant SNPs on chromosome 1 (rs423491318, rs405981386 and rs421198841), covered four genes, including RAB6B, a member of RAS oncogene family; Tf serotransferrin; KCNJ13, a potassium voltage-gated channel subfamily J member 13 and GIGYF2, a GRB10 interacting GYF protein 2. Three additional genes, including DNTT, DNA nucleotidylexotransferase; OPALIN, oligodendrocytic myelin paranodal and inner loop protein and TLL2, tolloid-like protein 2 were also found around the SNP s21678.1 (rs416382582) on chromosome 22. Distances of these genes from the detected SNPs are presented in Table 2. No QTL was found around the detected variants in QTL database (http://www.animalgenome.org/ QTLdb).
Discussion
Body weight is a quantitative trait with a moderate to high heritability (Buzanskas et al., Reference Buzanskas, Grossi, Baldi, Barrozo, Silva, Torres Júnior, Munari and Alencar2010). Heritability estimate for birth weight in the present study (0.31) was in the range reported by previous studies (Zamani and Mohammadi, Reference Zamani and Mohammadi2008; Zamani et al., Reference Zamani, Moradi, Alipour and Ghafouri-Kesbi2016). This estimate, however, was slightly higher than the genomic heritability estimate (0.28) and this difference is largely due to different sample sizes, because BLUP and genomic estimates of heritability were obtained for all population (8634 records) and sampled animals (130 individuals), respectively. Missing heritability is another reason for lower estimate of genomic heritability.
Genomic inflation factor (λ), which is fully described in the literature (such as Yang et al., Reference Yang, Weedon, Purcell, Lettre, Estrada, Willer, Smith, Ingelsson, O’Connell, Mangino, Mägi, Madden, Heath, Nyholt, Martin, Montgomery, Frayling, Hirschhorn, McCarthy, Goddard and Visscher2011b), was 1.23. In the present study, all animals were selected from a single flock and top five principal components were included in the model to consider population structure. Therefore, the observed genomic inflation factor could be attributed to some factors such as sample size, LD structure and number of causal SNPs affecting the studied trait (Yang et al., Reference Yang, Weedon, Purcell, Lettre, Estrada, Willer, Smith, Ingelsson, O’Connell, Mangino, Mägi, Madden, Heath, Nyholt, Martin, Montgomery, Frayling, Hirschhorn, McCarthy, Goddard and Visscher2011b).
As it was mentioned previously, among the seven significant SNPs on chromosomes 1, 16, 19 and 22, the most significant SNPs (rs405981386 and rs423491318) were closely linked together on chromosome 1 (D′ confidence interval = 0.92 to 1.00), but no haplotype block was found for the significant variants in this interval. This observation could be attributed to low marker density and small sample size. Despite small contributions of the detected SNPs on chromosomes 16, 19 and 22 in total genetic variance, the SNPs on chromosome 1 (rs405981386 and rs423491318) accounted for noticeable proportion of total genetic variance (about 0.8%) which may indicate presence of possible QTLs or candidate genes close to this region.
In earlier studies, a significant QTL between 41 and 86.4 Mbp of chromosome 1 was significantly associated with 8-week BW, and two significant QTLs in regions between 88.5 to 143.7 Mbp and 239.1 to 239.3 Mbp of chromosome 1 were associated with 20-week BW in Charollais sheep (McRae et al., Reference McRae, Bishop, Walling, Wilson and Visscher2005), which the latter QTL is close to three significant SNPs in the present study (rs423491318, rs405981386 and rs409391790 in 253.5, 253.6 and 273.5 Mbp, respectively). Two SNPs out of the four detected SNPs on chromosome 1 (rs423491318, rs405981386 in 253.5 and 253.6 Mbp, respectively) exactly located in a suggestive QTL were associated with 20-week BW in 253.4 to 253.6 Mbp of chromosome 1 in Suffolk and Texel sheep (Walling et al., Reference Walling, Visscher, Wilson, McTeir, Simm and Bishop2004). Another significant QTL, between 68.7 and 68.8 Mbp of chromosome 1, was also associated with 43-week BW in Awassi-Merino backcross progenies (Raadsma et al., Reference Raadsma, Thomson, Zenger, Cavanagh, Lam, Jonas, Jones, Attard, Palmer and Nicholas2009).
The detected variant in 22.9 Mbp of chromosome 16 (rs408337555) locates near to a reported significant QTL between 1.0 and 53.5 Mbp and a suggestive QTL between 6.1 and 22.2 Mbp of chromosome 16, both of which were associated with slaughter BW (Cavanagh et al., Reference Cavanagh, Jonas, Hobbs, Thomson, Tammen and Raadsma2010). The detected SNP on 16.9 Mbp of chromosome 22 (rs416382582) locates near to a suggestive QTL between 0.3 and 6.4 Mbp of chromosome 22, which was associated with slaughter weight in Scottish Blackface sheep (Matika et al., Reference Matika, Riggio, Anselme-Moizan, Law, Pong-Wong, Archibald and Bishop2016).
In addition to these QTLs, a QTL for birth weight on ovine chromosome 5 was detected in an Indonesian Thin Tail × Merino × Merino backcross progeny population (Margawati et al., Reference Margawati, Raadsma, Martojo and Muladmo2006). In another study, 36 significant SNPs were identified for seven BW, body size and carcass traits in Sunit, German Mutton and Dorper purebred sheep, but no significant SNP was identified for birth weight (Zhang et al., Reference Zhang, Liu, Zhao, Ren, Xu, Lu, Zhang, Zhang, Wei, Lu, Zheng and Du2013).
Four candidate genes, close to the significant SNPs on chromosome 1 (RAB6B, Tf, KCNJ13 and GIGYF2), are involved in some important metabolic pathways. The RAB6B is involved in some molecular functions including GTP binding, GTPase activity and myosin V binding. The Tf is involved in many molecular functions (ferrous and ferric iron binding, transferrin receptor binding and ferric iron transmembrane transporter and iron chaperone activities) and several biological processes including iron ion transport, cellular iron ion homeostasis, ferric iron transport, positive regulation of receptor-mediated endocytosis, cellular response to iron ion and regulation of iron ion import (http://www.ensembl.org/Biomart). All these functions may impact growth and production traits. The KCNJ13 involves in inwardly rectifier potassium channels activity and GIGYF2 involves in IGF receptor signalling pathway and multicellular organism growth (http://www.ensembl.org/Biomart). The GIGYF2 role in IGF pathway signalling and age-related neurodegeneration has been reported in mice (Giovannone et al., Reference Giovannone, Tsiaras, de la Monte, Klysik, Lautier, Karashchuk, Goldwurm and Smith2009).
Role of the RAB6B gene, as a member of a gene network, affecting growth and meat quality traits has been found in Nelore cattle previously (Mudadu et al., Reference Mudadu, Porto-Neto, Mokry, Tizioto, Oliveira, Tullio, Nassu, Niciura, Tholon, Alencar, Higa, Rosa, Feijó, Ferraz, Silva, Medeiros, Lanna, Nascimento, Chaves, Souza, Packer, Torres, Siqueira, Mourão, Coutinho, Reverter and Regitano2016). Moreover, the RAB6B is a member of Non-SMC Condensin I Complex, Subunit G (NCAPG)-specific network, a modulator for pre- and postnatal growth, which is not completely understood for its molecular pathways affecting differential BW (Widmann et al., Reference Widmann, Reverter, Fortes, Weikard, Suhre, Hammon, Albrecht and Kuehn2013). Setoguchi et al. (Reference Setoguchi, Furuta, Hirano, Nagao, Watanabe, Sugimoto and Takasuga2009) detected a QTL affecting carcass weight on bovine chromosome 6 and identified a causative variant in the NCAPG gene as NCAPG c.1326T >G, which induces an amino acid exchange (Ile442 to Met442) in the encoded polypeptide. This variant is found in various bovine breeds and is associated with birth weight (Eberlein et al., Reference Eberlein, Takasuga, Setoguchi, Pfuhl, Flisikowski, Fries, Klopp, Fürbass, Weikard and Kühn2009) and adult body size (Setoguchi et al., Reference Setoguchi, Watanabe, Weikard, Albrecht, Kühn, Kinoshita, Sugimoto and Takasuga2011). Mudadu et al. (Reference Mudadu, Porto-Neto, Mokry, Tizioto, Oliveira, Tullio, Nassu, Niciura, Tholon, Alencar, Higa, Rosa, Feijó, Ferraz, Silva, Medeiros, Lanna, Nascimento, Chaves, Souza, Packer, Torres, Siqueira, Mourão, Coutinho, Reverter and Regitano2016) conducted a GWAS using high-density SNP genotyping data (~770 k SNP) on Nelore cattle to detect the genes participated in growth and meat quality traits. That study showed three transcription factors, consisting in VDR (vitamin D receptor), LHX9 (Lim Homeobox) and ZEB1 (Zinc finger E-box binding homeobox 1) genes, which in combination with 66 connected genes participate in biological growth processes, and the RAB6B is a member of the identified network (Mudadu et al., Reference Mudadu, Porto-Neto, Mokry, Tizioto, Oliveira, Tullio, Nassu, Niciura, Tholon, Alencar, Higa, Rosa, Feijó, Ferraz, Silva, Medeiros, Lanna, Nascimento, Chaves, Souza, Packer, Torres, Siqueira, Mourão, Coutinho, Reverter and Regitano2016).
The Tf gene encodes transferrin, a homodimeric β-globulin in plasma, which binds two molecules of ferric iron with high affinity (Pantopoulos et al., Reference Pantopoulos, Porwal, Tartakoff and Devireddy2012). Transferrin plays a vital role in iron homeostasis and its structure and the function has been understood a long time ago (Fletcher and Huehns, Reference Fletcher and Huehns1968). Regarding the important function of transferrin in iron metabolism, significant association of Tf polymorphism with BW or other production traits is highly expected. In a study, three SNPs in the Tf gene had significant associations with milk production traits and somatic cell score in Chinese native cattle (Ju et al., Reference Ju, Li, Huang, Hou, Li, Li, Zhong and Wang2011). Significant associations of two SNPs (A14037G and C14081T) in Tf gene with both milk production, milk components and growth traits have been also reported in Holstein-Frisian cows (Senkal et al., Reference Senkal, Ahmed, Mahmood and Abdulkareem2017). Tf polymorphisms had also significant associations with lamb growth rate in Polish Long-wool sheep (Kmieć, Reference Kmieć1999).
In another study, several candidate genes including leptin receptor gene (LEPR), FSH receptor (FSHR), LH/choriogonadotropin receptor (LHCGR), bone morphogenetic protein 7 (BMP7), progesterone receptor (PGR), IGF-1 receptor (IGFIR) and melatonin receptor 1A (MTNR1A) were studied in Davisdale sheep, but only two SNPs in LEPR were weakly (P = 0.027 for SNP A and P = 0.075 for SNP B) associated with birth weight (Haldar et al., Reference Haldar, French, Brauning, Edwards, O’Connell, Farquhar, Davis, Johnstone and Juengel2014).
A GWAS on BW traits in 96 Baluchi sheep indicated 13 SNPs with chromosome-wide significance and one SNP with genome-wide significance levels. In that study two SNPs, located on 7.9 Mbp of chromosome 6 and 53.2 Mbp of chromosome 16, were significantly associated with birth weight. These SNPs were located within a QTL associated with lean meat yield percentage (Cavanagh et al., Reference Cavanagh, Jonas, Hobbs, Thomson, Tammen and Raadsma2010) and a QTL affecting BW at 53 and 83 weeks in Merino sheep (Raadsma et al., Reference Raadsma, Thomson, Zenger, Cavanagh, Lam, Jonas, Jones, Attard, Palmer and Nicholas2009), respectively, and the nearest known genes to these SNPs were TRAMIL1 and STRBP, respectively (Gholizadeh et al., Reference Gholizadeh, Rahimi-Mianji, Nejati-Javaremi, de Koning and Jonas2015). In another GWAS on growth and meat production traits in Australian Merino sheep, a total of 39 SNPs significantly associated with post-weaning BW. In that study, a region on chromosome 6, between 36.2 and 38.6 Mbp, contained 13 significant SNPs, where the most significant SNP had an allele substitution effect of 2.12 kg, corresponding 0.248 of total phenotypic standard deviation. This region contains three genes comprising LAP3, NCAPG and LCORL (Al-Mamun et al., Reference Al-Mamun, Kwan, Clark, Ferdosi, Tellam and Gondro2015).
Conclusion
A total of three SNPs, located on chromosome 1, showed significant associations with EBVs for birth weight. A 56 kb region on chromosome 1 contained the most significant SNPs (rs423491318 in 253533863 bp and rs405981386 in 253590200 bp) which were tightly linked together and jointly accounted for 0.8% of the total genetic variation. Among four genes located around the significant genes on chromosome 1, three genes, RAB6B, Tf and GIGYF2 could be considered as candidate genes for birth weight. The results of this study may facilitate potential use of the genes involved in growth and production traits for genetic improvement of productivity in sheep.
Acknowledgements
This study was funded by Bu-Ali Sina and Guilan universities. The authors would like to thank Prof. Cedric Gondro, Michigan State University, for his kind collaborations in this study.
Declaration of interest
The authors declare that they do not have any conflict of interest.
Ethics statement
All stages of this study, including farm management, data collection and blood sampling were performed according to the Ethics Committee of Bu-Ali Sina University.
Software and data repository resources
None of the data were deposited in an official repository.
Supplementary materials
To view supplementary material for this article, please visit https://doi.org/10.1017/S1751731118003610