Introduction
Since the early 1960s, geochemists and limnologists have been intrigued by the biogeochemistry of aquatic systems in the McMurdo Dry Valleys, Antarctica. Studies in “extreme” environments such as these provide insights to system dynamics that are overwhelmed by other processes in more temperate, mesic and biotic-friendly systems. The primary efforts in studying geochemical processes in the McMurdo Dry Valleys (MCM) have been focused on the larger lake systems, especially in Taylor and Wright valleys, where data go back to the early 1960s (Angino et al. Reference Angino, Armitage and Tash1962). Investigations continued through the 1970s–1980s (e.g. Wharton et al. Reference Wharton, McKay, Mancinelli and Simmons1987, Green et al. Reference Green, Angle and Chave1988) with ongoing biogeochemical monitoring since 1993 through the McMurdo Dry Valleys Long-Term Ecological Research (MCM-LTER) project (e.g. Lyons et al. Reference Lyons, Welch, Neumann, Moorhead and McKnight1998). However, there are many smaller lakes and ponds situated throughout Victoria Land and along the Scott Coast. Many of these aquatic systems have been sampled sporadically over the past 20 years, and much is known about their geochemistry (Torii et al. Reference Torii, Nakaya, Matsubaya, Matsumoto, Masuda, Kawano and Murayama1989, Webster et al. Reference Webster, Brown and Vincent1994, Timperley Reference Timperley1997, Borghini & Bargagli Reference Borghini and Bargagli2004, Healy et al. Reference Healy, Webster-Brown, Brown and Lane2006, Webster-Brown et al. Reference Webster-Brown, Gall, Gibson, Wood and Hawes2010). These ponds have been referred to in the literature as either “coastal” or “inland”, depending on their location and elevation (Borghini & Bargagli Reference Borghini and Bargagli2004, Wait et al. Reference Wait, Webster-Brown, Brown, Healy and Hawes2006). However, no published information exists on the geochemistry of the higher elevation, or “upland”, ponds in Taylor Valley, which are found at c. 350 m and 750 m elevation.
Healy et al. (Reference Healy, Webster-Brown, Brown and Lane2006) have demonstrated that the composition of meltwater ponds at elevations above 400 m in Wright and Victoria valleys (both north of Taylor Valley) reflects two processes: the dissolution of salts in the soils that water flows over and through, and the cryoconcentration of ions via the freeze/thaw process. Working in the Darwin Glacier region, Timperley (Reference Timperley1997) has argued that chemical weathering can also add solutes to the ponds, and the differential solubility of salts can affect the geochemistry of cold desert ponds. This differential solubility can be enhanced if a series of ponds are interconnected via down-slope drainage (Timperley Reference Timperley1997). For example, during colder years, the upslope ponds may not melt and during the freezing process, certain binary salts are precipitated. During warmer years, the most soluble salts could redissolve and potentially be transported into the down-slope ponds, thereby enriching the down-slope ponds in these ions while depleting the upslope ponds (Timperley Reference Timperley1997). Similarly, the differential solubility of binary salts has been demonstrated to occur in hot desert playa systems (Drever & Smith Reference Drever and Smith1978). Healy et al. (Reference Healy, Webster-Brown, Brown and Lane2006) have also shown that chemical weathering is an important process in these upland pond systems, as Ca2+ is much more enriched in the Victoria versus the Wright Valley ponds due to their differences in catchment lithologies. Additionally, the Victoria Valley ponds are more Cl- rich than those in Wright Valley, which have a higher proportion of both SO42- and NO3- (Healy et al. Reference Healy, Webster-Brown, Brown and Lane2006). However, all of the inland ponds in Victoria and Wright valleys and in the Darwin Glacier region (∼ 80°S) are enriched in NO3- compared to the surface waters of the larger MCM lakes. These NO3- enrichments are thought to be due to the higher NO3- salt concentrations observed in the soils in these inland and/or upland elevations as compared to the soils found lower in the valleys (Keys & Williams Reference Keys and Williams1981, Healy et al. Reference Healy, Webster-Brown, Brown and Lane2006).
Healy et al. (Reference Healy, Webster-Brown, Brown and Lane2006) have elegantly demonstrated that as the Wright and Victoria Valley ponds freeze in the winter, CaSO4·2H2O (gypsum) then Na2SO4 salts precipitate from solution in accordance with thermodynamic model prediction. The Na2SO4 salts redissolve in the summer as the ponds melt. Previous work showed that CaCO3 removal also can occur early on in the evolutionary process in these pond waters (Webster et al. Reference Webster, Brown and Vincent1994). Apparently, at no time do the Wright and Victoria Valley ponds precipitate nitrate salts, and it is speculated that these very soluble salts can only occur through the subaerial evaporation of residual pond water or through pond ice ablation (Healy et al. Reference Healy, Webster-Brown, Brown and Lane2006). Timperley (Reference Timperley1997) has predicted that salt precipitation of relatively insoluble salts such as CaCO3 and CaSO4·2H2O will also lead to the fractionation of solutes in ponds that are interconnected, with the down-slope ponds having not only higher TDS, but enrichments in the most soluble salts (i.e. Cl- and NO3- binary salts).
Over a nine year period we sampled a series of ponds in Taylor Valley in order to better determine their chemical composition, sources of both solutes and water, and response to climate variation. We conducted this investigation because our observations in the larger lakes on the floor of Taylor Valley demonstrate important yearly geochemical changes brought about by changes in freshwater input (Welch et al. Reference Welch, Neumann, McKnight, Fountain and Lyons2000, Foreman et al. Reference Foreman, Wolf and Priscu2004). These variations in hydrologic input are directly related to variations in summer temperatures (Doran et al. Reference Doran, McKay, Clow, Dana, Fountain, Nylen and Lyons2002). We hypothesize that these ponds may have a more complex response to fluctuating hydrological regimes than the larger lakes because they contain much smaller water volumes. Therefore, variations in water input (through summer glacial melt) or loss (via surface ice sublimation) may have greater relative influence on their geochemical compositions than exhibited by the lakes. However, because these ponds are found at much higher elevations than the lakes, changes in summer temperatures are less extreme and therefore the ponds may not be as greatly impacted by glacial melt as the larger lakes at lower elevations. It has been clearly demonstrated in the Arctic that variation in the chemistry of shallow ponds can be an excellent sentinel of climate variation (Smol & Douglas Reference Smol and Douglas2007). Our initial hypothesis was that changes in hydrologic inflow control the major solute geochemistry of these ponds. This link between summer meteorology and water balance has been clearly demonstrated in the larger lakes on the valley floor of Taylor Valley (Welch et al. Reference Welch, Neumann, McKnight, Fountain and Lyons2000). Because of the smaller size of these ponds, annual variations in water balance should be a major control on solute chemistry. As noted by Timperley (Reference Timperley1997) in a conceptual model developed for interconnected or nested Antarctic ponds, increasing temperatures should lead to a transfer of salts, particularly mobile ones such as Cl-, down the flow path into the “terminal” pond.
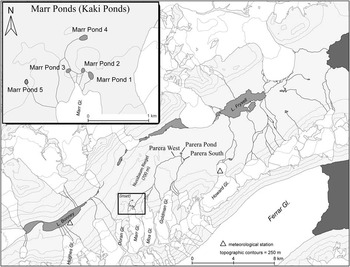
Although our dataset includes information for many of the ponds throughout Taylor Valley, we focus our discussion in this paper on a series of ponds above 700 m in elevation above the Nussbaum Riegel, south of Andrews Ridge in south-central Taylor Valley (Fig. 1). We also discuss ponds located c. 4 km to the east of the Nussbaum Riegel at 350 m. These ponds have been referred to in previous papers (Moorhead et al. Reference Moorhead, Barrett, Virginia, Wall and Porazinska2003, Moorhead Reference Moorhead2007) as “upland ponds/wetlands”, and we continue this terminology. The flow of liquid water to these features is irregular, with some years having no flow at all (Moorhead et al. Reference Moorhead, Barrett, Virginia, Wall and Porazinska2003, Moorhead Reference Moorhead2007). Clearly these fluctuations exert great control on the size and geochemistry of these ponds and Moorhead (Reference Moorhead2007) has argued that these fluctuations can play a major role in the distribution of organic matter through the valley soils. In this paper we evaluate longer-term (i.e. annual to decadal) changes in the geochemistry of these upland ponds. The work of Healy et al. (Reference Healy, Webster-Brown, Brown and Lane2006) clearly demonstrated that the geochemistry of similar McMurdo region ponds vary through an annual cycle. However, until our work, there were limited data from ponds where sampling had been conducted over a multi-year period. Thus, this study reflects one of the few time-series of pond geochemistry in this part of Antarctica. We will compare our geochemical record to the size variation of these ponds over a decade in an attempt to relate climatic and hydrologic changes to our measurements of chemical variations. Finally, we will use a model that computes glacier melt driven by the MCM-LTER temperature records on the Taylor Valley floor to compare the measured pond size with the modelled melt production.
Map of Taylor Valley showing locations of ponds included in this study.

Study area
The McMurdo Dry Valley's landscape is a mosaic of bedrock, soils, glaciers, ice-covered lakes and ephemeral streams in southern Victoria Land between 77–78°S latitude. The climate is considered a polar desert with mean annual temperatures on the valley bottom between -14.8 to -30.0°C (Doran et al. Reference Doran, McKay, Clow, Dana, Fountain, Nylen and Lyons2002) and precipitation ∼ 5 cm a-1 (Witherow et al. Reference Witherow, Bertler, Welch, Lyons, Mayewski, Sneed, Nylen, Handley and Fountain2006). The upland ponds under investigation here consist of two separate complexes in the south-central portion of Taylor Valley, one above the Nussbaum Riegel, a 700 m ridge (Marr ponds), and one c. 4 km to the east of the Nussbaum Riegel in a topographic depression at 350 m (Parera ponds). The geology of this region consists of two major series of meta sedimentary rocks, one rich in carbonate and one not, including schists, quartzites and marbles, which are in turn in contact to the west with a granodiorite; these formations are cut by lamprophyric dykes (Haskell et al. Reference Haskell, Kennett, Prebble, Smith and Willis1965). The western portion of Nussbaum Riegel is dotted with recent McMurdo Volcanic basaltic cones. The glacial drift and morainal materials overlying portions of the metamorphic and granodiorite rocks is thought to be derived from the advance of the Taylor Glacier (i.e. East Antarctic Ice Sheet) from the west, and is termed Taylor IV drift. The surface on which the Parera ponds are located is between 1.5 and 2.55 Ka old (Wilch et al. Reference Wilch, Denton, Lux and McIntosh1993). The surfaces occupied by the Marr ponds at 750 m a.s.l. investigated here are thought to be the oldest surfaces in Taylor Valley (Marchant & Denton Reference Marchant and Denton1996).
The Nussbaum Riegel serves as a climatic delineation, as the altitude of the glacier equilibrium line (i.e. the separation between mass gain and mass loss), changes abruptly at the Riegel, shifting from ∼ 400 m on the east side, closer to the coast, to ∼ 1200 m inland on the west side of the Riegel (Fountain et al. Reference Fountain, Lyons, Burkins, Dana, Doran, Lewis, McKnight, Moorhead, Parsons, Priscu, Wall, Wharton and Virginia1999). Local meteorological data from the Nussbaum Riegel are not available. The MCM-LTER program has maintained a series of automated weather stations in the valleys since 1993, with the closest stations being on the Howard Glacier ∼ 8 km to the east of the Riegel at 473 m elevation and at Lake Bonney, ∼ 7 km west of the Reigel at 64 m elevation (Fig. 1). Since 1993, the mean annual temperatures at these locations are -17.2°C and -16.9°C respectively.
There is a strong spatial gradient of snowfall in Taylor Valley, where less snow falls inland because the Nussbaum Riegel acts as a barrier, blocking low-level clouds that move moisture inland from the ocean (Fountain et al. Reference Fountain, Nylen, Monaghan, Basagic and Bromwich2010). Precipitation measured at the nearby Howard Glacier, the closest site to the upland ponds area, ranged from 2–74 mm water equivalent (weq) from 2004–06 (only data available). However, net accumulations can be higher due to wind drifting events (20–87 mm weq) (Fountain et al. Reference Fountain, Nylen, Monaghan, Basagic and Bromwich2010). Our observation during the period of the MCM-LTER project is that much, if not all, of the spring and summer precipitation is rapidly sublimed and unavailable as runoff, especially at these elevations.
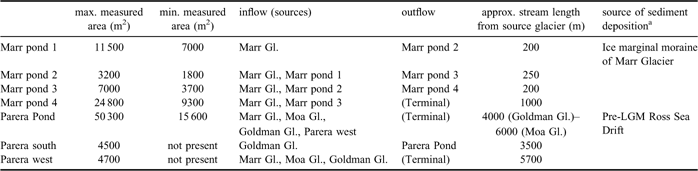
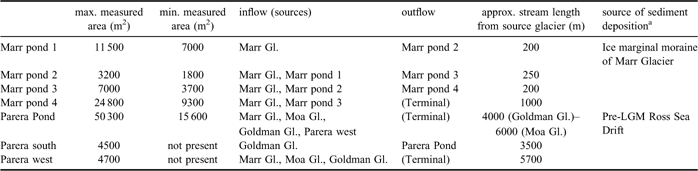
The location of the Taylor Valley upland ponds is shown in Fig. 1. Table I provides a brief description of the ponds and their hydrologic properties. The Marr ponds (unofficial name – officially known as the Kaki Ponds) are at an elevation of c. 750 m a.s.l. and consist of five ponds. Marr ponds 1, 2, 3, and 5 receive direct meltwater input from the Marr Glacier. Marr ponds 1–4 are also connected hydrologically: Pond 1 flows into Pond 2 which flows into Pond 3, which finally flows into Pond 4, the terminal pond. Marr pond 5 is on a bedrock ridge and volcanic cone to the west of the other Marr ponds, and receives melt from the Marr Glacier but is not hydrologically connected to the other ponds.
Pond sizes and hydrologic properties.
aMarchant & Denton 1996
The Parera Ponds complex is at c. 350 m, and includes associated wetlands and extended hyporheic zones in the down slope areas of the drainage. This pond complex consists of one large pond (Parera Pond also referred to as “Highland Pond” in Moorhead Reference Moorhead2007) and two smaller more ephemeral ponds referred to here as Parera west and Parera south (Fig. 1). These ponds receive meltwaters from the Goldman, Moa and the Marr glaciers (Fig. 1). The water in these ponds has extensive interaction with their inflow channels, showing large “wetting zones” or hyporheic interactions many meters away from their primary channels. Water occasionally ponds along the edges of these channels in late December/early January and “wetland” regions can be extensive.
Methods
Water samples were collected by hand by individuals wearing clean polyethylene gloves into precleaned polyethylene bottles along the edges of the ponds in the melted out moats (Moorhead et al. Reference Moorhead, Barrett, Virginia, Wall and Porazinska2003). Only one sample per pond was collected during each year. There was no attempt to determine whether the ponds were stratified at the time of sampling, and the samples should be considered “surface” samples only. The bottles were rinsed with 18-MΩ distilled-deionized water (DDW) three times and then filled with DDW for a minimum of 24 hr. Major ion and dissolved reactive silicate (H4SiO4) samples were filtered through 0.4 μm Nuclepore™ filters using precleaned plastic filter towers within 24 hr of sample collection, and were stored in clean plastic bags in the dark at ∼5°C prior to analysis at the Crary Laboratory in McMurdo Station. Major cations and anions were analysed with a DX-120 ion chromatograph using the methods outlined in Welch et al. (Reference Welch, Lyons, Graham, Neumann, Thomas and Mikesell1996, Reference Welch, Lyons, Whisner, Gardner, Gooseff, McKnight and Priscu2010). The precision of these measurements was 5% or better. Container blanks of DDW were analysed in every sample run. Alkalinity (i.e. HCO3-) was determined via charge balance difference. We have measured alkalinity by titration in over 900 stream samples in the McMurdo Dry Valleys through the years of the MCM-LTER project and have compared results to alkalinity values computed via charge balance. The mean difference for measured values > 0.50 m eq l-1 is ± 14% (calculations were done eliminating two very saline streams draining into the north-west portion of West Lake Bonney). Therefore, we estimate the precision of our alkalinity estimates to be ±14%. Reactive silicate (H4SiO4) was determined using a standard colorimetric molybdate technique on samples that had never been frozen. These analyses took place in the USA. Precision was 10% or better. Stable isotope samples were analysed on non-filtered samples at INSTAAR, University of Colorado, using the techniques outlined in Gooseff et al. (Reference Gooseff, Lyons, McKnight, Vaughn, Fountain and Dowling2006).
Samples from the Marr features were collected during the late portion of the melt season in the 2001/02–2009/10 summer seasons. Goldman Glacier melt features were sampled in 2001–02, 2002–03, and 2005/06–2009/10 summers. Complete ice cover sometimes precluded sample collection from some ponds. The earliest sample collected at the Marr ponds was 23 December in 2004, while the latest collection occurred on 28 January in 2002, though the majority of collections took place between 14–28 January each year. Although only one sample per pond was collected each summer, all the samples from the Marr ponds were collected between 23 December–28 January. The Taylor Valley streams usually experience maximum flows between 21 December and the first week of January (www.mcmlter.org). It would have been ideal to collect samples at the same time every year, but due to logistical and other workload constraints, this was not possible. However, with the exception of the first two samples from the Parera Pond complex, all ponds were sampled during the end of, or after, the major valley floor meltwater flows of each summer. The timing of sample collection allows comparability across summers because water input had occurred prior to collecting pond samples each season.
In addition to the geochemical sampling, we have analysed data sources to determine the variation in sizes of these ponds through time (Table II). Data sources include US Geological Survey aerial photography, direct measurements using a hand-held GPS (Moorhead Reference Moorhead2007) and Digital Globe Quickbird satellite images.
Modelled meltwater volumes from the Marr and Goldman glaciers (m3), and measured pond areas (m2) from various sources. Pond areas were usually measured after the majority of seasonal flow had occurred (late January through March), though this was not always possible due to the scarcity of data. Early-season (i.e. before summer melt season) imagery was sometimes used to determine pond areas for the previous season. Using Digital Globe Quickbird satellite imagery from January 2004 and November 2004, it was determined that pond areas decreased due to ablation < 5% between summer seasons. NP = pond was Not Present.

Sources:
aUS Geological Survey TMA Flightline 3084, photo numbers 0133 and 0137, 21-Nov 1993.
bMoorhead (2007)
cPan-sharpened Digital Globe Quickbird satellite image. Timestamp: 04jan142048270, Swath order & sub-swath scene number: 1010010002a1a800_u08tc4326
dPan-sharpened Digital Globe Quickbird satellite image. Timestamp: 07jan092120469, Swath order & sub-swath scene number: 10100100056add00_u08tc4326
ePan-sharpened Digital Globe Quickbird satellite image. Timestamp: 07mar162153277, Swath order & sub-swath scene number: 101001000586f000_u08tc4326
fPan-sharpened Digital Globe Quickbird satellite image. Timestamp: 04nov022115012, Swath order & sub-swath scene number: 10100100035dec00_u08tc4326
gCircumference measured using hand-held GPS unit
Results and discussion
Major ion (both cation and anion) data and stable isotope data of water (where available) for the ponds are tabulated in Appendix A. The 2001–02 summer was abnormally warm and produced a large amount of stream discharge (Foreman et al. Reference Foreman, Wolf and Priscu2004), as well as flow features, such as seeps, which had not previously been observed in Taylor Valley (e.g. Lyons et al. Reference Lyons, Welch, Carey, Doran, Wall, Virginia, Fountain, Csatho and Tremper2005). Since 2001–02, stream flows have generally remained substantially lower, with the exception of the 2007–08 season, which was slightly higher than others (www.mcmlter.org) were.
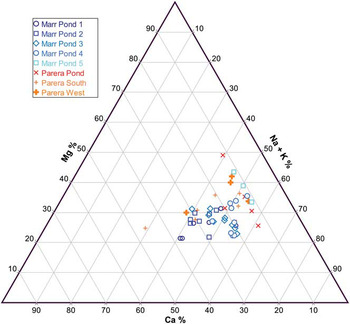
In general, the cation chemistry of the Marr ponds and most of the Parera ponds clusters together on a ternary diagram (Fig. 2a). A few of the Parera Pond samples contain higher relative Mg2+ than the others, with one having Mg2+ as the major cation and much lower Na+ + K+ concentrations. The explanation for this is not obvious, although there are abundant cones of the McMurdo volcanics that could be undergoing weathering to produce these different cation variations. The higher Mg2+ concentrations could possibly reflect a higher degree of evaporation history of the pond water at these times, as Mg2+ is concentrated relative to Ca2+ during the evapoconcentration process (Eugster & Jones Reference Eugster and Jones1979).
Ternary diagram for major cations. Ca2+, Mg2+ and Na+ + K+ are shown as percent by equivalents.

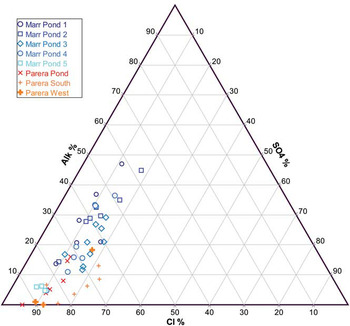
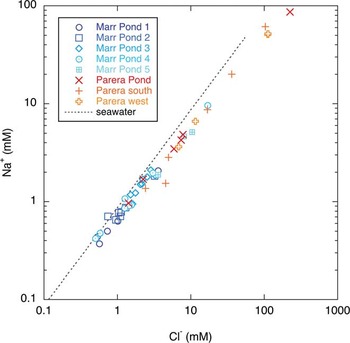
The Marr pond 5 samples are enriched in Ca2+ compared to the others (Fig. 2a) and closely resemble the cationic composition of the ponds in Victoria Valley as noted by Healy et al. (Reference Healy, Webster-Brown, Brown and Lane2006). The Marr pond data represent a transition of compositions from Wright Valley to Victoria Valley cationic concentrations (Healy et al. Reference Healy, Webster-Brown, Brown and Lane2006). The anionic diagram (Fig. 2b) shows a wide range of HCO3- and Cl-, but a much smaller range of SO42- values. Only three of the Parera Pond samples have SO42- > 20%, with relative Cl- concentrations varying between 95 and ∼50%. The Marr pond 5 samples contain the highest relative HCO3- concentrations. The Ca-Na-Cl Marr pond 5 waters are very unusual in the MCM region; the Parera Pond waters are Na-Cl and Mg-Cl. Clearly this is a very wide diversity of chemical composition within a close proximity. The Na-Cl rich waters reflect the primary precipitation signal of the marine aerosol, as the majority of samples have Na:Cl slightly less than 1:1 (Fig. 3). The enrichment of Ca2+, Mg2+ and/or HCO3- clearly suggests that the chemical weathering of alkaline earth-rich minerals within the catchments is a major process even at these low mean annual temperatures. This enrichment may also be due to the dissolution of CaCO3-rich dust introduced by Aeolian processes, especially in the winter. The source of the CaCO3-rich dust is unknown, but it is found on the alpine glaciers in Taylor Valley with some of the highest values on the nearby Howard Glacier (Witherow et al. Reference Witherow, Bertler, Welch, Lyons, Mayewski, Sneed, Nylen, Handley and Fountain2006).
Ternary diagrams for major anions. Cl-, SO42- and alkalinity are shown as percent by equivalents.

Sodium versus chloride in millimolar concentrations for the pond samples. The seawater line represents the ionic ratio of Na to Cl in seawater.

Because Ca2+ and CO32- binary salts are the least soluble in these types of environments (Healy et al. Reference Healy, Webster-Brown, Brown and Lane2006), the enrichment of these ions in the pond waters is not due to selective loss of the other major ions in the solution. In the Marr pond 5 region, as noted above, the abundance of McMurdo volcanic rocks must be a major source of solute acquisition via weathering. Unlike previous work in both the Labyrinth ponds in Wright Valley and the ponds in Victoria Valley, the enrichment of HCO3- over SO42- makes the Marr pond 5 pond waters unusual. Also unlike the Wright Valley ponds, these Taylor Valley ponds have very low NO3- concentrations (Appendix A), with the highest values being only a few μM. Because our samples were collected in December and January and because all these ponds have abundant algal mats associated with them (Moorhead et al. Reference Moorhead, Barrett, Virginia, Wall and Porazinska2003), we speculate that most of the input of N into these systems is rapidly taken up by the benthic mats. Total N along the edges of these ponds has been determined to be ∼ 11 μM with C:N molar ratios of 9:1 (Moorhead et al. Reference Moorhead, Barrett, Virginia, Wall and Porazinska2003).
Cl- concentrations in these ponds range over three orders of magnitude (Fig. 3), demonstrating the significance of evapoconcentration via freezing and sublimation (i.e. water loss) and salt dissolution (i.e. salt gain) as major processes controlling their geochemistry, supporting the earlier work of Torii et al. (Reference Torii, Nakaya, Matsubaya, Matsumoto, Masuda, Kawano and Murayama1989), Webster et al. (Reference Webster, Brown and Vincent1994), Timperley (Reference Timperley1997), Healy et al. (Reference Healy, Webster-Brown, Brown and Lane2006) and Wait et al. (Reference Wait, Webster-Brown, Brown, Healy and Hawes2006). Although the Na:Cl ratio is similar to seawater, suggesting a marine aerosol source as indicated by Torii et al. (Reference Torii, Nakaya, Matsubaya, Matsumoto, Masuda, Kawano and Murayama1989) for the Labyrinth ponds in Wright Valley and the upland ponds in Victorian Valley (Healy et al. Reference Healy, Webster-Brown, Brown and Lane2006), most of the ponds are slightly enriched in Cl- relative to seawater (Fig. 3). At Na+ concentrations above 2 mM, the Cl- enrichment becomes greater, perhaps suggesting loss of Na+ via Na2SO4 precipitation or the dissolution of more soluble Cl- rich salts over time. The highest Cl- and Na+ values occur in the lowest elevation pond with the longest flow path: the Parera Pond complex.
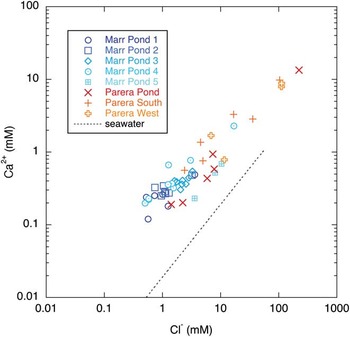
The Ca:Cl ratio of all the ponds is greater than that of seawater, but approaches the seawater value at the highest Cl- concentrations (Fig. 4). We interpret this to mean that Ca2+ is gained through rock/soil weathering (above marine aerosol values) and is lost via CaCO3 precipitation as the pond waters are concentrated via freezing and/or evaporation, as suggested by Webster et al. (Reference Webster, Brown and Vincent1994). The highest Ca2+ enrichment to Cl- (∼1:1) relative to seawater is in Marr pond 5 where abundant basalt outcroppings occur and where chemical weathering may be more extensive.
Calcium versus chloride in millimolar concentrations for the pond samples. The seawater line represents the ionic ratio of Ca to Cl in seawater.

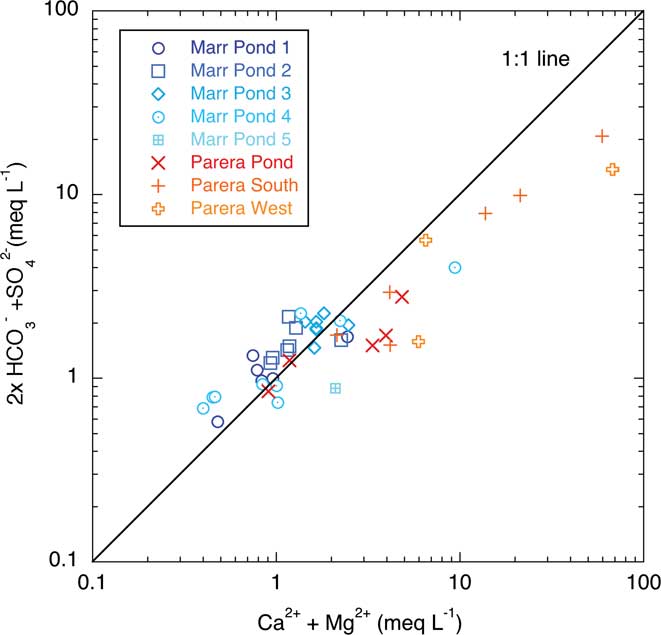
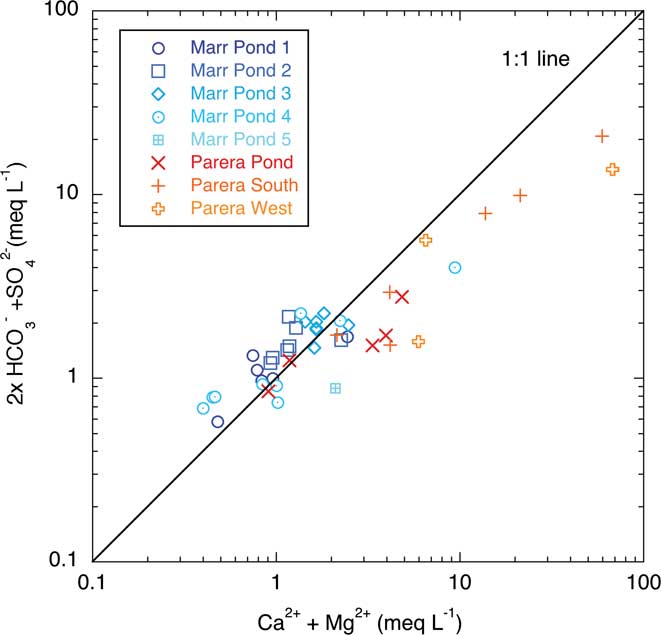
Figure 5 shows the Mg2+ + Ca2+ data plotted vs 2 x HCO3- (alkalinity) + SO42-. Points close to the 1:1 line reflect either the dissolution of Mg + Ca:CO3 + SO4 salts or the initial marine aerosol input (this is particularly true at the lower concentrations). Points with excess HCO3 + SO4 (above 1:1) reflect chemical weathering of minerals and/or dissolution of salts with cations other than Ca2+ or Mg2+, while those data falling below the line indicate samples enriched in Ca2+ and Mg2+ relative to HCO3- and SO42-. These latter samples may represent what Healy et al. (Reference Healy, Webster-Brown, Brown and Lane2006) have termed “suprapermafrost fluids” enriched in CaCl2 brines. These fluids have lost Na through Na2SO4 precipitation as the waters are concentrated. It is possible that these few samples do contain a fraction of hypersaline Ca-Cl fluid, but the Marr ponds samples also have higher concentrations of HCO3- + SO42-, suggesting that they are a mix of this suprapermafrost brine plus slightly evaporated surface waters containing weathering products. Because we have little knowledge of the hydrology and sub-surface water movement in these regions, we cannot definitively determine the sources of water or the solutes in these ponds. Clearly, our data suggest that these ponds are more complex geochemically than many of the other ponds in the McMurdo region. The complexity of these ponds could be a result of their relative elevation, long flow paths and large catchments.
The sum of bicarbonate and sulphate versus the sum of magnesium and calcium as milliequivalents per litre for pond samples.
Dissolved Si concentrations in the ponds range from 0.022–0.123 mM with no geographic pattern (Appendix A). These values are within the range observed in the streams on the Taylor Valley floor (Welch et al. Reference Welch, Lyons, Whisner, Gardner, Gooseff, McKnight and Priscu2010). Because dissolved Si can only be derived from the chemical weathering of aluminosilicate minerals, it is apparent that even at extremely low mean annual temperatures, chemical weathering is occurring in the stream channels going to and from these ponds.
Role of evaporation in concentrating solutes
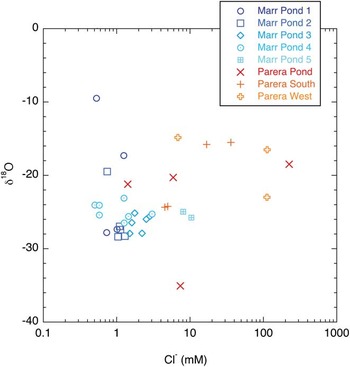
We analysed a number of pond water samples for their stable isotopic composition (Fig. 6). The initial glacier melt should reflect the δ18O value of the snow/ice of the glaciers. Moving inland from the ocean in Taylor Valley, the δ18O of the precipitation becomes lighter, with Howard Glacier (east of Marr Glacier) having a δ18O value of -27‰ and Hughes Glacier (to the west of Marr Glacier) having a value of -30.8‰ (Gooseff et al. Reference Gooseff, Lyons, McKnight, Vaughn, Fountain and Dowling2006). Although we have not analysed any samples from the Marr Glacier, based on our previous work on the glaciers throughout Taylor Valley, the Marr Glacier should have values between -28 and -29‰ (Gooseff et al. Reference Gooseff, Lyons, McKnight, Vaughn, Fountain and Dowling2006). A water sample collected in 2004 from a stream flowing directly from the Marr Glacier yielded a δ18O value of -29.2‰, suggesting that our δ18O isotopic composition estimate for the Marr Glacier melt is appropriate. As water evaporates, the 16O is preferentially lost and the liquid remaining becomes enriched in 18O. The freshest pond waters have δ18O of -28.2‰ and -27.2‰ (Fig. 6), perhaps suggesting that even these lowest Cl- waters have experienced some degree of evaporation. All but one of the samples above 5 mM Cl- have δ18O more enriched than -26‰, with one Parera Pond sample having a value of -18.3‰ and a Marr pond sample having a value of -17.3‰. Water is lost from these ponds from sublimation of their ice covers, especially during colder years. This loss is replaced by the freeze-on of ice at the ice-water interface. The production of ice from liquid water at the surfaces of these ponds also fractionates the isotopes leading to ice covers with more enriched isotopic values (Horita Reference Horita2009). The isotopic enrichment of ice with respect to water ranges from 1.00291–1.0048 for 18O/16O with 1.00291 thought to be the best estimate (Horita Reference Horita2009). Therefore, the more enriched stable isotope values of the water cannot be produced from ice development as the fractionation is in the wrong direction. Both evaporative loss of 16O and the sublimative loss of 18O complicate the interpretation of the isotope data. Clearly, many of the samples are greatly enriched in 18O relative to the Marr Glacier melt. These samples indicate evaporative processes have occurred in the ponds or in streams in transit to the ponds, or both. With one exception, the most 18O-enriched samples are in the Parera ponds, which are at the lowest elevations (i.e. warmer locations) and have the longest stream lengths (Table I; Fig. 1). Samples with glacier-like δ18O signatures but higher dissolved salt concentrations may reflect recent unevaporated glacier melt that has redissolved previously precipitated salt or mixed with “flushed out” preconcentrated salt from the upflow ponds (Timperley Reference Timperley1997). This process has explained similar chemistries in hot desert ecosystems (Drever & Smith Reference Drever and Smith1978).
δ18O‰ versus chloride for pond samples. Not all of the pond samples have been analysed for oxygen isotopic ratio.

Role of climate variation on pond evolution
The size, chemistry and even existence of these ponds depend primarily on the amount of glacier melt produced during the summer. The MCM-LTER has done extensive work since 1993 to document the linkage between changing meteorological conditions, primarily temperature, glacier melt and stream flow (e.g. McKnight et al. Reference McKnight, Niyogi, Alger, Bomblies, Conovitz and Tate1999, Ebnet et al. Reference Ebnet, Fountain and Nylen2005). The geochemistry of the surface waters of the large lakes in Taylor Valley (i.e. lakes Bonney, Fryxell and Hoare) has responded to changes in meltwater inflows. For example, the Cl- concentration in Lake Hoare, the freshest of these lakes, increased by a factor of c. 2 during the low flow years between 1993–94 and 1997–98 (Welch et al. Reference Welch, Neumann, McKnight, Fountain and Lyons2000). In addition to glacial melt, substantial melt can occur from multi annual snowpacks and subsurface melting of permafrost during extremely warm years, although these contributions to the overall hydrology of the valley are probably small (Lyons et al. Reference Lyons, Welch, Carey, Doran, Wall, Virginia, Fountain, Csatho and Tremper2005, Harris et al. Reference Harris, Carey, Welch, Lyons and Fountain2007). Temperature data from the LTER's network of automatic weather stations have been used to model the generation of glacier melt, and these models have been validated using the LTER's stream gauge records (Jaros Reference Jaros2002, Ebnet et al. Reference Ebnet, Fountain and Nylen2005). We have used the model developed by Jaros (Reference Jaros2002) to predict meltwater generation from both the Marr and the Goldman glaciers from the 1990/91–2008/09 seasons (Table II). This model uses temperature data collected at the Taylor Valley floor (Lake Fryxell station) and an adiabatic lapse rate calculation to predict temperatures at the elevations of these glaciers. Although a simple approach, this model has worked very successfully at predicting the flows from the lower elevation glaciers in the eastern portion of Taylor Valley including Commonwealth, Canada and Howard glaciers (Jaros Reference Jaros2002). During this period, according to our model, melt from the Goldman Glacier occurred in all but five years, although flow volume varied by approximately a factor of 9 during the 14 summers when flow did occur. Conversely, for the Marr Glacier, flow occurred only in three summers during this period, according to our model simulations. These summers were the warmest of this period, and only one with substantial melt (i.e. > 1000 m3) took place since the establishment of the MCM-LTER (i.e. 2001–02).
In previous work, Moorhead et al. (Reference Moorhead, Barrett, Virginia, Wall and Porazinska2003) noted that Marr 3 pond was almost dry and Marr ponds 1, 2 and 4 had extensive algal mat distribution beyond their shorelines and had “thick ice with high albedo” but with melted out margins. During 2000–01, there was stream flow into Marr 2 pond and from the eastern portion of the Marr Glacier, but it did not reach the Parera ponds as it disappeared 50 m down slope (Moorhead et al. Reference Moorhead, Barrett, Virginia, Wall and Porazinska2003). There was also no flow observed between the ponds as normally observed (Fig. 1, Table I). These earlier observations by Moorhead et al. (Reference Moorhead, Barrett, Virginia, Wall and Porazinska2003) suggest that our model simulations may underestimate melt from these glaciers into these ponds. There is no doubt that the 2001–02 summer produced extensive melt and surface water flow through both Taylor and Wright valleys (Foreman et al. Reference Foreman, Wolf and Priscu2004). This increase in melt also occurred at higher elevations in the valley as shown in the measured pond areas in Table II, and suggests that the hydrology of the valley is extremely sensitive to the short, intense warming events (Doran et al. Reference Doran, McKay, Clow, Dana, Fountain, Nylen and Lyons2002, Lyons et al. Reference Lyons, Welch, Carey, Doran, Wall, Virginia, Fountain, Csatho and Tremper2005).
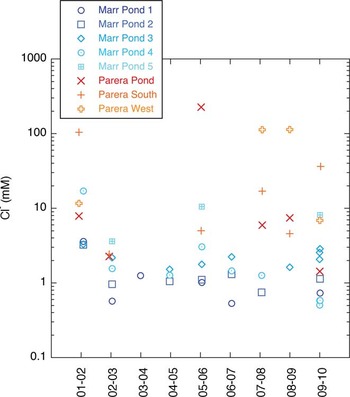
Our modelled flows can be compared to the actual measurement of the pond sizes during this time period (Table II). In general, the Marr ponds and the large Parera Pond are relatively small from 1992/93–2000/01, and Parera south and Parera west were not present in 1992–93. Most of the summers in this period were very cool with medium to very low flows in the valley streams (Doran et al. Reference Doran, McKay, Clow, Dana, Fountain, Nylen and Lyons2002). From 2000/01–2002/03, the ponds increased in size. The 2001–02 summer was an extremely high flow season (deemed the “flood year”) when the valley lakes increased greatly in volume (Foreman et al. Reference Foreman, Wolf and Priscu2004). There was another increase in size in the large Parera Pond during 2003–04, with only slight but significant fluctuations in size after this time. The measured Cl- concentrations in Marr pond 1 and Marr pond 2 reflect the pond sizes at least generally. Cl- concentrations decrease from 2001/02–2002/03, increase in 2003–04, change little during 2005–06 with a slight decrease in 2006–07 and increases in 2008–09 and 2009–10 (Table II, Fig. 7). In general, variations over this period fit the picture of our knowledge of austral summer temperature variations and the subsequent hydrologic response on the Taylor Valley floor (www.mcmlter.org). There are years when all the Marr ponds and the Parera Pond complex have similar Cl- values (2009–10, 2001–02, 2002–03), and years when the two groups of ponds vary greatly in their Cl- concentrations (2007–08 and 2008–09). In 2002–03, it appears that the Parera system was diluted while the Marr system was also diluted, but the concentrations between Marr ponds varied by almost an order of magnitude. This difference in the Marr ponds’ Cl- concentration may be due to lack of sufficient water to “flush” the system (this is similar to the fractionation of soluble salts as proposed in the Timperley (Reference Timperley1997) model), or the preferential loss of ice-cover and more enhanced evaporative loss in some of the ponds. The lowest Cl- concentrations were in the uppermost ponds (Marr pond 1 and Marr pond 2) suggesting Cl- was flushed from these ponds downstream into the lower elevation ponds. These data demonstrate that depending on the year, the amount of flow and surface solute concentrations can vary by at least an order of magnitude.
Chloride concentrations for pond samples plotted versus time.

Our original hypothesis was that during “warm” summers when abundant melt is produced from the high elevation glaciers in Taylor Valley such as the Marr and Goldman, the upper set of nested ponds would “flush” salt that was previously concentrated during cooler summers to the terminal pond. Between 2003–04 and 2006–07, Parera Pond was at its largest area and in January 2006 it also had the highest measured solute concentrations (Cl- = 225 mM). This suggests that the high flow event in 2001–02 and perhaps another in 2002–03 (Table II) transported large amounts of salt into the pond. The anion composition is dominated by Cl- with low SO42- and extremely low HCO3- concentrations as proposed by Timperley (Reference Timperley1997) for flow-through pond systems. Two years after the maximum solute concentrations in Parera Pond, the Cl- decreased by a factor of 45 times. Where had all this salt gone? We propose that during these accumulations of salt, the terminal ponds (such as Parera Pond) act similar to a “recharge playa” in warm, arid regions of the world. The brackish water accumulated by the flush of meltwater through the upstream pond is lost through sinkage at the bottom of the pond. We also propose that this salt water could flow down-slope at the bottom of the active layer (i.e. top of the permafrost) and become a potential liquid water source lower in the valley. Recent work by Levy et al. (in press) suggests that “water tracks” found in the Lake Hoare region could originate from similar processes. Solute transport by this mechanism may play an important role in transporting both salt and water in the lower valley soils (Levy et al. in press).
Conclusions
We have made single surface water measurements in a series of “upland” ponds (elevations 350 m and 750 m) above the Taylor Valley floor in the McMurdo Dry Valleys region of Antarctica. These measurements have been made at least once per year from 2000–2010. Even though these ponds are spatially close, their geochemistrys are diverse, ranging from Na-rich to Ca-rich and Cl-rich to HCO3-rich in a small area. The ponds respond to summer temperature variations, with more meltwater, and hence chemical dilution, occurring during the warmest summers. Variations in summer melt input affects both the bulk chemical concentrations of these ponds and their stable isotopic composition. “Terminal” ponds in a nested pond sequence like the Marr and Parera complex may play an important role in the discharge of water and solutes into the subsurface.
Acknowledgements
This work was supported by NSF grants - OPP ANT-0423595 and OPP-9813061. We thank our MCM-LTER colleagues Diane McKnight, Diana Wall, John Priscu and Andrew Fountain for their intellectual input and insights. We greatly appreciate the help of Paul Morin and Spencer Niebuhr, AGIC, University of Minnesota, for providing satellite images in a very timely manner. We also thank Joe Levy for discussions regarding subsurface water/salt flow in Taylor Valley. We thank J. Gudding, A. Jacobs, L. Miller, L. Michaud and other MCM-LTER personnel for help in sample collection. We thank B. Vaughn at INSTAAR, University of Colorado, for the stable isotope analysis. We are extremely grateful to two anonymous reviewers whose comments and criticisms greatly improved the original manuscript. The senior author thanks Prof J. Laybourn-Parry and the School of Physical Sciences and Geography for their hospitality as the first draft of this paper was completed at Keele University on a Royal Society Travel Fellowship grant to JLP and WBL.
Appendix A. Major Ion and Stable Isotope Data