As stated by many studies (Laurs and Priekulis, Reference Laurs and Priekulis2008; Voriskova et al., Reference Voriskova, Marsalek, Reichova, Zednikova and Machalek2010; Scott et al., Reference Scott, Thomson, Kerrisk and Garcia2014; Tse and Pajor, Reference Tse and Pajor2017), usage of automatic milking systems (AMS) could potentially have a profound effect for greater yield of cows and better quality of milk and for reducing the prevalence of mastitis when compared with traditional milking equipment. Particularly AMS can allow increased milking frequency, although it has been reported that an increase in milking frequency does not always result in more milk production (Ipema, Reference Ipema1991).
Large observational studies demonstrated that a balance between physiology of lactation and milking in dairy cows is crucial issue for maintaining higher milk yield and good health status. From the literature data (Dobson et al., Reference Dobson, Smith, Royal, Knight and Sheldon2007) is known that high producing cows may experience greater challenges to some aspects of reproductive function. Avoiding losses caused by these challenges is important for an effective production (Jonsson et al., Reference Jonsson, Blanke, Poulsen, Caponetti and Hojsgaard2011). Pregnancy is a significant physiological event in that the fetus makes large demands on the dam in the later periods of lactation. Loker et al. (Reference Loker, Miglior, Bohamanova, Jamrozik and Schaeffer2009) reported a decline in yields from the start of the pregnancy for Canadian Ayrshire, Jersey, Brown Swiss, and Guernsey dairy cows. AMS provides objective, frequent and accurate measures of various lactation traits. John et al. (Reference John, Clark, Freeman, Kerrisk, Garcia and Halachmi2016) noted that, while AMS controls the milking process, there have also been numerous changes to how the whole farm system is managed. To our knowledge, the effect of pregnancy on the variation of AMS performance has not been studied so far.
We aimed to describe the variability of AMS indicators during lactation of cows and addressed whether differences in milking traits of dairy cows during estrus and through diverse stages of lactation can be used as indicators to support the pregnancy in dairy farms applying automatic milking systems.
Materials and methods
Animals and management
The materials for this study were provided on a dairy farm in the eastern region of Lithuania between 2016 and 2017. The experimental cows were kept in a uniform environment and received a constant ratio of feed suitable for this stage of lactation. Before the study, the selected cows underwent a general clinical examination, and were completely healthy. Clinical signs of mastitis, lamensis and metritis were not observed. The average somatic cell concentration in the milk of the studied cows did not exceeded 1 00 000 cells/ml. Electrical conductivity of milk varied from 4.0 to 5.0 mS/cm and corresponded to the healthy cow rate (Hamann and Gyodi, Reference Hamann and Gyodi2000).
368 clinically healthy Lithuanian Black and White dairy cows of the second and third parity were included in the research from a herd of 800 cows. The cows were kept in a loose housing system, and were fed total mixed ration (TMR) throughout the year at the same time, balanced according to their physiological needs. TMR consisted of corn silage (10 kg of dry matter (DM), and alfalfa silage (15 kg DM), and wheat straw (0.5–1 kg DM), concentrates consisting mainly of soybean meal (2.5 kg DM), sunflower and linseed meals (1.0–1.7 kg DM), a commercial mixture (2.0 kg DM), a sodium bicarbonate supplement as a buffer (0.150 kg), sodium chloride (0.050 kg) and a commercial mineral mixture (0.250 kg). Cow feeding took place every day at 08:00 am and 08:00 pm.
Experimental design
Cows (n = 368) were synchronized using the Ovsynch protocol. The protocol consisted of an injection of a gonadotropin-releasing hormone (GnRH) (100 µg) on 0 d, an injection of prostaglandin F2α (PGF2α) on 7 d, another injection of GnRH (100 µg) on 9 d, and timed insemination on 10 d. Each GnRH treatment contained 2 ml of 50 µg GnRH/ml (Ovarelin® 50 µg/ml, Ceva) and each PGF2α treatment contained of 2 ml of PGF2α/ml (Oestrophan®, Bioveta Plc, Czechia; 1 ml solution containing 0.25 mg of cloprostenol) administered intramuscularly. Cows were inseminated at a fixed time 16 h after synchronization – on 91 ± 1.99 DIM. Pregnancy evaluation was performed 31 d later by ultrasound ‘Easy Scan’ (IMV imaging, French) per rectum. Pregnancy was established in 82.61% of cows (group 1, n = 304). Non-pregnant cows were resynchronized by Ovsynch protocol, on 122 ± 1.0 DIM, inseminated at a fixed time 16 h after final GnRH on 132 ± 2.24 DIM and pregnancy was established in 90.63% of cows (group 2, n = 58).
The cows were milked with the Voluntary Milking System VMS™. Productivity of cows was evaluated according to the herd management program Delaval DelPro 4.2. Milking frequency (MF) was measured as the number of milking per cow per 24 h. An interval between milkings (MI) was evaluated as the average time of MI (hours) per day. MY of cows, average milk flow rate (MS) and peak milk flow rate (PMS) were determined at the udder quarter level: left front (LF), right front (RF), left rear (LR) and right rear (RR).
Statistical analysis
A total of 1 201 713 records of udder quarters in cows from 5 to 305 DIM were analyzed.
Cows were grouped according to period of DIM: 1 (5–30 DIM), 2 (31–90 DIM), 3 (91–131 DIM), 4 (132–200 DIM), 5 (201–305 DIM) and status of reproduction: group 1 – pregnant cows after the first insemination and group 2 – pregnant cows after second insemination. We estimated changes of AMS indicators in cows during the periods of DIM and estrus in relationship with results of conceiving.
The statistical analysis of data was performed with the program package SPSS 20.0 (SPSS Inc., Chicago, IL, USA). The normal distribution for all variables was assessed with the Kolmogorov–Smirnov test and no deviation normality assumption were observed. In order to compare the differences between groups for AMS variables, a one-way variance analysis was used. The differences between the means were evaluated using Fisher's Least Significant Difference criterion. Results were expressed as the mean ± standard error of the mean. Linear regression equations were estimated in order to define relationship between investigated traits.
Results
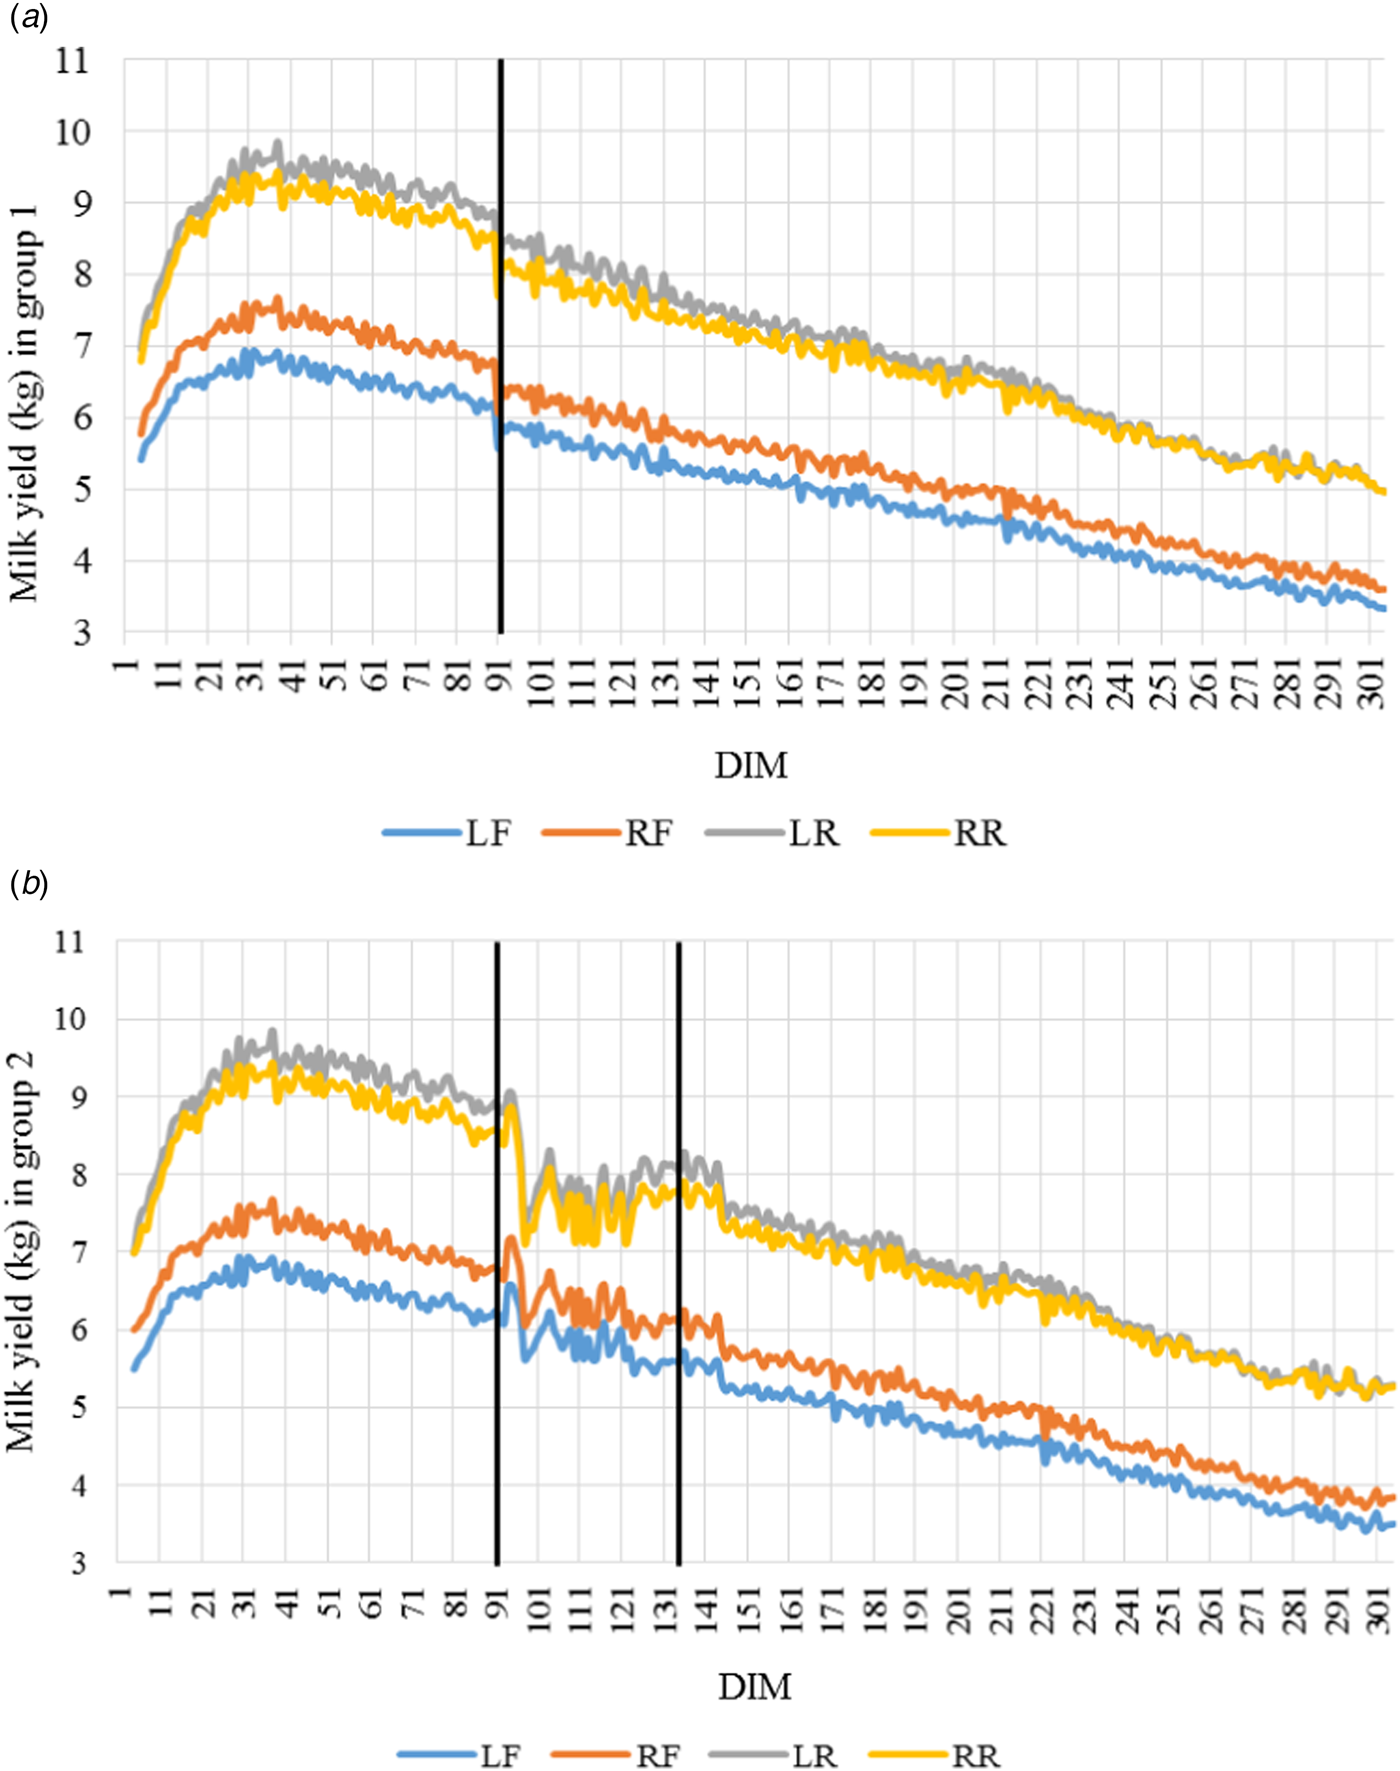
The average MY per day was 25.204 ± 0.283 kg and 25.924 ± 0.333 kg in group 1 and group 2, respectively. Table 1 indicates that cows of group 2 during the first 90 DIM after calving were more (1.61–2.20 kg milk per day) productive (P < 0.0001). MY per day (Fig. 1) was the highest in the first period of DIM and there was an increase up to 60 d of lactation, and a remained high for a while (to 90 DIM). In the following periods, we observed an decrease of MY. A statistically significant differences were determined between front and rear quarters for milk yield (P < 0.001), indicating that rear quarters for milk yield were the highest. We also determined that there were a decrease (11.05% or 3.02 kg) in MY in group 1 during estrus, whereas there were an increase from 4.48% to 5.89% of MY in the next 2 d after conceiving at the same group (P < 0.001); after that, we noticed a gradual decrease in MY of udder quarters until 305 DIM (R 2 = 0.985–0.988). The study revealed that productivity of cows in the group 2 during estrus on 91 DIM decreased by 13.89% (3.70 kg), whereas it was 11.32% (2.82 kg) during estrus on 132 DIM in the same group (P < 0.001). In non-pregnant cows after the first insemination productivity returned to the previous level in 3–4 d after estrus period. However, there was a linear decline (R 2 = 0.973–0.984) in milk yield from conceiving after the second insemination to 305 DIM.
Milk yield in udder quarters (left front – LF, right front – RF, left rear – LR and right rear – RR) of cows in group 1 (A) and group 2 (B). Data are presented as means of days in milk (DIM).

Milk yield (kg), milking frequency and interval (h) of cows (Mean ± sem)

a, b, c, d, e: The different superscripts show significant difference (P < 0.05) between group 1 and group 2 for MY, MF and MI among the DIM periods. These periods are 1: 5–30 DIM, 2: 31–90 DIM, 3: 91–131 DIM, 4: 132–200 DIM, 5: 201–305 DIM.
The averages of milking traits in the periods of DIM (Table 1) were statistically different in the groups and affected by the reproduction status of cows (P < 0.001). We observed that mean of MF in group 1 during the third period of DIM (from 91 to 131 DIM) was 34.93% lower, while MI – 28.24% longer, compared to group 2 (P < 0.001). There were no statistically significant differences in milkings traits (between means of groups) in subsequent DIM periods (from 92 to 305 DIM).
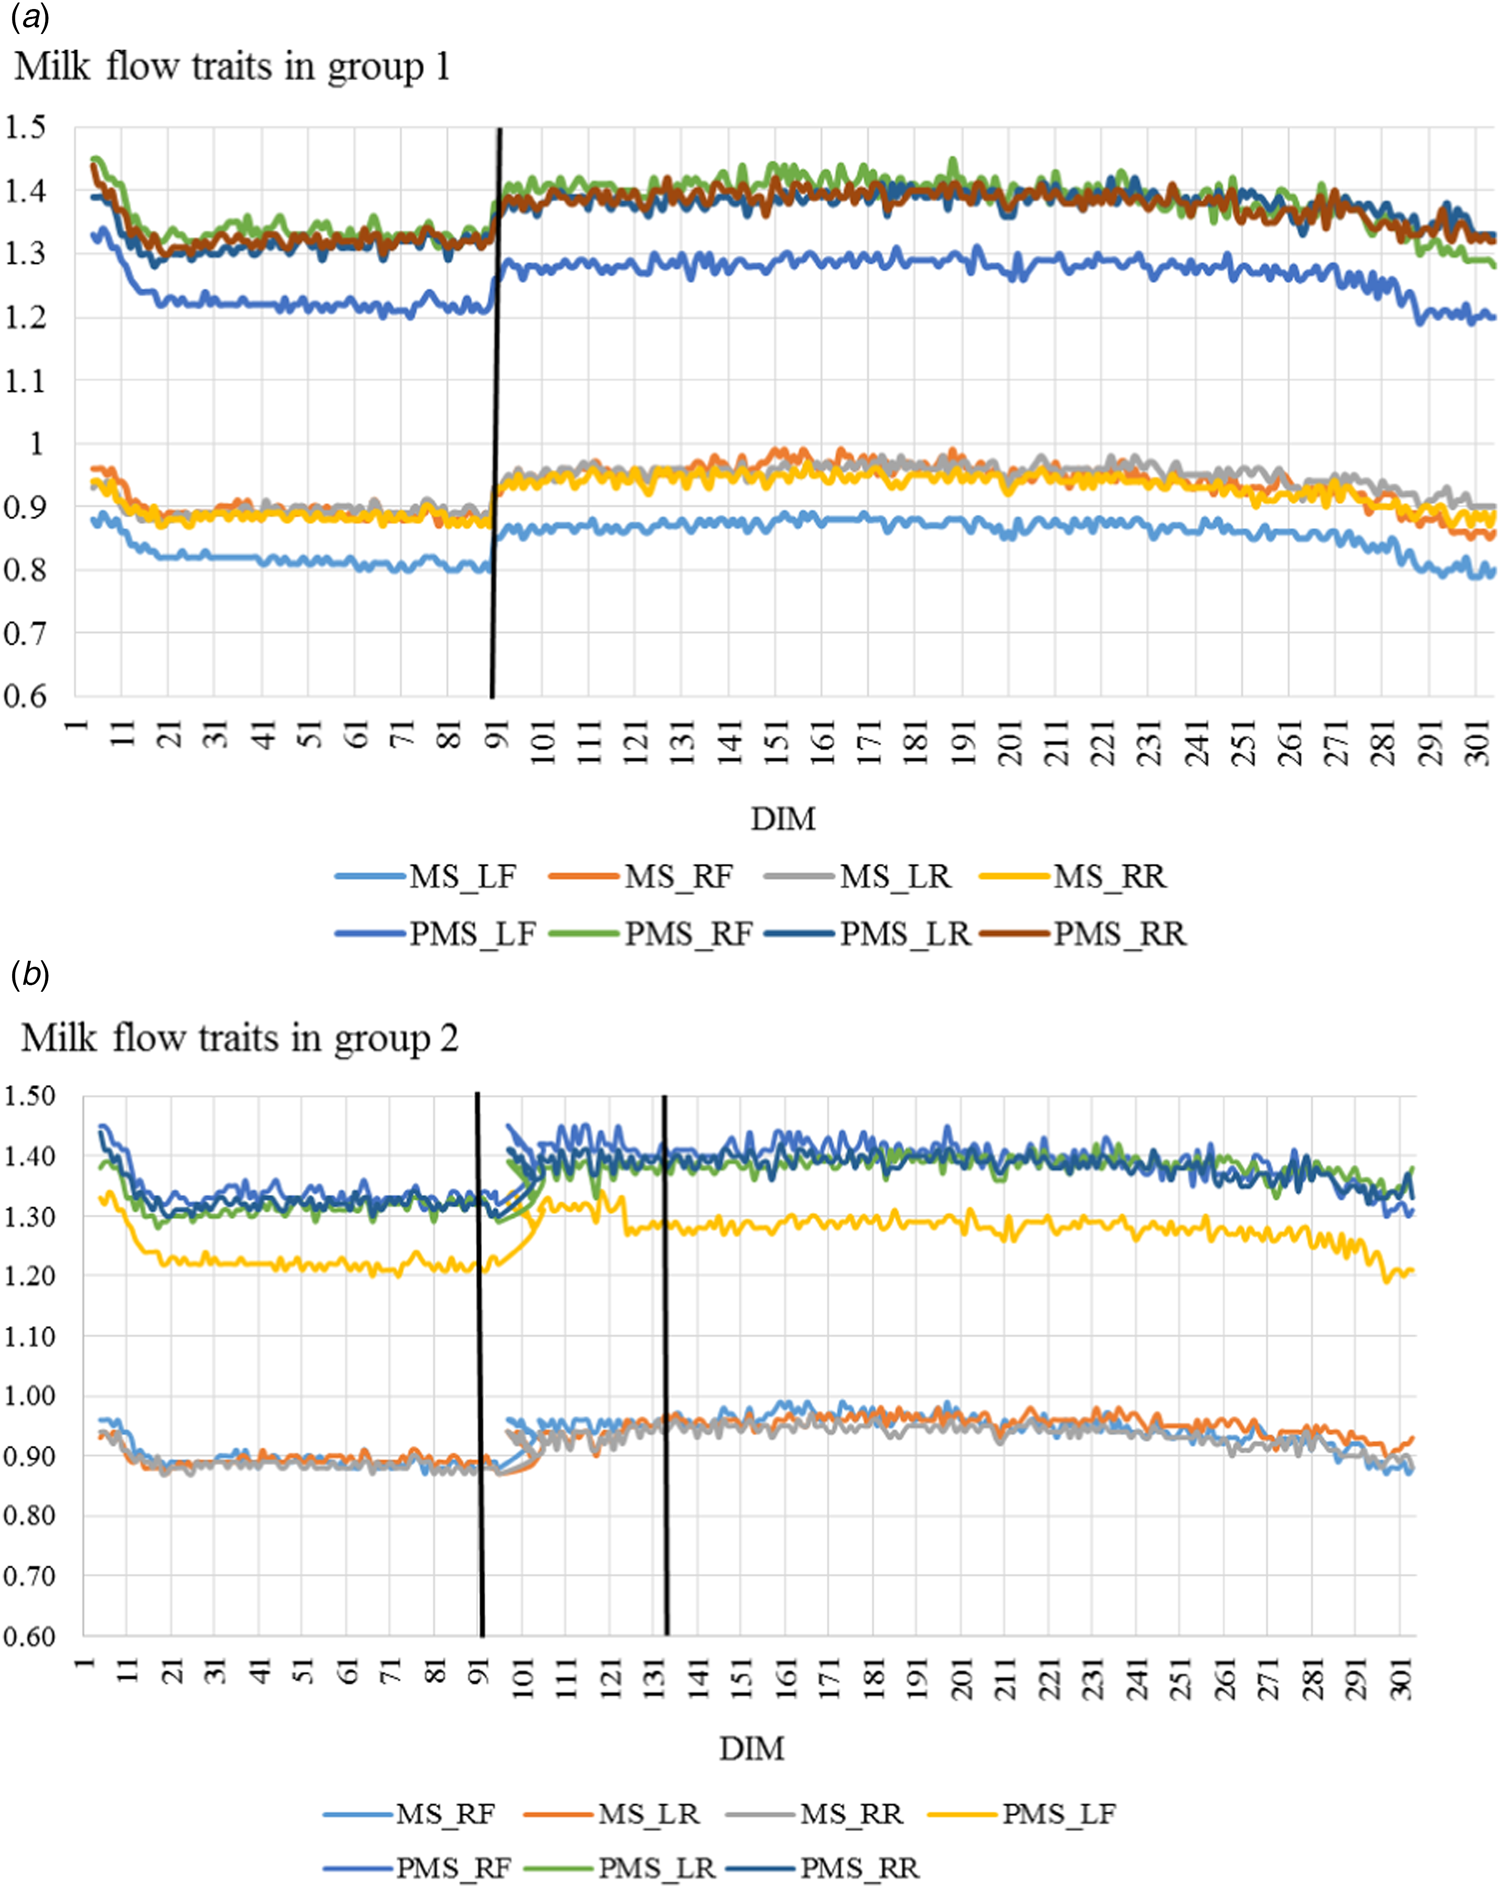
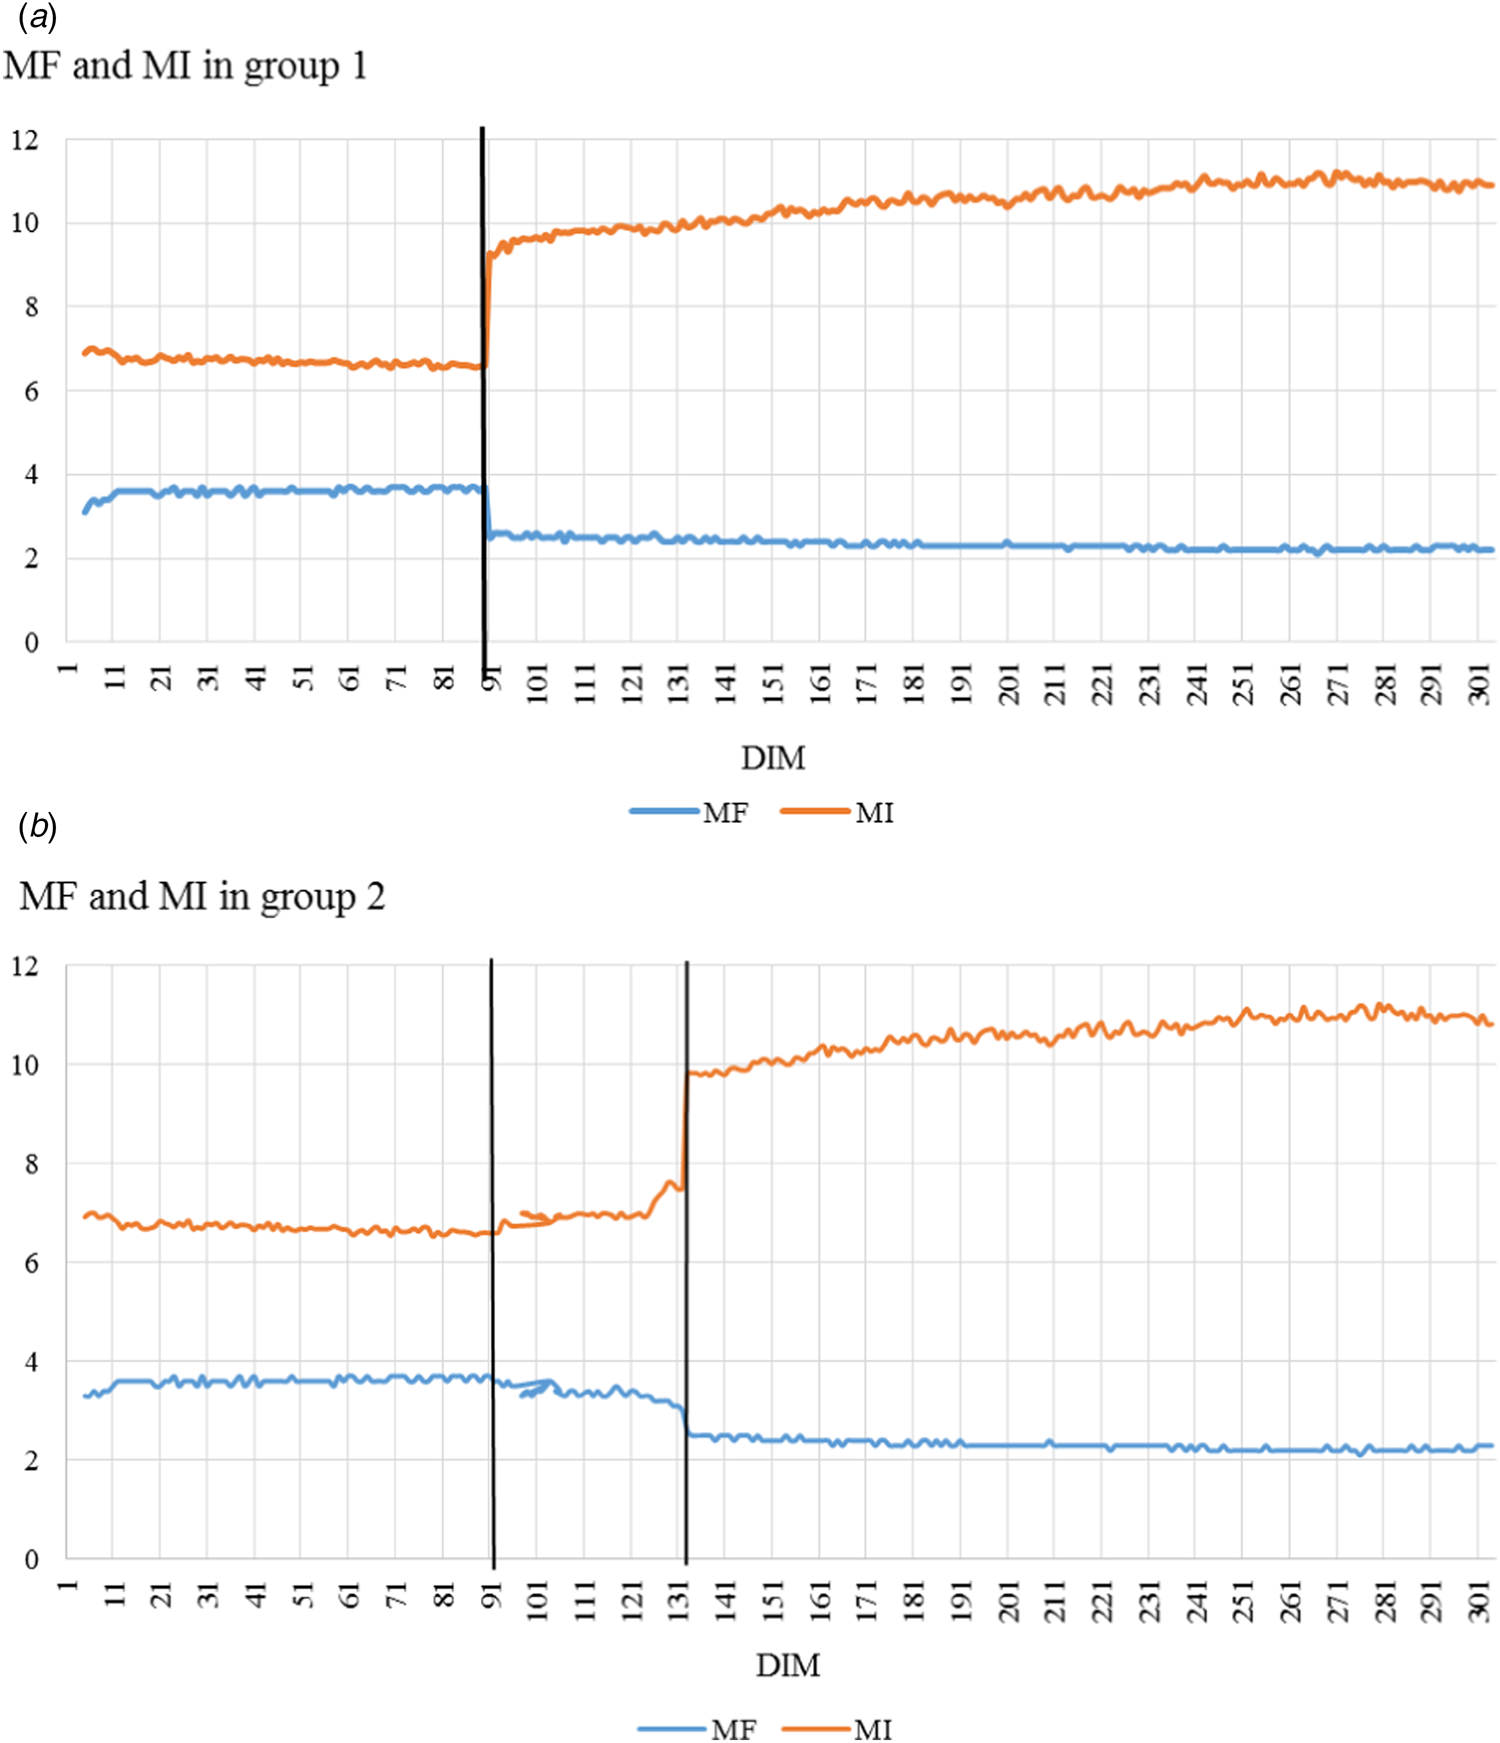
The results showed (Fig. 2) that there were significant reduction of MF in group 1 (from 3.7 to 2.5 times per day) after conceiving and in the subsequent periods of pregnancy this ranged from 2.6 to 2.2 times per day (y = −0.002x + 2.508; R 2 = 0.779). Likewise, there were similar changes in group 2 after 131 DIM (y = −0.002x + 2.457; R 2 = 0.620). Consequently, MI dramatically (40.30%) increased during estrus of cows in group 1 (P < 0.001); followed by gradually and slightly increasing in the other periods of the pregnancy (y = 0.007x + 9.727; R 2 = 0.883). In the group 2 we found a temporary increase of MI on 91 DIM (6.06%) and noticed a steady increase of this trait on 132 DIM (42.13%) and a gradual increase from conceiving to 305 DIM (y = 0.007x + 9.955; R 2 = 0.705). The MS and PMS from estrus and after conceiving of cows in group 1 rose sharply (P < 0.05) and in subsequent periods of DIM maintained the achieved level with a gradual decrease at the end of the lactation. We identified an elevation in milk flow traits in group 2 after 91 DIM and noticed a higher variation between variables for DIMs. Furthermore, slight decline in milk flow traits on 132 DIM was determined. In the later stages of pregnancy, these indicators remained at a similar level for this group (Fig. 3).
Milk flow traits of cows: average milk flow rate (MS) and peak milk flow rate (PMS) at the udder quarter level – left front (LF), right front (RF), left rear (LR) and right rear (RR) of cows in group 1 (A) and group 2 (B).

Milking frequency and interval of cows: milking frequency (MF) – the number of milkings per cow per 24 h and an interval between milkings (MI) – the average time of MI (hours) per day of cows in group 1 (A) and group 2 (B).

Discussion
Earlier findings have shown a decrease in MY after conception (Akers, Reference Akers2006). This decrease in milk production may be due to the changes of hormones causing reduction in mammary function concomitant with increasing nutrient requirements of the fetus. Using AMS in Korean Holstein cows, Vijayakumar et al. (Reference Vijayakumar, Park, Ki, Lim, Kim, Park, Jeong, Park and Kim2017) reported greater lactation length with highest MY in the early stage of lactation (55 to 90 DIM) at a mean milking frequency of 4 times/d, and the lowest MY was observed in the later stage (>201 DIM). Here, we showed a parallel productivity curve for all udder quarters with average productivity of the front udder quarters in group 1 and group 2 being 41.97% and 42.48%, respectively. This is in line with Berglund et al. (Reference Berglund, Pettersson, Ostensson and Svennersten-Sjaunja2007) data, who reported that rear quarters had higher milk yield.
Decrease of MY during estrus was observed in this study, which may be a result of reduced milk ejection because of a high 17β-estradiol (E2) level at the time of milking (Roelofs et al., Reference Roelofs, Graat, Mullaart, Soede, Voskamp-Harkema and Kemp2006). Lopez et al. (Reference Lopez, Caraviello, Satter, Fricke and Wiltbank2005) demonstrated that administration of E2 interferes with the milk-ejection reflex. Roelofs et al. (Reference Roelofs, Graat, Mullaart, Soede, Voskamp-Harkema and Kemp2006) suggested that the positive estrus predictive value of a pronounced reduction in MY is high. Halli et al. (Reference Halli, Koch, Romberg and Hoy2015) showed that MY was slightly reduced on day 1 after estrus (by 1.8 kg, 4.1%), followed by an increase of 3.3 kg (7.8%) on day 2 after estrus. However, the same scientists reported that days of estrus does not have a significant effect on daily MY, since this parameter was characterized by high variation among all days of the estrus cycle. Results of our study come close to the results found by Schofield et al. (Reference Schofield, Phillips and Owens1991), who observed an important decrease for MY on the day of estrus. Koyama et al. (Reference Koyama, Koyama, Matsui, Sugimoto, Kusakari, Osaka and Nagano2017) that the percentage of cows that ovulated 22–24 h after the first milking following estrus onset was higher in cows that had showed decreased MY compared with cows without milk reduction. The pregnancy rate in cows with milk reduction inseminated at 3–8 h after the affected milking was significantly higher than cows with milk reduction inseminated during other periods. These results (Koyama et al., Reference Koyama, Koyama, Matsui, Sugimoto, Kusakari, Osaka and Nagano2017) indicate that the optimal time for artificial insemination can be narrowed by detecting a pronounced reduction in first MY after estrus onset.
The observed increment in milking speed during estrus in this study may be related to the findings of Bruckmaier and Blum (Reference Bruckmaier and Blum1998), who reported that inhibition of oxytocin release by the central nervous system has been observed in cows after parturition and during peak of estrus. Continuous ejection of milk is dependent on the presence of elevated oxytocin concentrations during the entire milking (Bruckmaier and Blum, Reference Bruckmaier and Blum1998).
Glowicka-Woloszyn et al. (Reference Glowicka-Woloszyn, Winnicki and Jugowar2010) ascertained that benefits of AMS included increased frequency of attendance up to 2.5–3 milkings/d. Lovendahl and Chagunda (Reference Lovendahl and Chagunda2011) estimated an increase of MF of cows in automatic milking from calving (2.5–3.1 milking events/d) up to 105 DIM (3.0–3.3 milking events/d) and a decrease thereafter (2.7–3.1 milking events/d). Our results showed a decrease in MF of cows on 5–30 DIM (3.39–3.420 milkings/d) to 201–305 period of DIM (2.243–2.250 milkings/d). Our results also demonstrated a decrease in MF of cows during estrus and after conceiving. Reduction in number of milkings may be related with decrease in MY and a temporary reduction in feed intake during estrus (Koyama et al., Reference Koyama, Koyama, Matsui, Sugimoto, Kusakari, Osaka and Nagano2017). Therefore, cows after estrus onset may face a temporary deficiency of energy and decreased frequency of milkings per day. Reduction in MF in the subsequent lactation period may be associated with increasing nutrient requirements of the fetus.
In conclusion, optimal management of lactating dairy cows requires integrated programs of herd production, reproduction and health. We evaluated AMS indicators during lactation in Lithuanian Black and White cows. Gained results showed a decline in productivity of cows during estrus in all quarters of udder and a gradual decrease in MY from conceiving to 305 DIM. The milking frequency of cows significantly decreased, whilst the milk flow traits had a tendency to rise after conceiving. Changes in AMS indicators may be considered as an additional tool for improvement of management in dairy herds.