Many autocrats fear the free flow of information that is a hallmark of democratic societies (Davenport Reference Davenport1995; Egorov, Guriev, and Sonin Reference Egorov, Guriev and Sonin2009; Friedrich and Brzezinski Reference Friedrich and Brzezinski1965; Kuran Reference Kuran1991; Levitsky and Way Reference Levitsky and Way2010). To limit this threat, authoritarian regimes have developed a variety of strategies to control and manipulate the information available to the public (Guriev and Treisman Reference Guriev and Treisman2019; Guriev and Treisman Reference Guriev and Treisman2020). Primary among these strategies is censorship (Kalathil and Boas Reference Kalathil and Boas2003). The Chinese regime, for example, employs hundreds of thousands of individuals to monitor and censor citizens' social media activities. While such censorship can protect authoritarian regimes, it is costly, requiring large investments in both technology and labor (King, Pan, and Roberts Reference King, Pan and Roberts2013). Moreover, state censorship can incur reputational costs. Regimes that employ it might be “named and shamed” by other governments, international human rights organizations, or foreign investors (Keck and Sikkink Reference Keck and Sikkink1998; Murdie and Davis Reference Murdie and Davis2012).
Autocracies can avoid the costs of state censorship by using the threat of repression to encourage citizens to censor both themselves (self-censorship) and others (private censorship). Observed instances of state censorship and repression provide citizens with signals about the types of speech that might lead to a repressive response. Those who wish to minimize their risk of repression will react to these signals by censoring their own speech as well as the speech of others.
The consideration of variation in who censors invites related questions about what information the autocrat wants censored. The rapidly growing literature on authoritarian information control offers two competing theoretical expectations. One is that authoritarian regimes want to censor calls for collective action, no matter whether it is directed against the regime or not (King, Pan, and Roberts Reference King, Pan and Roberts2013). A competing perspective is that authoritarian regimes seek to censor anti-regime messages because criticism can imperil the regime by increasing grievances, reducing pluralistic ignorance, or signaling regime weakness (Huang Reference Huang2015; Kuran Reference Kuran1991; Shadmehr and Bernhardt Reference Shadmehr and Bernhardt2015). These two expectations agree that authoritarian regimes are eager to censor messages about anti-regime collective action. They diverge, however, in that the first suggests that autocracies also want to curtail non-political calls for collective action, while the second suggests that autocracies are also interested in blocking criticism without a collective action component.
To test how these competing expectations play out in the context of private censorship, we conducted a correspondence experiment with private media firms in the Russian Federation.Footnote 1 In order to establish both the extent and targets of private censorship, we examine the censorship choices of close to 1,000 Russian private media firms. We expect that these firms will censor third-party advertisements if they contain: (1) (legal) anti-regime messages; or (2) (legal) calls for political collective action. The results of our correspondence experiment largely support our a priori expectations. Advertisements containing either calls for political collective action or anti-regime messages are heavily censored by Russian private media firms. Consistent with King, Pan, and Roberts (Reference King, Pan and Roberts2013), we find that advertisements containing non-political calls for collective action are censored as well.
Our article contributes to the literatures on autocratic information control (for example, Guriev and Treisman Reference Guriev and Treisman2019; Guriev and Treisman Reference Guriev and Treisman2020; King, Pan, and Roberts Reference King, Pan and Roberts2013, Shadmehr and Bernhardt Reference Shadmehr and Bernhardt2015), public opinion formation (for example, Enikolopov, Petrova, and Zhuravskaya Reference Enikolopov, Petrova and Zhuravskaya2011; Huang Reference Huang2015; Huang Reference Huang2017, Jiang and Yang Reference Jiang and Yang2016; Kern and Hainmueller Reference Kern and Hainmueller2009; Reuter and Szakonyi Reference Reuter and Szakonyi2015; Truex and Tavana Reference Truex and Tavana2019), and, indirectly, authoritarian stability (for example, Svolik Reference Svolik2012; Truex Reference Truex2014; Wang Reference Wang2016; Wintrobe Reference Wintrobe2000) by showing how private censorship constrains regime criticism as well as collective action. We also add to a small but prominent experimental literature that uses correspondence experiments to study the inner workings of authoritarian regimes.Footnote 2 For instance, Distelhorst and Hue (Reference Distelhorst and Hue2014), in a correspondence experiment with Chinese local officials, show that officials are less likely to assist ethnic Muslims than ethnically unmarked peers. Chen, Pan, and Xu (Reference Chen, Pan and Xu2016) examine whether requests addressed to Chinese local governments are more successful if accompanied by professions of political loyalty, threats to tattle to superiors, or threats to organize collective action. To our knowledge, our article is the first to use a correspondence experiment to examine the censorship decisions of private media firms in an authoritarian regime. Much of the literature on autocratic information control concerns censorship that is either directly implemented by state and party institutions or carried out by private companies under the direct supervision of the regime. In contrast, our work focuses on the censorship decisions that private media firms make in a context where the boundaries between permitted and politically perilous speech are ambiguous (Link Reference Link2002; Stern and Hassid Reference Stern and Hassid2012).
Theory
We begin by offering a typology of censorship (see Table 1). The existing literature uses the term “censorship” to describe a wide variety of phenomena, ignoring important differences in who is responsible for censorship, when censorship occurs, and why it occurs. We hope that a typology focused on these three dimensions will bring conceptual clarity to an important strand in the literature on authoritarian politics. Our typology distinguishes between state censorship, self-censorship, and private censorship (Newton and Artingstall Reference Newton, Artingstall, Budge and McKay1994; Qualter Reference Qualter1985). We further differentiate between two types of state censorship based on when it occurs, and we distinguish between several types of self- and private censorship based on the various motivations behind it.
Types of censorship

State Censorship: Pre-censorship or Post-censorship
State censorship occurs when the state prohibits and punishes the expression of certain ideas, typically to aid leader or regime survival. This form of censorship occurs either before or after a message's dissemination. If censorship is exercised before messages are disseminated, we call it “pre-censorship.” Pre-censorship requires government approval before a message can be circulated. This was the prevailing form of book censorship in Nazi Germany, the Soviet Union, and the Eastern Bloc (Lewy Reference Lewy2016; Shane Reference Shane1995). The Chilean military regime used it to censor movies (Esberg Reference Esberg2020). Post-censorship occurs when the state censors messages that have already been published. Historical examples include book burnings during the Protestant Reformation (Fishburn Reference Fishburn2008) and in Nazi Germany (Lewy Reference Lewy2016). A contemporary example is the state-mandated removal of social media content in China (King, Pan, and Roberts Reference King, Pan and Roberts2013).
Self-Censorship: Regime-Induced or Society-Induced
Authoritarian regimes sometimes punish individuals who disseminate certain messages. They can punish individuals legally, for example, by charging them with a crime, or through extralegal means, such as forced disappearance, illegal detention, or outright murder. Even when the actual punishment of individuals is rare, “uncertainty over the limits of political tolerance amplifies repression and pushes people to control themselves” (Stern and Hassid Reference Stern and Hassid2012, 4; see also Link Reference Link2002). As a result, individuals conceal their true opinions or express opinions that are different from the opinions they truly hold. This behavior is commonly referred to as “self-censorship” or “preference falsification” (Kuran Reference Kuran1991). We call it “regime-induced self-censorship” to distinguish it from instances in which individuals falsify their preferences for reasons unrelated to the regime's wishes. We term those cases “society-induced self-censorship,” which occurs when individuals falsify their preferences not from fear of state repression, but rather to avoid violating social, cultural, or religious norms, as well as conflict with others in their social networks.
Private Censorship: Voluntary, Society-Induced, or Regime-Induced
Private censorship differs from the other two types of censorship in that it involves a private actor censoring another private actor. While self- and, to a lesser extent, private censorship have been discussed in the literature on media bias in democratic societies (for a review, see Prat and Strömberg Reference Prat, Strömberg, Acemoglu, Arellano and Dekel2013), private censorship has been largely ignored in the context of authoritarian regimes.
Individuals engage in private censorship for three reasons. First, they censor other private actors because their views are at odds with their own political or social preferences. This type of private censorship—voluntary private censorship—is not induced by the regime, which might have no issue with the views in question. For example, a newspaper might refuse to print advertisements for contraception because the newspaper's owner is against birth control, irrespective of the regime's views on family planning, or a television station might refuse to broadcast advertisements for opposition parties because the station's owner supports the ruling party. While the ruling party might applaud this decision, the private censorship is voluntary and originates in the station owner's political preferences.
Secondly, private actors censor other private actors because of social (but not political) pressure. Irrespective of their own preferences, private actors might feel compelled to avoid associating with views that society, or a relevant subset of society, disagrees with. For example, many American newspapers used to reject advertisements for certain types of contraceptives not because their owners opposed birth control, but because they expected most readers to be offended by such advertisements. Since publishers' financial success depends on circulation, publishers might censor other private actors' speech when it conflicts with societal values and beliefs. We call this form of private censorship “society-induced private censorship.”
Finally, private actors censor other private actors because they are afraid of being publicly associated with views or actors that the regime might deem “politically questionable.” We call this type of private censorship “regime-induced private censorship.” In contrast to voluntary and society-induced private censorship, regime-induced private censorship would not exist without the regime's willingness to punish actors who express (or associate with those who express) messages not to the regime's liking. For example, a television station might refuse to broadcast advertisements for opposition parties because it knows the regime would retaliate, perhaps by announcing tax audits of the station's owner or by “discovering” that the station's buildings are not built to code. Authoritarian regimes have many ways to punish those who defy their will, even if their victims' actions are formally legal under domestic laws.Footnote 3 Private actors learn what to censor by observing prior instances of state repression and censorship, which they learn about through regime announcements, media coverage, or social networks. After learning that certain types of speech can provoke a repressive response, they choose to censor similar content in order to avoid a similar fate. It should be noted that regime-induced private censorship can be widespread even when the actual risk of regime repression is low. If the expected costs of repression are very high, even a low probability of repression can make private actors unwilling to be associated with potentially dangerous speech.
Some dictatorships provide private media firms with extremely detailed censorship instructions. The Nazi regime, for example, issued daily instructions to newspapers, directing them to censor certain news items and cover others in specific ways (Hagemann Reference Hagemann1970). Chinese Internet censors, though often formally employed by private companies, receive detailed instructions from the regime, censoring content with “large scale military-like precision” (King, Pan, and Roberts Reference King, Pan and Roberts2013, 330). We classify such cases as instances of state censorship, even if censorship is formally carried out by private actors. In our view, these actors are effectively deputized as official censors, acting on direct (rather than inferred) orders from the regime.Footnote 4
Not surprisingly, autocrats have little interest in making information about censorship available to the public. Therefore, observationally, the distinction between state censorship and regime-induced private censorship is not always clear-cut. Conceptually, however, regime-induced private censorship is quite different from state censorship. State censorship implies that private actors censor a message because they have been explicitly told to censor it, while regime-induced private censorship implies that private actors censor a message because they think the autocrat wants them to censor it (and might punish them for failing to do so). It can be difficult to observe, however, whether censorship is the result of direct and detailed instructions from the regime (that is, state censorship) or induced by a diffuse climate of repression (that is, regime-induced private censorship).
These difficulties notwithstanding, it is important to distinguish between state censorship and regime-induced private censorship for at least two reasons. First, if state censorship fails to prevent private actors from speaking out, regime-induced private censorship might still constrain their opportunities to disseminate their views. If we narrowly focus on state censorship, we potentially underestimate how much an authoritarian regime constrains the free flow of information. Secondly, since regime-induced private censorship is activated through a diffuse climate of repression, we would expect its targeting to be less precise than that of state censorship. Under regime-induced private censorship, private actors have to predict which messages might get them into trouble and which messages are safe. Private actors might thus censor too little from the regime's point of view. Alternatively, a severe climate of repression might lead them to “overshoot” the target and censor anything even remotely politically sensitive, even if the regime would allow the dissemination of some of these messages. In either case, if we conflate regime-induced private censorship with state censorship, we run the risk of drawing incorrect inferences about the strategic logic underpinning autocrats' censorship behavior.
Targets of Censorship
In an influential contribution, King, Pan, and Roberts (Reference King, Pan and Roberts2013) distinguish between two theories of autocratic censorship: collective action potential theory and state critique theory. According to collective action potential theory, autocrats censor calls for political or non-political collective action but do not censor anti-regime messages. Collective action that is not tightly controlled by the regime is inherently dangerous to autocrats, especially when censorship and repression create uncertainty about citizens' political preferences. Autocrats therefore prefer to prevent any spontaneous collective action, even if it is non-political or in support of the regime. For this reason, the Chinese regime has clamped down on spontaneous collective action that was nationalistic and pro-regime (Weiss Reference Weiss2014). The Chilean military regime banned movies that glorified revolutionary movements but tolerated negative depictions of right-wing authoritarian regimes (Esberg Reference Esberg2020). In fact, autocrats sometimes encourage certain types of criticism to gather information about corruption and the performance of local officials (Egorov, Guriev, and Sonin Reference Egorov, Guriev and Sonin2009; Lorentzen Reference Lorentzen2014; Malesky and Schuler Reference Malesky and Schuler2010). Critical speech can also provide valuable information about citizens' grievances (Dimitrov Reference Dimitrov2014; Gueorguiev and Malesky Reference Gueorguiev and Malesky2019). As long as it is not coupled with collective action, criticism might allow citizens to “blow off some steam,” thus contributing to the regime's long-term stability.
State critique theory, on the other hand, holds that autocrats will censor all anti-regime messages. Their publication could increase or legitimize grievances (Chwe Reference Chwe2001) and reduce pluralistic ignorance about citizens' political preferences (Kuran Reference Kuran1991). Moreover, the unimpeded circulation of anti-regime messages could be interpreted as a sign of regime weakness, encouraging opposition activity (Huang Reference Huang2015; Shadmehr and Bernhardt Reference Shadmehr and Bernhardt2015). Finally, the narcissism of many autocrats might make any criticism of the regime, and by extension the ruler, unacceptable. Historically, the censorship of anti-regime messages has been common (Friedrich and Brzezinski Reference Friedrich and Brzezinski1965; Kuran Reference Kuran1991; Lewy Reference Lewy2016; Shane Reference Shane1995).
Experimental Design
We use a correspondence experiment to investigate the extent and targets of regime-induced private censorship among private media firms in Russia. Russia nominally protects the right to free speech.Footnote 5 However, while Russians have a de jure right to free speech, in practice, the regime often represses citizens for exercising it (Gill Reference Gill2015; Levitsky and Way Reference Levitsky and Way2010; Robertson Reference Robertson2010).
In our experiment, we contacted Russian private media firms and observed how they responded to a request involving their participation in an online advertising campaign. Our experimental sample consists of private Russian print and online media firms that maintain a news website.Footnote 6 Many of these websites either belong to magazines or national, regional, or local newspapers. The remainder are news portals that post some original content but mainly aggregate news from other sources. Before conducting our experiment, we verified that each website met a number of criteria. We dropped websites that: (1) did not provide information about advertising services; (2) did not display ads; (3) had not been updated within 30 days of our visit; (4) were affiliated with the regime or foreign entities, such as Voice of America; (5) provided content for children; (6) were hosted on free domain services such as Google pages; or (7) were hosted at foreign domain addresses (for example, .kz). If one media firm owned multiple sites (for example, one site per oblast), we dropped all but the most popular site. These selection rules left us with an experimental sample of 1,021 websites operated by private Russian media firms.
We collected covariates at the website, media firm, and regional levels, which we will utilize later when testing for treatment effect heterogeneity.Footnote 7 At the website level, we coded an indicator variable for whether the website is a general news website or serves a more specialized audience (such as fingazeta.ru, which caters to those who work in the financial market). General news websites might be more committed to journalistic norms of professionalism and therefore less likely to engage in private censorship. Alternatively, since they do not report general news and tend to have smaller audiences, websites catering to specialized audiences might attract less attention from the regime and thus feel less of a need to engage in private censorship. We also coded a variable that measures media bias.Footnote 8
At the media firm level, we coded the Euclidean distance from a media firm's business address to Moscow, as well as an indicator variable for media firms located in Moscow or Saint Petersburg. These cities are traditionally centers of opposition activity, so we might expect to see different levels of private censorship by media firms located there.
At the regional level, we observed the vote share of United Russia in the 2007 and 2011 Duma elections. We also have regionally representative survey data on Putin's popularity from the GeoRating surveys conducted by the respected Russian survey firm Public Opinion Foundation (FOM). It is conceivable that firms located in regions with weaker support for United Russia or President Putin would be less likely to engage in censorship. In addition, we have data on the repression of journalists based on the Glasnost Defense Foundation's detailed and exhaustive recording of attacks on Russian journalists. For each Russian region during the years 2012–13, we observe the total number of times criminal investigations were initiated against journalists, journalists were detained, news websites were blocked, or censorship was imposed by the state. We expect private censorship to be more common in more repressive regions.
We contacted each media firm with a request to place an online advertisement on their website. When contacting firms, we posed as the fictitious Russian nongovernmental organization (NGO) Our Alliance (Наш Альянс).Footnote 9 Requests included a copy of our proposed advertisement banner. While the text of our emails was constant, the advertisement itself was randomly assigned according to a factorial design with 3 × 2 = 6 treatment combinations. It should be noted that in no case were advertisements actually published; we measure only firms' expressed willingness to publish them. This approach was necessary to prevent harm to our experimental subjects.Footnote 10
Figure 1 shows the English translation of our emails. Figure 2 shows the six advertisements with the text translated into English. The Russian versions can be found in the SI (Figures SI-7 and SI-8). The Russian text and English translation were developed by a native Russian speaker and verified by several additional native Russian speakers living both in Russia and abroad.
Advertisement request email (English version).

Advertisements (English version).

The first design factor varies the political content of the message, with three factor levels: non-political, anti-regime, and anti-regime (+), which denotes a starker anti-regime message than the standard anti-regime factor level. The second design factor varies whether the advertisement calls for collective action (no/yes).
The non-political advertisement invites readers to learn more about the preservation of historical buildings, with the added collective action frame explicitly calling for readers to join the fight for their preservation. We chose this topic as a “control” condition since it was not a particularly salient political issue in Russia at the time of our experiment.Footnote 11
The anti-regime advertisement invites readers to learn more about the repression of free speech in Russia, a topic that is very politically sensitive. While the text of these ads does not explicitly mention the regime, the image behind the text—a photo of the Kremlin—graphically invokes the regime. Since the Kremlin is indelibly associated with the regime, indeed, represents the regime, we are confident that our experimental subjects understood the ads criticizing the lack of free speech in Russia as being critical of the regime. The added collective action frame explicitly calls for readers to join the fight against the repression of free speech.
The anti-regime (+) advertisement adds a keyboard and shackles to the image. Our design goal was to prompt media firms to explicitly consider the lack of free speech in Russia and the possibility of repression. In this way, this advertisement constitutes a stronger dose of the anti-regime treatment, with an image that invokes the same message as the text.
In order to keep the advertisements as similar as possible visually, all six images feature buildings in the background (an unspecified Russian historical building for the non-political advertisements and the Kremlin for the anti-regime advertisements) and identically formatted text of roughly the same length in the foreground.
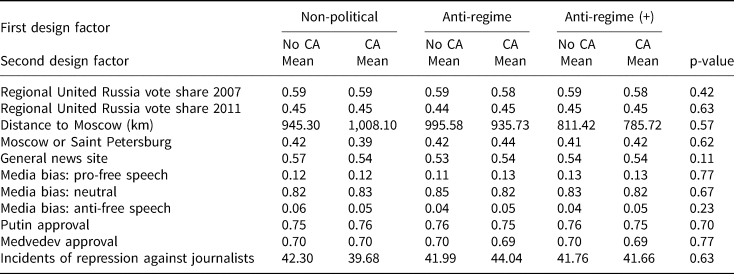
The randomization to the six treatment combinations blocked on several covariates plausibly predictive of the outcomes. Of the 1,021 firms in our original experimental sample, 67 could not be reached because of invalid email addresses. We thus dropped these firms from the sample. We also dropped one firm that formed a block by itself, a situation that complicates robust variance estimation when block fixed effects are included. The results reported in the following are based on the remaining sample of 953 firms. Each firm received a single email, with no follow-up in case of non-reply. Table 2 shows that our sample is well balanced, with covariate means similar across the six treatment groups. Exact randomization inference p-values confirm successful randomization. Following Young (Reference Young2019), we also compute an omnibus randomization inference p-value that tests for joint balance across all covariates. This p-value is 0.21, confirming that the blocked randomization was successful in balancing a wide range of observables.
Covariate balance

Note: The table shows means for all six treatment combinations as well as exact p-values from univariate randomization inference tests of the null hypothesis that balance is as good as one would expect under block random assignment. Exact p-values are approximated using 100,000 randomly chosen blocked treatment assignments. CA = collective action prompt.
We code six binary outcome measures, though it should be noted that these measures are not mutually exclusive. The first outcome, accepted ad, is coded 1 if a firm replied to our email and explicitly agreed to publish our advertisement. The second outcome, sent price list, is coded 1 if a firm sent a price list or quote, as requested in our email. The third outcome, rejected ad, is coded 1 for firms from which we received an explicit refusal to publish our advertisement. The fourth outcome, no reply, is coded 1 for firms that did not reply to our email within two weeks. Some firms replied to our email asking for additional information. Our last two outcome measures capture the nature of these requests. We distinguish between two kinds of requests. The first kind, which we call “technical request,” includes questions concerning the format or size of our advertisement or other ad-related preferences. We also include in this category requests from firms to give them a call to discuss business matters such as pricing. The second kind, which we call “political request,” captures instances where firms inquired about the content of our advertisement or the aims of our fictitious NGO. Questions about the goals of our organization were by far the most common type of request we received. We regard technical requests as a sign that a firm is open to the possibility of publishing our advertisement, whereas political requests might indicate that a firm has some doubts about publishing our advertisement.
As outlined in the pre-registered design of our study, we expected Russian media firms to censor anti-regime ads given that these firms would undoubtedly have been familiar with prior instances of repression of critical speech. We also expected that combining anti-regime ads with collective action appeals would further increase censorship since such a combination would have been even more likely to draw the attention of the regime. Furthermore, we expected anti-regime (+) ads to be more heavily censored than standard anti-regime ads. One reason for this expectation was that the use of imagery of repression might be more likely to provoke repression by the authorities. Alternatively, such imagery might have prompted firms to give greater thought to the likelihood of repression. Finally, we did not expect non-political ads with the collective action frame to be censored at a higher rate than non-political ads without the collective action frame. This expectation, which turned out to be incorrect, was based on our impression that the Russian regime rarely punishes individuals for distributing collective action messages that do not contain implicit or explicit criticisms of the regime.
Empirical Results
The response rate in our experiment is 24.2 per cent. Even though this relatively low response rate weakens the statistical power of our analyses, we are still able to document systematic patterns in responses that are highly statistically and substantively significant.
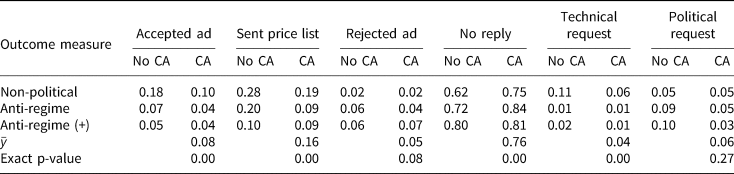
For each of the six binary outcomes, Table 3 displays the cell means for the six cells formed by our 3 × 2 factorial experiment. The first three rows show the non-political, anti-regime, and anti-regime (+) treatment conditions. The column headings indicate whether advertisements additionally contain a collective action prompt. The second-to-last row shows the unconditional mean of each outcome variable. The last row shows exact p-values from randomization inference tests of the sharp null hypothesis that none of the treatments has any effect for any subject (Imbens and Rubin Reference Imbens and Rubin2015, ch. 5; Young Reference Young2019). Based on these randomization inference tests, we can strongly reject the sharp null hypothesis for the accepted ad, sent price list, no reply, and technical request outcomes. The p-value for the rejected ad outcome is 0.08, which is not surprising given the small fraction of firms (5 per cent) that explicitly declined to publish our advertisement. We cannot reject the sharp null hypothesis for the political request outcome. The omnibus p-value across all six outcome measures is < 0.001, strongly rejecting the sharp null hypothesis that none of the treatments has any effect on any of the six outcome measures for any subject.
Experimental estimates and randomization inference

Note: This table shows cell means for binary outcome measures for each combination of the factorial experiment. The second-to-last row shows the unconditional mean of each outcome variable. The last row shows exact p-values from randomization inference tests of the sharp null hypothesis that none of the treatments has any effect for any subject. Exact p-values are approximated using 100,000 randomly chosen blocked treatment assignments. CA = collective action prompt.
We rely on probit models for a more detailed analysis of the data. For now, we focus on average treatment effects; in the following, we will consider treatment effect heterogeneity. Given the relatively small number of firms that explicitly agreed to publish our advertisement, we combine the accepted ad and sent price list outcomes into a single positive reply outcome. This aggregation is unproblematic since firms would not have sent price lists or quotes unless they were willing to publish our advertisement. Given the small number of firms that explicitly declined to publish our advertisement, we also combine the rejected ad and no reply outcomes into a single negative reply outcome. Aggregating these outcomes loses little information and makes the empirical analysis in the next section more tractable. Note that the positive reply outcome and the negative reply outcome are not simply mirror images of each other; some reply emails asked for additional information but neither accepted nor declined to publish our ad.Footnote 12
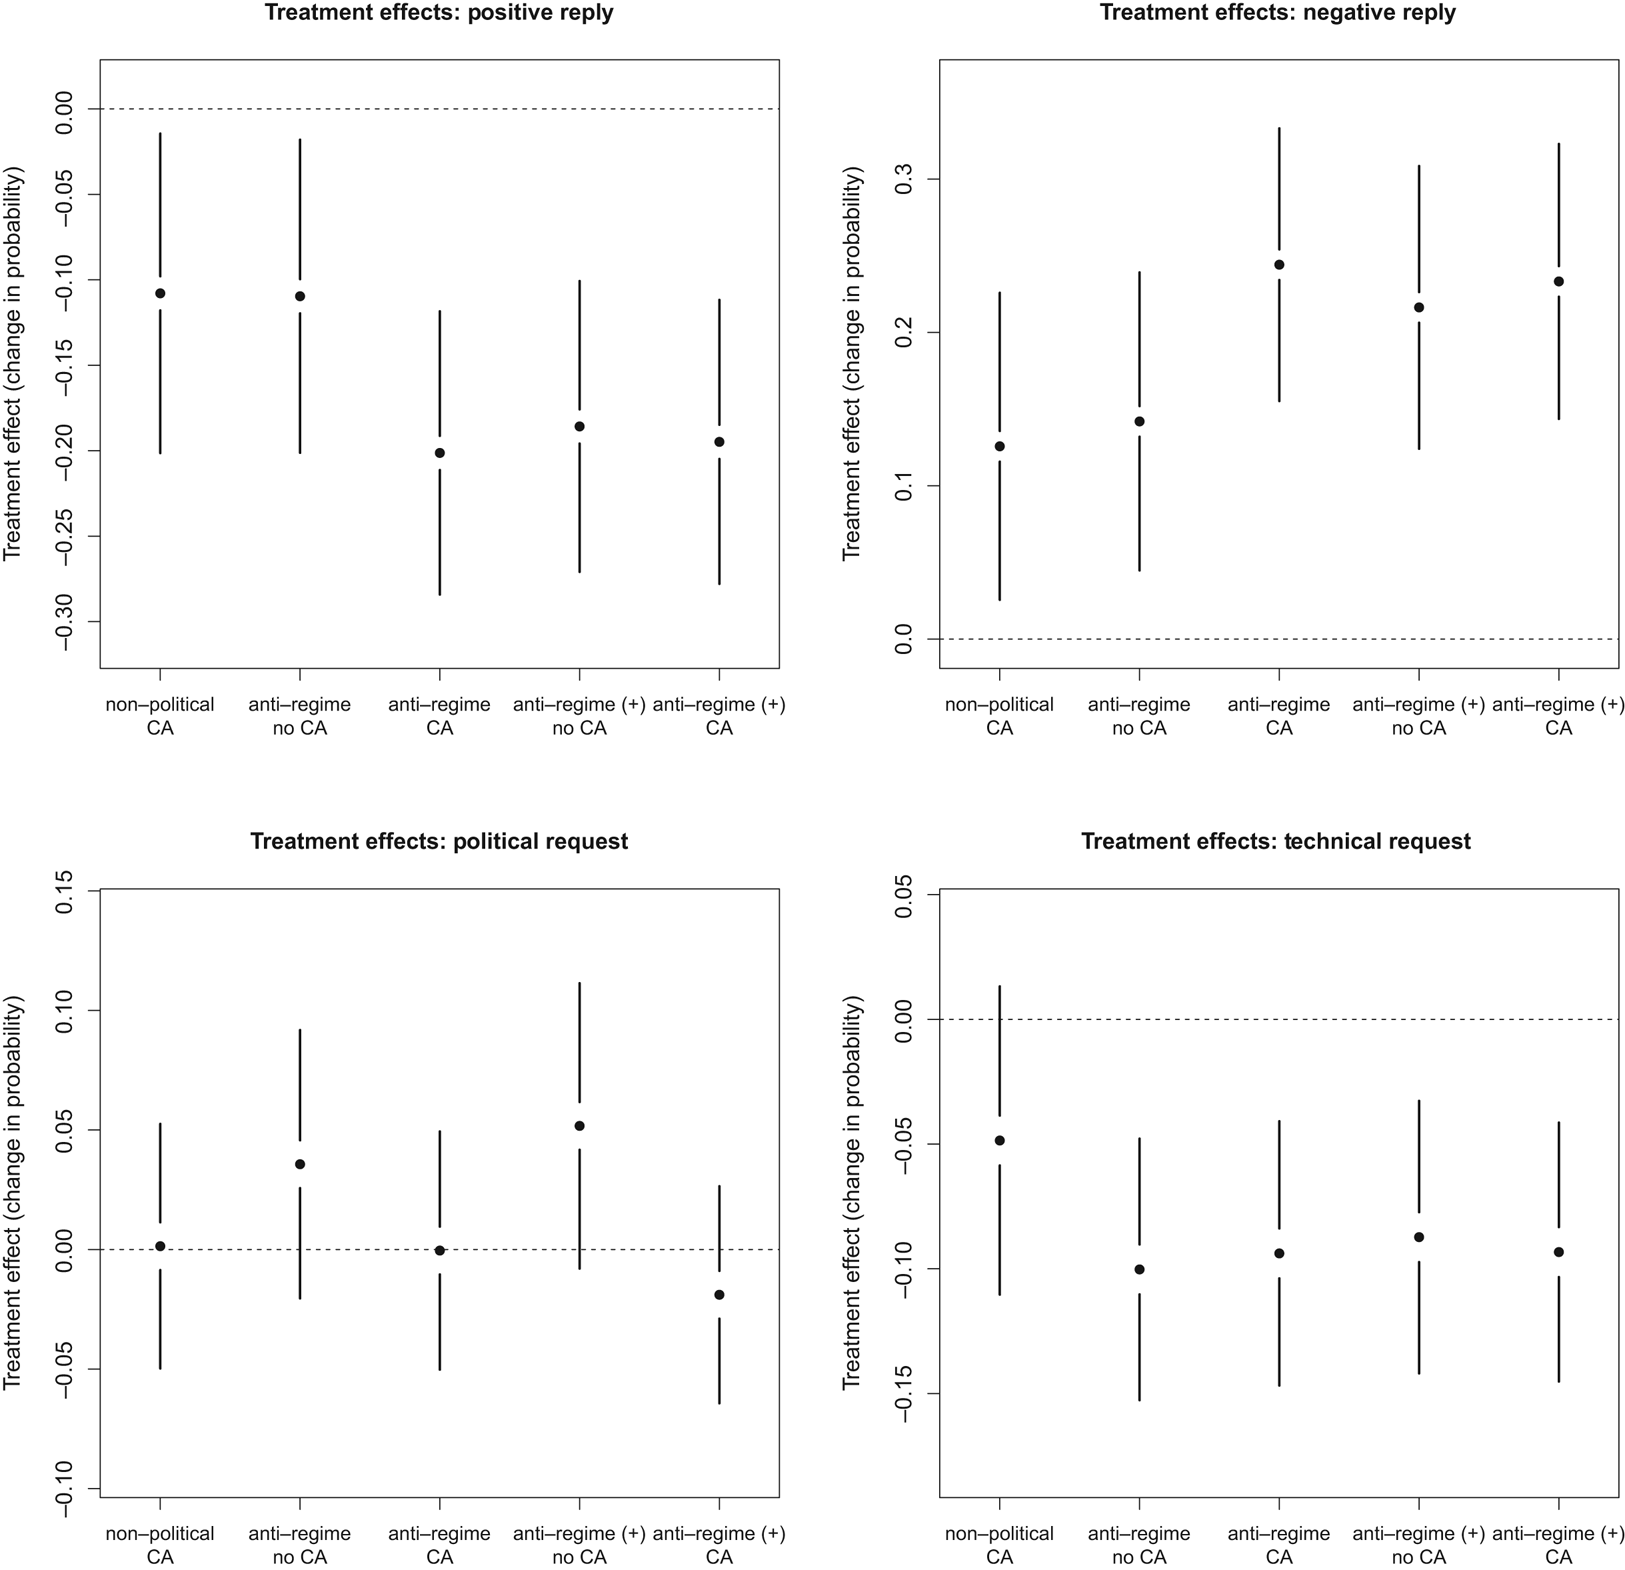
Figure 3 displays estimated treatment effects for four different outcomes. Treatment effects are computed relative to the baseline condition (non-political ad, no collective action framing).Footnote 13 Point estimates and 95 per cent confidence intervals are shown. Starting in the top-left corner and moving clockwise, the plots show estimates for the positive reply outcome, the negative reply outcome, the technical request outcome, and the political request outcome.
Treatment effect estimates from probit models.
Note: The plots display simulated treatment effect estimates (changes in probabilities) from probit models. Point estimates and 95 per cent confidence intervals are shown. Treatment effects are computed relative to the baseline condition (non-political ad, no collective action framing). CA = collective action prompt.

Outcome: Positive Reply
We start with the top-left plot, which shows treatment effects for the positive reply outcome. We find that relative to the baseline condition of a non-political ad without the collective action framing, all treatments have a highly statistically significant and substantively large effect on the probability of receiving a positive reply. Adding the collective action frame to the non-political ad reduces the probability of receiving a positive reply by 11 percentage points. The effect of the anti-regime message without a collective action frame also equals −11 percentage points. Combining anti-regime messaging with the collective action frame increases the treatment effect to −20 percentage points. Finally, the treatment effect for the anti-regime (+) ad is very similar to the effect for the anti-regime ad combined with the collective action frame, irrespective of whether it is combined with the collective action frame or not. Very few firms are willing to publish the anti-regime (+) ad, and for these firms, adding the collective action frame makes no further difference.
Outcome: Negative Reply
The top-right plot in Figure 3 shows estimated probabilities for the negative reply outcome. Relative to the baseline condition of a non-political ad without the collective action framing, all treatment combinations increase the probability of receiving a negative reply. The pattern largely mirrors the results for the positive reply outcome.Footnote 14 Relative to the baseline condition, the non-political ad with the collective action frame increases the probability of receiving a negative reply by 13 percentage points. The anti-regime ad without the collective action frame increases the probability of a negative reply by 14 percentage points. Combining the anti-regime ad with the collective action frame increases the probability of a negative reply by 24 percentage points relative to the baseline condition. Results for the anti-regime (+) ad are very similar to the estimates for the anti-regime ad combined with the collective action frame, irrespective of whether the collective action frame is present or not.
Outcome: Technical Request
Next, we turn to the bottom-right plot in Figure 3, which shows estimated treatment effects for the technical request outcome. The treatment effect for the non-political ad with the collective action frame is an imprecisely estimated −5 percentage points; this estimate is not statistically significantly different from zero. The estimates for the other four treatment combinations are all very similar no matter whether we use the anti-regime or anti-regime (+) message and whether the collective action frame is present or absent. For all four treatment combinations, the effect estimates are around −9 percentage points; all of these estimates are highly statistically significant. The results indicate that when confronted with anti-regime ads, firms are less likely to request additional technical information, a clear sign that they are less willing to entertain the possibility of publishing our ads.
Outcome: Political Request
Finally, the bottom-left plot in Figure 3 plots estimated treatment effects for the political request outcome. All estimates are small, hovering around zero, and none are statistically significant. This result is consistent with the randomization inference test shown in Table 3. Given the small number of emails containing what we call political requests, it is not surprising that we cannot detect a systematic relationship between this outcome and the various treatments. Most firms did not bother sending us questions about the goals of our ad campaign or fictitious NGO and simply based their replies on the information and banner image included in our recruitment email.
Overall, our results show that Russian private media firms avoid publishing third-party messages online that either criticize the regime or contain appeals for collective action, even if the collective action is non-political and benign. Both of these effects are substantively large and highly statistically significant; combined, they reduce the probability that one of our advertisements is accepted for publication by roughly two thirds (from 29 per cent to 10 per cent) (see the top-right plot in Figure SI-10). The size of these effects illustrates the importance of private censorship in Russia.
While readers will naturally compare our results to those reported in King, Pan, and Roberts (Reference King, Pan and Roberts2013), we should note that our ads differ from their social media content in several ways. First, our ads criticize the regime but do not provide the regime with any useful information about the behavior of local officials or unknown grievances. In contrast, at least some of the messages that King, Pan, and Roberts (Reference King, Pan and Roberts2013) classify as criticizing the regime do contain this sort of information (Gueorguiev and Malesky Reference Gueorguiev and Malesky2019). Secondly, many of the critical posts in King, Pan, and Roberts (Reference King, Pan and Roberts2013) respect the long-standing rule of Chinese discourse that it is permissible to criticize specific policies but not the Chinese Communist Party's rule. In contrast, our anti-regime ads might be seen to express broader dissatisfaction with the Putin regime. Thirdly, our collective action framing differs to some extent from the collective action messages in King, Pan, and Roberts's (Reference King, Pan and Roberts2013) social media posts. Our collective action frame is linked to a specific organization, our fictitious NGO Our Alliance, and thus goes beyond purely spontaneous collective action, which is predominant in the Chinese social media posts. These subtle yet important differences offer possible explanations for the different patterns documented here and in King, Pan, and Roberts's (Reference King, Pan and Roberts2013) path-breaking contribution.Footnote 15
Treatment Effect Heterogeneity
The analyses in the previous section provide strong and consistent evidence of private censorship among Russian private media firms. We now seek to shed further light on the nature of this censorship. As discussed in the theory section, there are a variety of possible concerns that may have motivated media firms to reject politically sensitive ads at a greater rate. In this section, we investigate heterogeneity in treatment effects to see whether it allows us to empirically distinguish between these potential explanations for private censorship.Footnote 16
Society-Induced Private Censorship
We begin by exploring whether readers' political preferences influenced firms' responses to the various treatments. One possibility is that firms rejected the anti-regime ads to avoid offending their readers. If an outlet's readers tend to support the regime and its actions, then—regardless of the regime's preferences—editors might wish to eschew publishing messages that could anger or alienate their audience. Our theoretical framework would classify this motivation as society-induced private censorship.
Did readers' political support for the regime systematically discourage firms from publishing politically sensitive ads? To investigate, we compare treatment effects in regions with higher support for Putin and United Russia to treatment effects in regions with lower support.Footnote 17 If fears of alienating a pro-regime readership were motivating editors to reject politically sensitive ads, then we should expect to see larger treatment effects for firms located in regions where political support for the regime is high.
For this and all other tests in this section, we present results for the positive reply outcome; results for the negative reply outcome are qualitatively similar and have been relegated to the SI. To test for treatment effect heterogeneity, we interact all treatment dummies in the probit model in Table SI-5 with a binary variable created by dichotomizing a given covariate at its sample median. In other words, we are comparing treatment effects for firms with a covariate value above versus below the median. Dichotomizing covariates in this manner allows us to avoid functional form assumptions and ensures that our inferences are not driven by extrapolation.
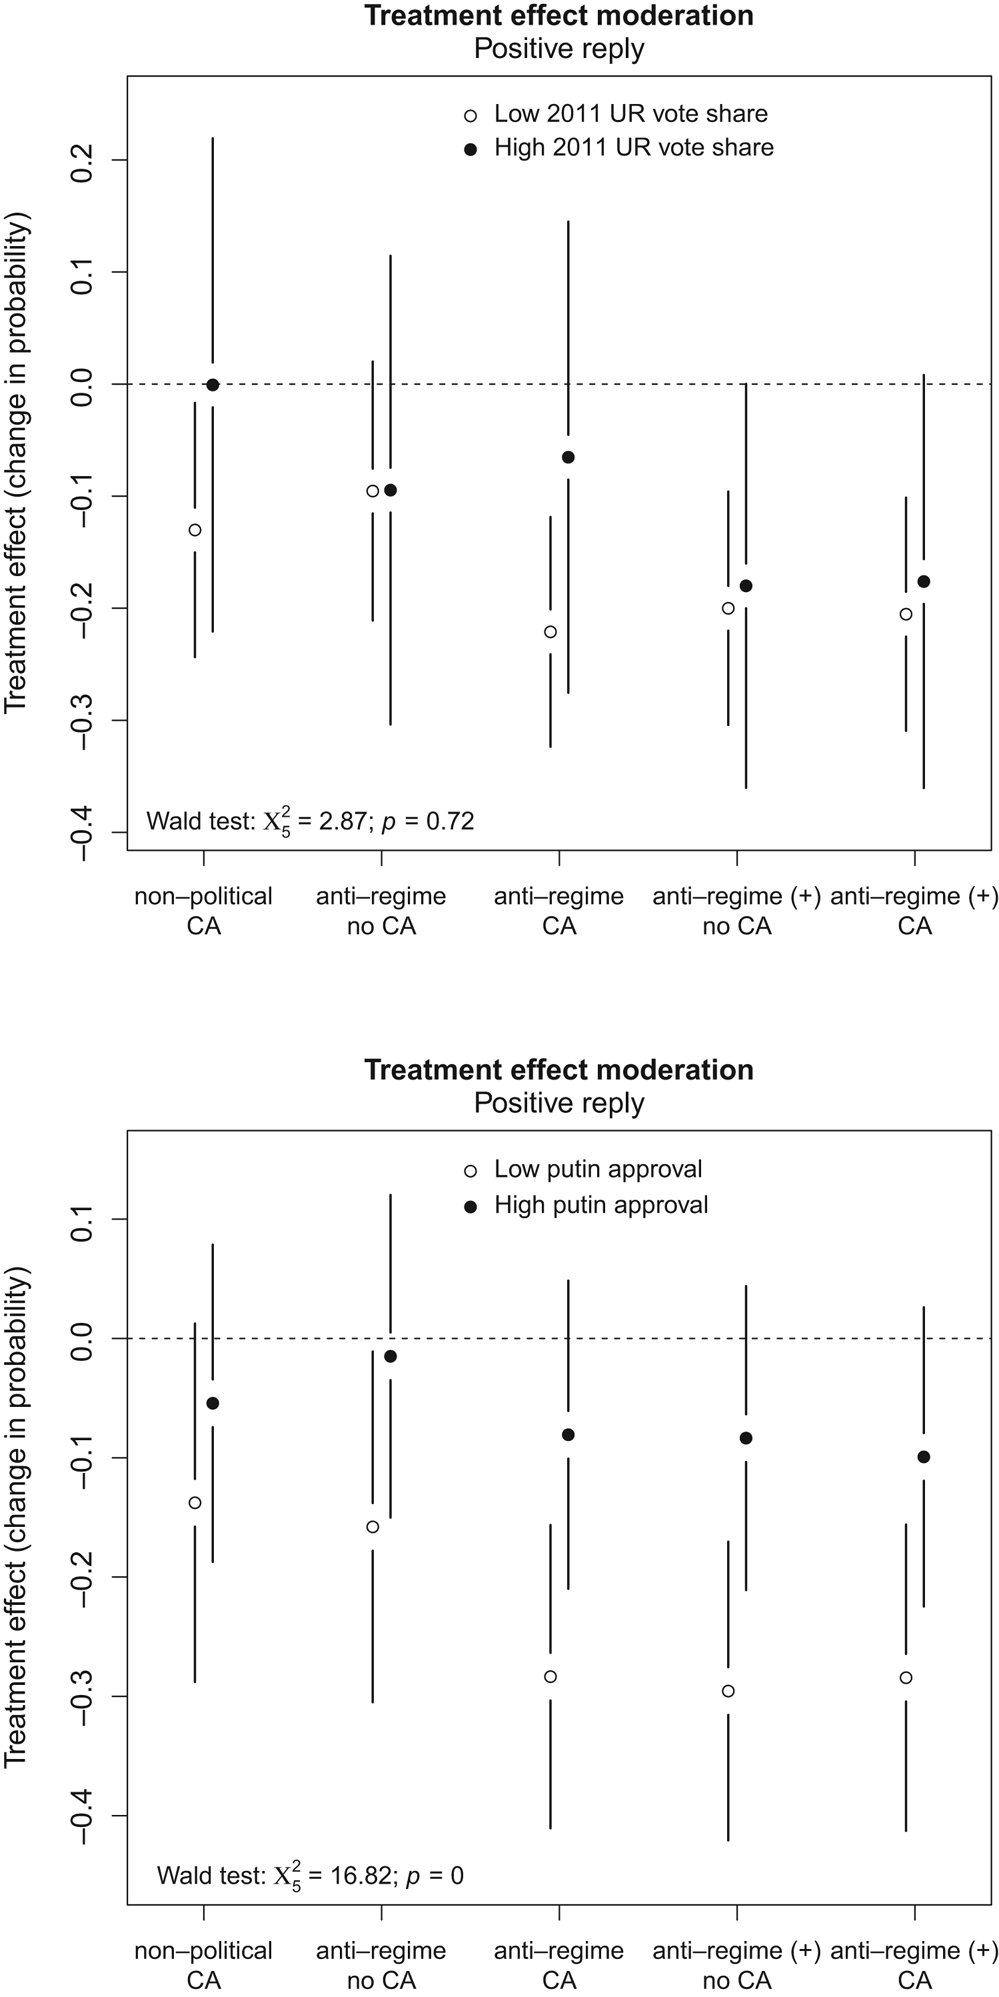
Figure 4 displays the results for two different covariates measuring regime support. First, the top plot shows treatment effect heterogeneity based on United Russia's regional vote share in the 2011 Duma elections, where empty (filled) circles denote effect estimates for firms located in regions with vote shares below (above) the median. As the plot illustrates, treatment effects may be somewhat smaller in regions in which United Russia received above-median vote shares, though the Wald test is unable to reject the joint null hypothesis of no treatment effect heterogeneity. This pattern is inconsistent with society-induced censorship; if society-induced censorship was driving our results, we would expect regions with higher electoral support for United Russia to see more (and not less) censorship of politically sensitive ads.Footnote 18
Treatment effect heterogeneity.
Note: The plots display simulated treatment effect estimates (changes in probabilities) from probit models for firms with covariate values below the sample median (empty circles) versus firms with covariate values above the sample median (filled circles). Point estimates and 95 per cent confidence intervals are shown. Treatment effects are computed relative to the baseline condition (non-political ad, no collective action framing). The Wald test statistic tests the joint null hypothesis that treatment effects are the same for firms with covariate values below and above the sample median. CA = collective action prompt.

Figure 4's bottom plot examines effect heterogeneity using public support for President Putin, as measured in regionally representative public opinion polls. We find a clear, statistically highly significant pattern: treatment effects are much smaller in regions in which Putin is more popular. Contrary to the idea that our findings are driven by society-induced censorship, firms in regions where Putin is particularly popular are more likely to publish our ads. For such firms, treatment effects are fairly close to zero and statistically insignificant. Only when we look at firms located in regions in which Putin is less popular, relatively speaking, do we see private censorship emerge.Footnote 19 Clearly, this result also does not support the notion that audience demands are driving the private censorship in our experiment. If anything, these surprising results are more consistent with an environment of regime-induced private censorship, with media firms in more competitive regions perceiving a greater need to be careful about the third-party messages they publish. We return to investigating the repressiveness of the environment shortly.
Voluntary Private Censorship
An alternative explanation for our results is that media firms themselves disagreed with the contents of our politically sensitive ads and therefore chose not to publish them. If so, then our results reflect editors' own preferences (voluntary private censorship) and not fear of government reprisal (regime-induced private censorship). While it is impossible to exclude the possibility that some editors decided not to publish our ads based on their personal preferences, several pieces of evidence undercut the likelihood that editors' personal preferences are the primary factor driving our main results.
First, even if it were true that media firms chose not to publish ads criticizing the lack of freedom of speech in Russia because they disagree with this message, it is hard to imagine that they somehow also systematically oppose collective action to preserve historical buildings.Footnote 20 By itself, the fact that we find such an effect suggests that media firms had additional reasons for rejecting our ads besides merely personally disagreeing with their content. Secondly, incorporating proxies for editorial preferences does not reveal patterns consistent with voluntary private censorship. If we assume that editors of regional news outlets share, on average, their readers' political preferences, then the previous analyses' finding that firms in more pro-regime regions are not more likely to reject politically sensitive ads undermines this interpretation. Better yet, we can examine treatment effect heterogeneity using our measure of media bias, which more directly measures media firms' attitudes toward freedom of speech. Media firms that have publicly supported crackdowns on free speech should be much less likely to publish our anti-regime ad than media firms that have spoken out in favor of free speech, yet additional analyses produce no evidence of treatment effect heterogeneity with respect to our media bias measure (see Figure SI-16).Footnote 21
Ultimately, it is quite possible that editorial preferences may have motivated some rejections, but we are skeptical that they are driving the main results. The lack of discernible treatment effect heterogeneity speaks against interpreting our results entirely in terms of voluntary private censorship. Moreover, firms' aversion toward collective action in a non-political ad suggests that even if such motivations were present, additional factors likely had an impact on firms' decisions.
Regime-Induced Private Censorship
Finally, we turn to examining the data for signs that the potential threat of government reprisal played a role in how media firms reacted to our ad requests. Is there evidence of regime-induced private censorship? The top plot in Figure 5 begins by examining heterogeneity in treatment effects between general and specialized news sites. Private censorship is consistently larger for general news sites catering to a broad audience than news sites that serve a more specialized audience. Our interpretation of this pattern is that firms catering to general audiences attract (or at least think they will attract) more attention from the regime and thus feel more of a need to engage in private censorship. Conversely, specialized news sites have a statistically significantly smaller audience than general news sites, as measured by Alexa Reach Ranks (p = 0.045). This might reasonably make them less worried about publishing controversial ads since the regime is presumably more concerned with media firms that reach larger audiences.
Treatment effect heterogeneity.
Note: The plots display simulated treatment effect estimates (changes in probabilities) from probit models for firms with covariate values below the sample median (empty circles) versus firms with covariate values above the sample median (filled circles). Point estimates and 95 per cent confidence intervals are shown. Treatment effects are computed relative to the baseline condition (non-political ad, no collective action framing). The Wald test statistic tests the joint null hypothesis that treatment effects are the same for firms with covariate values below and above the sample median. CA = collective action prompt.

The strongest evidence in favor of regime-induced private censorship appears in the bottom plot of Figure 5, which shows how treatment effects differ by the level of repression experienced by journalists across Russian regions based on data collected by the Glasnost Defense Foundation.Footnote 22 As the plot makes clear, the media firms in our sample are much less likely to reply positively to our inquiry if they are located in a Russian region with high levels of repression directed at journalists. In fact, treatment effects are not statistically significant if we focus on the group of firms located in regions with repression levels below the median. Only when we focus on firms located in the more repressive Russian regions do we see large amounts of private censorship. This pattern strongly supports the view that the private censorship we document in this article is at least partially driven by media firms' concerns about how the regime might react to the publication of politically sensitive ads containing calls for collective action or anti-regime messages.Footnote 23
We present additional plots of heterogeneous treatment effects in the SI. We fail to find statistically significant heterogeneity for distance to Moscow, for firms located in Moscow and Saint Petersburg versus firms located in other cities, United Russia vote shares in the 2007 Duma elections, and a host of other covariates.
Overall, our results provide robust evidence that Russian private media firms censor messages that contain collective action appeals or anti-regime messages. Furthermore, the evidence suggests that media firms do not simply conform to societal attitudes. Instead, the finding that censorship is particularly high in regions with high levels of state repression of journalists suggests that private censorship is at least in part regime-induced. Firms located in regions with higher levels of state repression are more cautious about the types of third-party ads they are willing to publish because they are cognizant of the risks involved. This reading of the empirical evidence suggests that our results are driven not simply by the political preferences of the media firms themselves, but by private censorship induced by Russia's repressive regime. The fact that treatment effects do not vary with our (admittedly imperfect) measure of media bias also supports this interpretation.
The finding that private media firms censored advertisements that contained a collective action message but no regime criticism runs counter to our theoretical expectations. One possible explanation is that media firms have incomplete information about regime preferences. This uncertainty might lead them to censor messages that the regime opposes as well as messages that are not politically sensitive (Link Reference Link2002; Stern and Hassid Reference Stern and Hassid2012). An alternative explanation is that private media firms are politically sophisticated enough to discern that any collective action message, even if ostensibly non-political, is politically sensitive and might invite repression by the regime (King, Pan, and Roberts Reference King, Pan and Roberts2013). Finally, it is possible that our “control” condition was not entirely non-political, leading media firms to censor these messages at least to some extent. Based on the available data, we cannot distinguish between these possibilities.
Conclusion
Our study offers the first systematic evidence of regime-induced private censorship in an authoritarian regime. While prior research has examined the types of content that authoritarian regimes censor, our investigation focuses on the censorship behavior of private media firms. The results of our correspondence experiment suggest that Russian private media firms censor other private actors even in the absence of direct government directives. Specifically, the results suggest that in the context of Russia, private actors censor the messages of other private actors when those messages include anti-regime messaging, calls for collective action, or both. These results are partially consistent with the evidence presented in King, Pan, and Roberts (Reference King, Pan and Roberts2013) in that they show that private actors censor content with a collective action appeal even when the message itself is non-political. However, the private media firms in our study also censor anti-regime speech in the absence of a call for collective action. In contrast to the Chinese social networks studied by King, Pan, and Roberts (Reference King, Pan and Roberts2013), our evidence suggests that Russian private media firms operate under the assumption that the regime disapproves of public speech critical of the regime, which induces them to censor such speech by other private actors. We believe that explaining cross-national differences in censorship strategies and targets of censorship is a particularly fruitful line of future research. Finally, we hope that the typology of censorship proposed here will be helpful to other scholars studying authoritarian regimes' strategies of information control.
Supplementary Material
Online appendices are available at https://doi.org/10.1017/S0007123421000351.
Data Availability Statement
Replication data for this article can be found in Harvard Dataverse at: https://doi.org/10.7910/DVN/WAEFB1.
Acknowledgements
We thank William Berry, Dan Butler, Jesse Driscoll, James Fowler, Micah Gell-Redman, Matt Golder, Sona Golder, Don Green, Dimitar Gueorguiev, Jennifer Pan, Molly Roberts, Arturas Rozenas, Paul Schuler, Tara Slough, Joe Wright, Nikita Zakharov, and seminar participants at Columbia University, Florida State University, George Washington University, Peace Research Institute Oslo (PRIO), Pennsylvania State University, University of Denver, University of Michigan, University of North Texas, University of Pittsburgh, University of Texas at Dallas, the 2015 Southern Political Science Association meeting, the Eighth Annual New York University Center for Experimental Social Science Experimental Political Science Conference, and Empirical Implications of Theoretical Models 2015 for extremely helpful comments. We are also grateful to Ruben Enikolopov for his help in securing Institutional Review Board approval for this study.
Financial Support
None.
Conflicts of Interest
None.
Ethical Standards
The research reported in this article was reviewed by the Pennsylvania State University Institutional Review Board (#STUDY00000487).