Introduction
In 1961, Frank Drake (Drake & Sobel Reference Drake and Sobel1994) introduced his now famous equation, an algebraic expression that gives the total number of extraterrestrial civilizations capable of communicating with Earth's inhabitants as:
 $$N = R_{\rm {^\ast}} f_{\rm g} f_{\rm p} n_{\rm e} f_{\rm l} f_{\rm i} f_{\rm c} L,$$
where N is the number of Galactic civilizations who can communicate with the Earth. R * is the mean star formation rate of the Milky Way. f g is the fraction of stars that could support habitable planets. f p is the fraction of stars that host planetary systems. n e are the number of planets in each system that are potentially habitable. f l is the fraction of habitable planets where life originates and becomes complex. f i is the fraction of life-bearing planets that develop intelligence. f c is the fraction of intelligence bearing planets where technology can develop. L is the mean lifetime of a technological civilization within the detection window.
In recent years, the astronomical parameters of Drake equation have been better constrained due to the observational advances, mainly in the discovery of a great number of exoplanets that can be used to build new and more accurate observational distribution functions. We now know of the existence of exoplanets orbiting Sun-like stars within our Galaxy (Borucki et al. Reference Borucki2012; Torres et al. Reference Torres2015), Earth-like planets orbiting low-mass stars within their habitable zone (HZ) (Borucki et al. Reference Borucki2013; Quintana et al. Reference Quintana2014), and more than 2000 confirmed exoplanets (Reference Forganexoplanets.eu).
The search for extraterrestrial intelligence (SETI) has been very controversial and all attempts to find an intelligent civilization outside our planet have been unsuccessful. This motivates theoretical studies in order to assess the feasibility of finding extraterrestrial intelligence and whether it is worthwhile investing in such searches. Past studies have used numerical methods as testbeds of hypotheses of extraterrestrial life and intelligence, using Monte Carlo realizations to study some of the factors of the Drake Equation (Forgan Reference Forgan2009; Forgan & Rice Reference Forgan and Rice2010).
With the new discoveries and the improvement of past models, we give an estimation of the number of potentially habitable planets, the probability of the existence of extraterrestrial life, from simple life to more complex intelligent life, and discuss the implications of these new results for the Kepler field of view (FOV), which is completely within the Solar neighbourhood.
We will refer as simple or primitive life to any type of life that is incapable of developing communicative technology, while an intelligent civilization is capable of communicating beyond their planet. Intelligent civilizations go through a phase of vulnerability towards events of destruction, which we will call ‘vulnerable’ civilizations, to finally become an ‘advanced’ civilization if survived those events. We assume that these civilizations will last forever. Those definitions place humans as a ‘vulnerable’ civilization.
In this work, we propose to extend the use of the Monte Carlo Method to study the Drake equation in the light of new exoplanets discoveries. The aim of this study is to have as few free parameters as possible to obtain more accurate results. In Section 2, the stellar distributions and properties, the way the stars are generated, the planetary input data and the HZ are described. The parameters for life to evolve are discussed in Section 3, whereas in Section 4 the life algorithm is described. In Section 5, the two civilizations models are discussed; in Section 6 the results for the models and several cases are shown, and finally, the conclusions are shown in Section 7.
The galactic model
The Solar neighbourhood (SN) is the space associated with a cylinder centred at the Sun and perpendicular to the Milky Way disc. This Solar Cylinder is located at ~8 kpc from the Galactic centre, with a radius of 1 kpc (Carigi Reference Carigi, Gargaud, Irvine, Amils, Cleaves, Pinti, Cernicharo Quintanilla, Rouan, Spohn, Tirard and Viso2015). Working within the SN is appropriate because the observational data used in this work has been collected from areas inside the SN [e.g., Kepler field and initial mass function (IMF)]. This region can be extended to cover an annular region around the Galaxy as the galactic properties only depend radially from the centre of the galactic disc and above/below the midplane of the Galaxy. Therefore we defined the Solar Galactocentric Region (SGR) as an annular region between 7 and 9 kpc from the Galactic centre. This work will only consider the stars within this region.
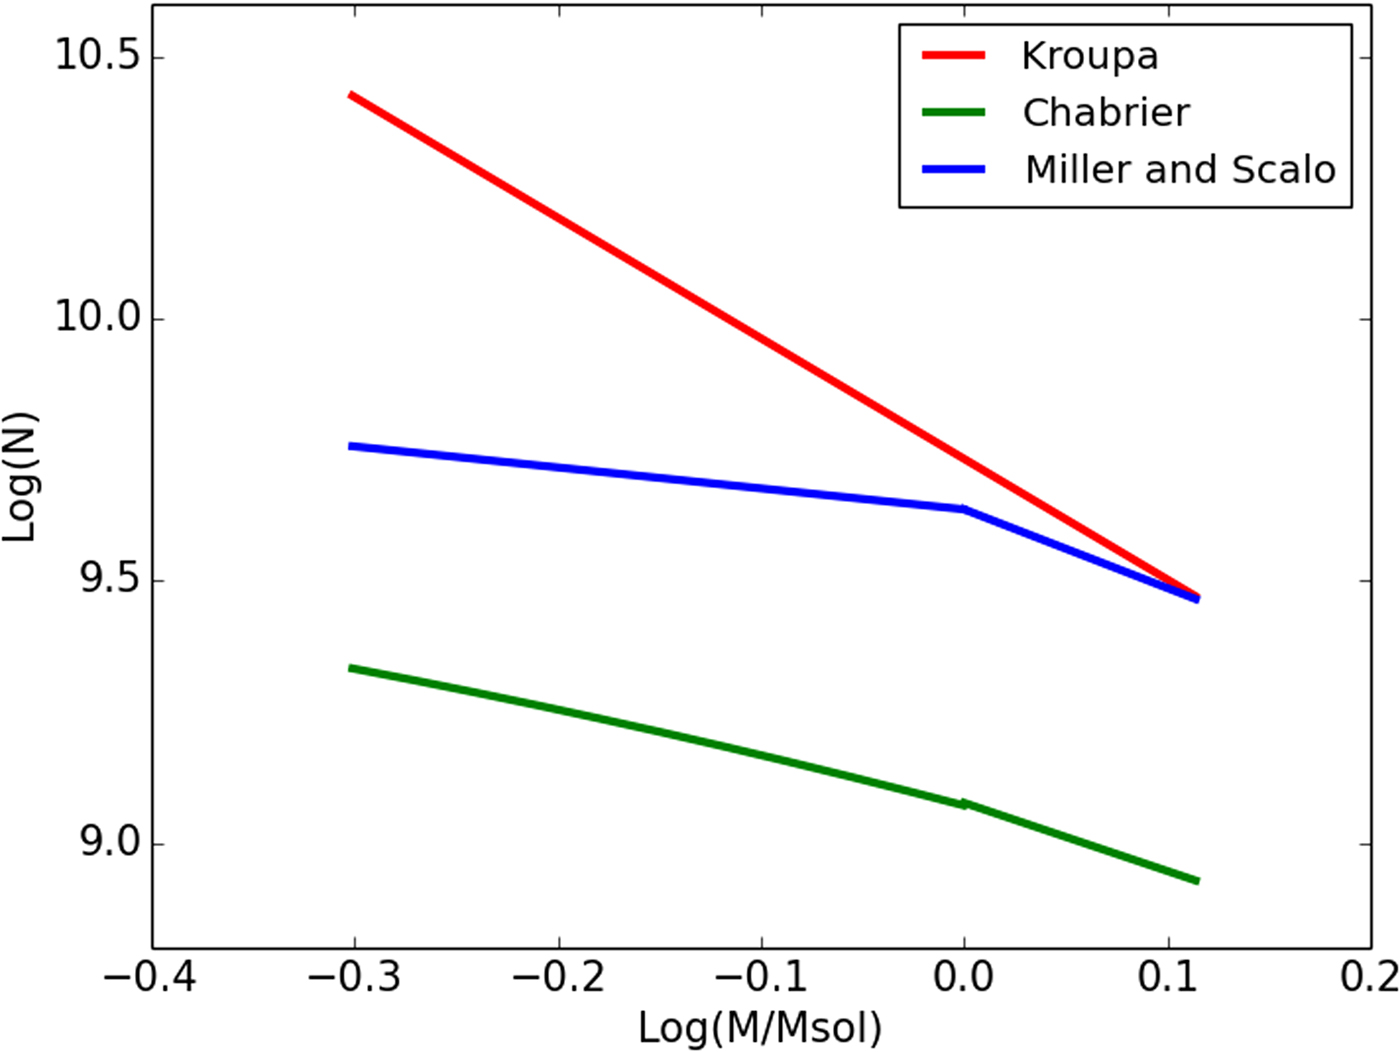
We only consider planets around Sun-like stars (F, G and K), because most of the confirmed Kepler exoplanets orbit those stars (exoplanets.eu, September 2016). To reproduce the mass distribution of the stars in the SGR, we used the IMF from Miller & Scalo (Reference Miller and Scalo1979) in its Gaussian form (see Fig. 1), as follows:
 $${\rm \xi} (M) = C_{\rm 0} {\rm e}^{ - 1.09(\log M + {1.02)}^2},$$
where M is the mass of the star expressed in Solar masses, the quantity C
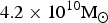
0 = 1010 is a normalization constant which is obtained by considering the total disc mass of
 $4.2 \times 10^{10}{\rm M}_{\rm \odot} $
estimated by Binney & Tremaine (Reference Binney and Tremaine2008). Then, the total number of stars in the disc was calculated using the equation above, yielding to a total of 1.2 × 10¹⁰ stars. The spatial distribution of stars is not uniform; therefore, it is necessary to calculate the number of stars within the SGR using a stellar number density distribution. We used the Carroll & Ostlie (Reference Carroll and Ostlie2006) distribution, which gives the distribution of stars above the midplane and radially from the centre of the Galaxy, calculated using:
 $$n(z,R) = n_0({\rm e}^{ - z/z_{{\rm thin}}} + 0.085 {\rm e}^{ - z/z_{{\rm thick}}}) {\rm e}^{ - R/h_R},$$
where z is the height above the midplane and R is the radial distance from the centre of the Galaxy, the constant h
R = 2.25 kpc is the radial disc scale length, z
thin = 350 pc is the thin disc scale height, z
thick = 1000 pc is the thick disc scale height. The quantity n
0 is the normalization constant that is obtained integrating equation (3) over the complete volume of the galactic disc for 2.5 kpc ≤ R ≤ 15 kpc, and 0 ≤ z ≤ 1000 pc. Then, we integrated over the whole SGR volume with a radius between 7 and 9 kpc, which yielded to 1.5 billion stars in the SGR. Finally, we calculated how many of those stars were F, G or K (
 $0.5 - 1.3\,M_{\rm \odot} $
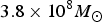
) using the IMF [equation (2)], which yielded approximately 400 million of stars with a total mass of
 $3.8 \times 10^8M_{\rm \odot} $
.
Comparison of different initial mass functions: Miller & Scalo (Reference Miller and Scalo1979, blue line), Kroupa (Reference Kroupa2001, red line) and Chabrier (Reference Chabrier2003, green line).

Generating stars
An important aspect of this project is to determine the mass of the stars by means of Monte Carlo realizations. The 400 million stars are individually generated one by one, so a random function that reproduces the IMF in the range of 0.5–1.3
 $M_{\rm \odot} $
is necessary. To accomplish it, we make single stars using a generating function extracted from equation (2) as follows:
 $$M(X) = 1.087 \exp \left[ {\displaystyle{{{\rm er}{\rm f}^{ - 1}(0.88 - (X/0.63))} \over {0.45}}} \right],$$
where X is a random number between 0.314 and 0.612 to cover the range of masses between 0.5 and
 $1.3 M_{\rm \odot} $
. Once we determine the mass, we calculate the stellar properties using the homology relations. The stellar radius can be calculated using (Hansen et al.
Reference Hansen, Kawaler and Trimble2004):
 $$R_{\rm \star} = R_{\rm \odot} \left[ {\displaystyle{{M_{\rm \star}} \over {M_{\rm \odot}}}} \right]^{(n - 1)/(n + 3)},$$
where n depends on the mass of the star. For low mass stars (
 $M{\rm \le} 1.1M_{\rm \odot} $
) the energy is generated primarily by the p–p chain and n = 4. For hotter stars (
 $M \gt 1.1M_{\rm \odot} $
) the energy is generated primarily by the CNO cycle and n = 16. The luminosity is calculated using the mass-luminosity relation:
 $$L_{\rm \star} = L_{\rm \odot} \left[ {\displaystyle{{M_{\rm \star}} \over {M_{\rm \odot}}}} \right]^3.$$
The main sequence lifetime is:
 $$t_{{\rm MS}} = t_{{\rm MS,}{\rm \odot}} \left[ {\displaystyle{{M_{\rm \star}} \over {M_{\rm \odot}}}} \right]^{ - 2.5}.$$
The stellar effective temperature is calculated as:
 $$T_{\rm \star} = \left[ {\displaystyle{{L_{\rm \star}} \over {4{\rm \pi} R_{\rm \star} ^2 {\rm \sigma} _{{\rm SB}}}}} \right]^{1/4}.$$
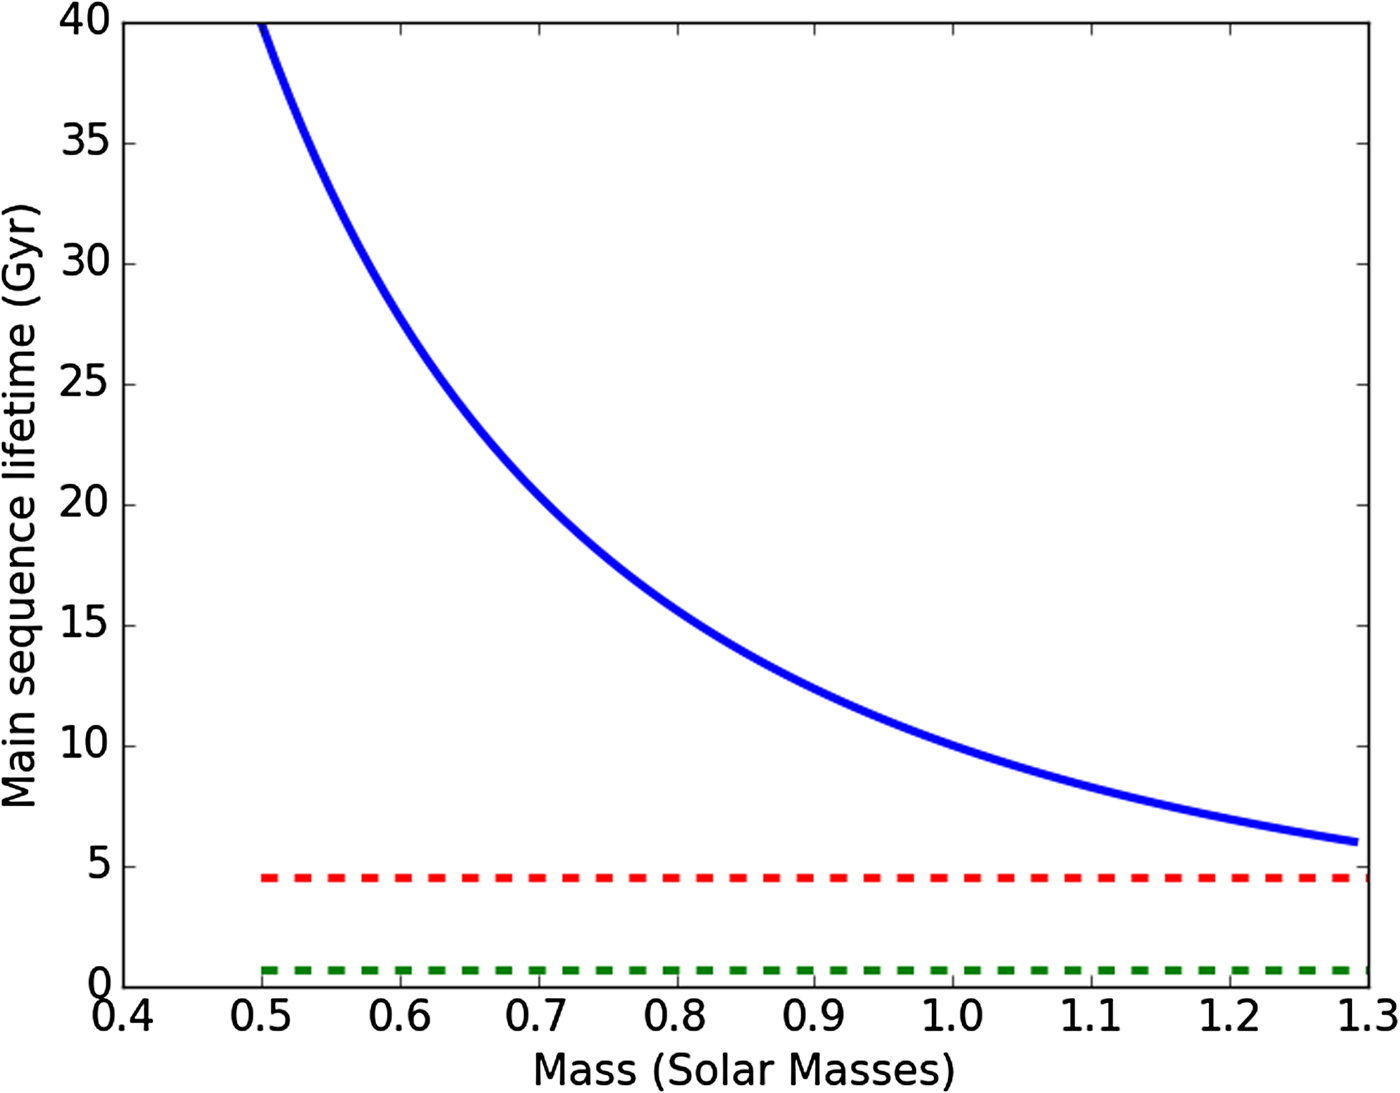
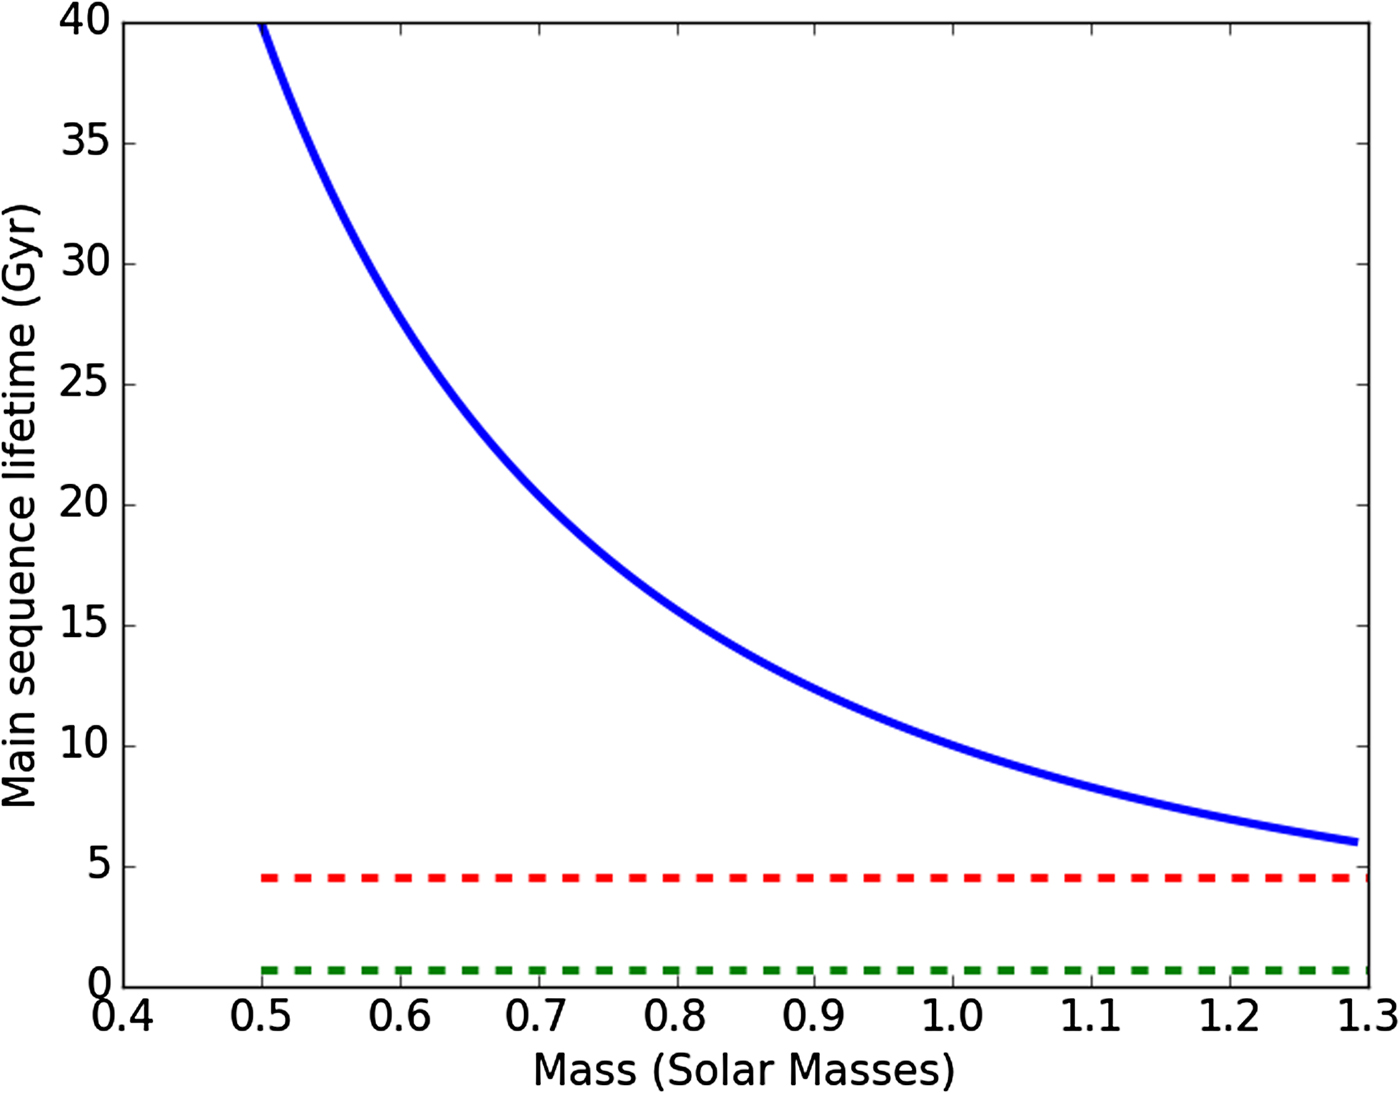
The main properties of interest are the effective temperature and the main sequence lifetime as they will give us information about the stellar HZ and the time that potential habitable planets have to develop life (see Fig. 2), respectively.
The main sequence lifetime of the stars in the model, the earliest potential chemofossils dated on the Earth, 3.8 billion years ago (Mojzsis et al. Reference Mojzsis, Arrhenius, Mckeegan, Harrison, Nutman and Friend1996, green dotted line) and the rise of technological civilization on the Earth (red dotted line).
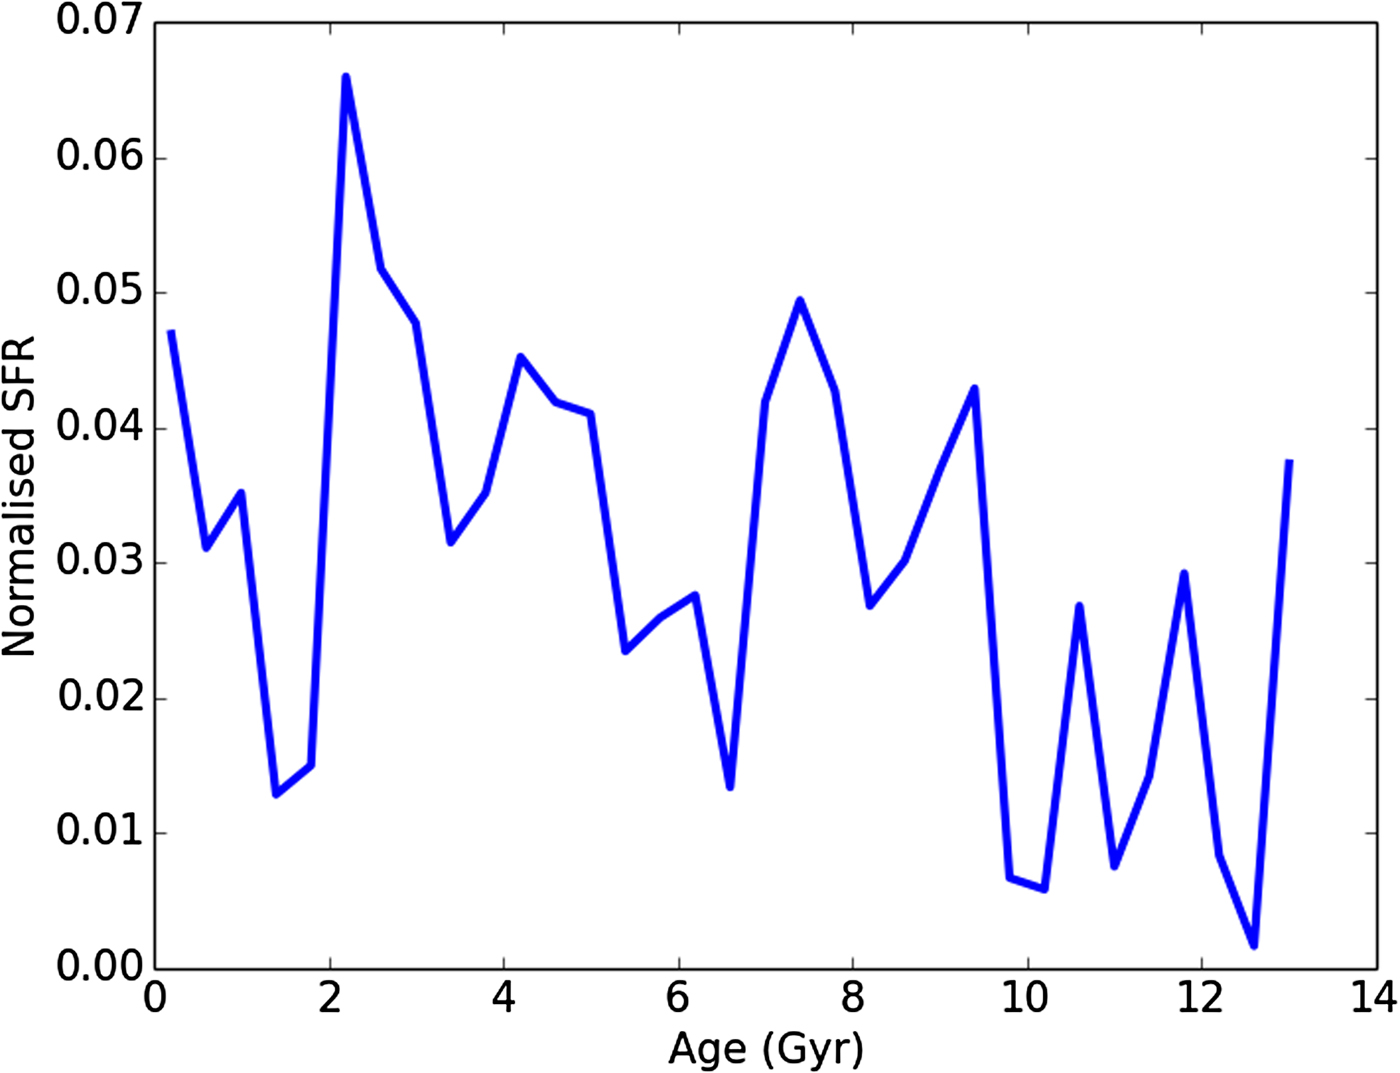
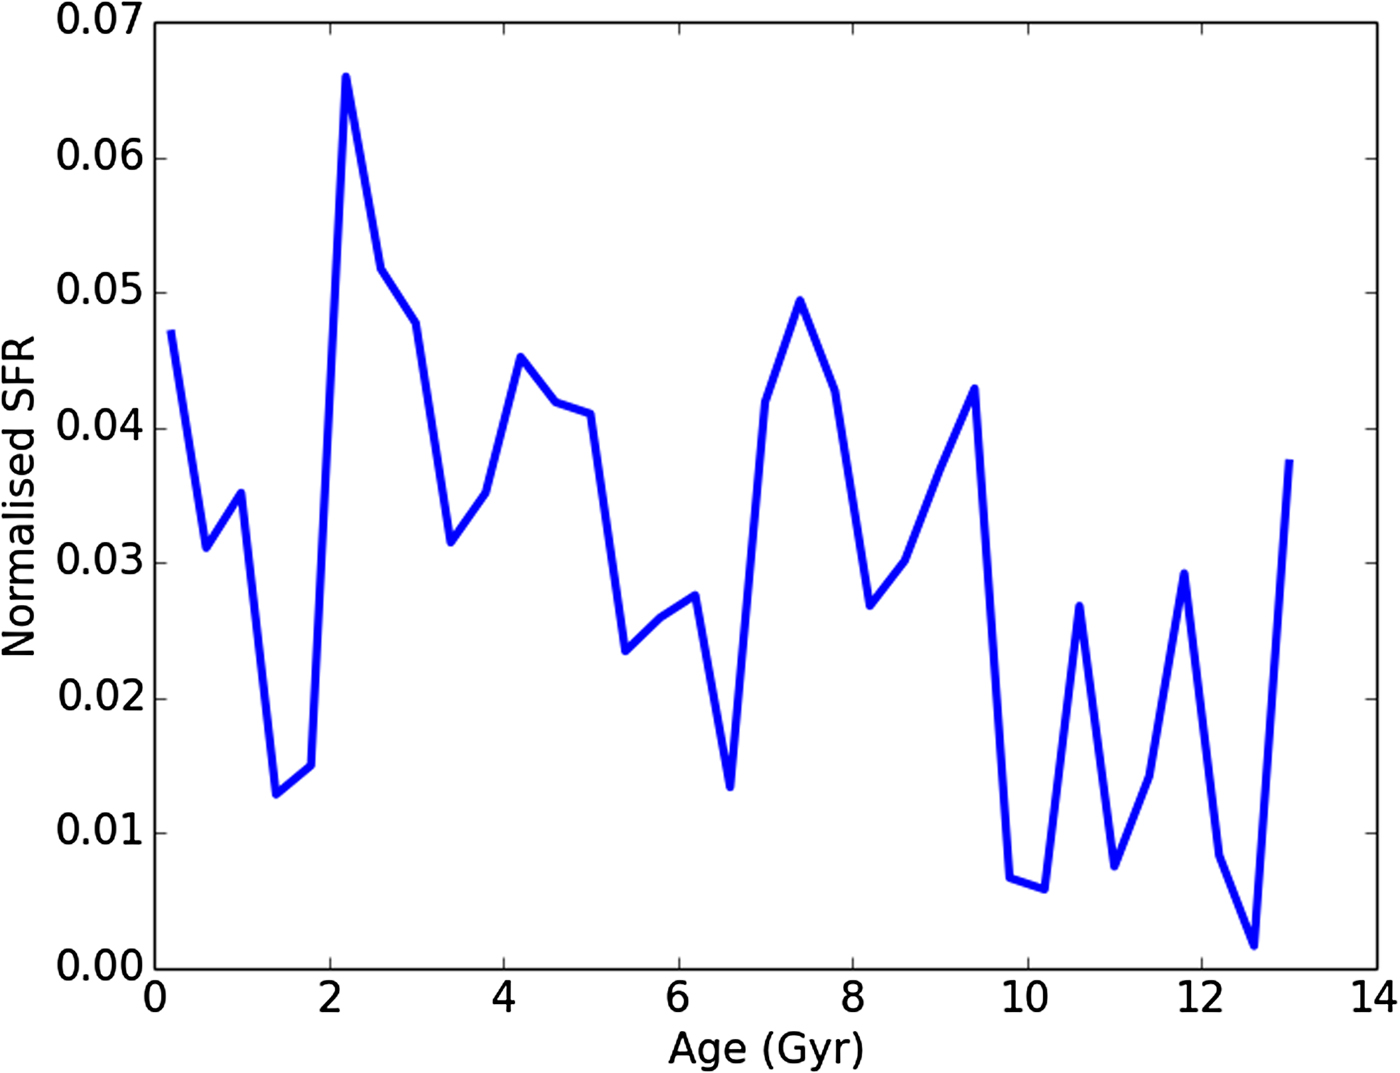
The stars were generated chronologically in bins of 0.4 billion years to reconstruct the star formation history of the Milky Way (Rocha-Pinto et al. Reference Rocha-Pinto, Scalo, Maciel and Flynn2000) (see Fig. 3), and located randomly in the SGR.
The star formation history from Rocha-Pinto et al. (Reference Rocha-Pinto, Scalo, Maciel and Flynn2000) produced by a single Monte Carlo simulation.
Planetary systems
In February 2014, NASA's Kepler mission announced the discovery of around 700 exoplanets and this number has increased ever since. Whereas the last study similar to ours, Forgan (Reference Forgan2009), had information concerning only 300 exoplanets. At the time of writing this study, ~2000 exoplanets have been confirmed (exoplanets.eu, September 2016). Although cannot cannot completely eliminate observational biases, the use of observational distributions in this study fits well with our conservative model, as it can give a lower limit to the number of inhabited planets. The proportion of Earth-like planets to more massive planets may really be much higher, since it is easier to detect massive planets. For this work, we selected exoplanets with radii between
 $1\;{\rm and}\;16R_ \oplus $
and whose host star had a mass of 0.5–1.3
 $M_{\rm \odot} $
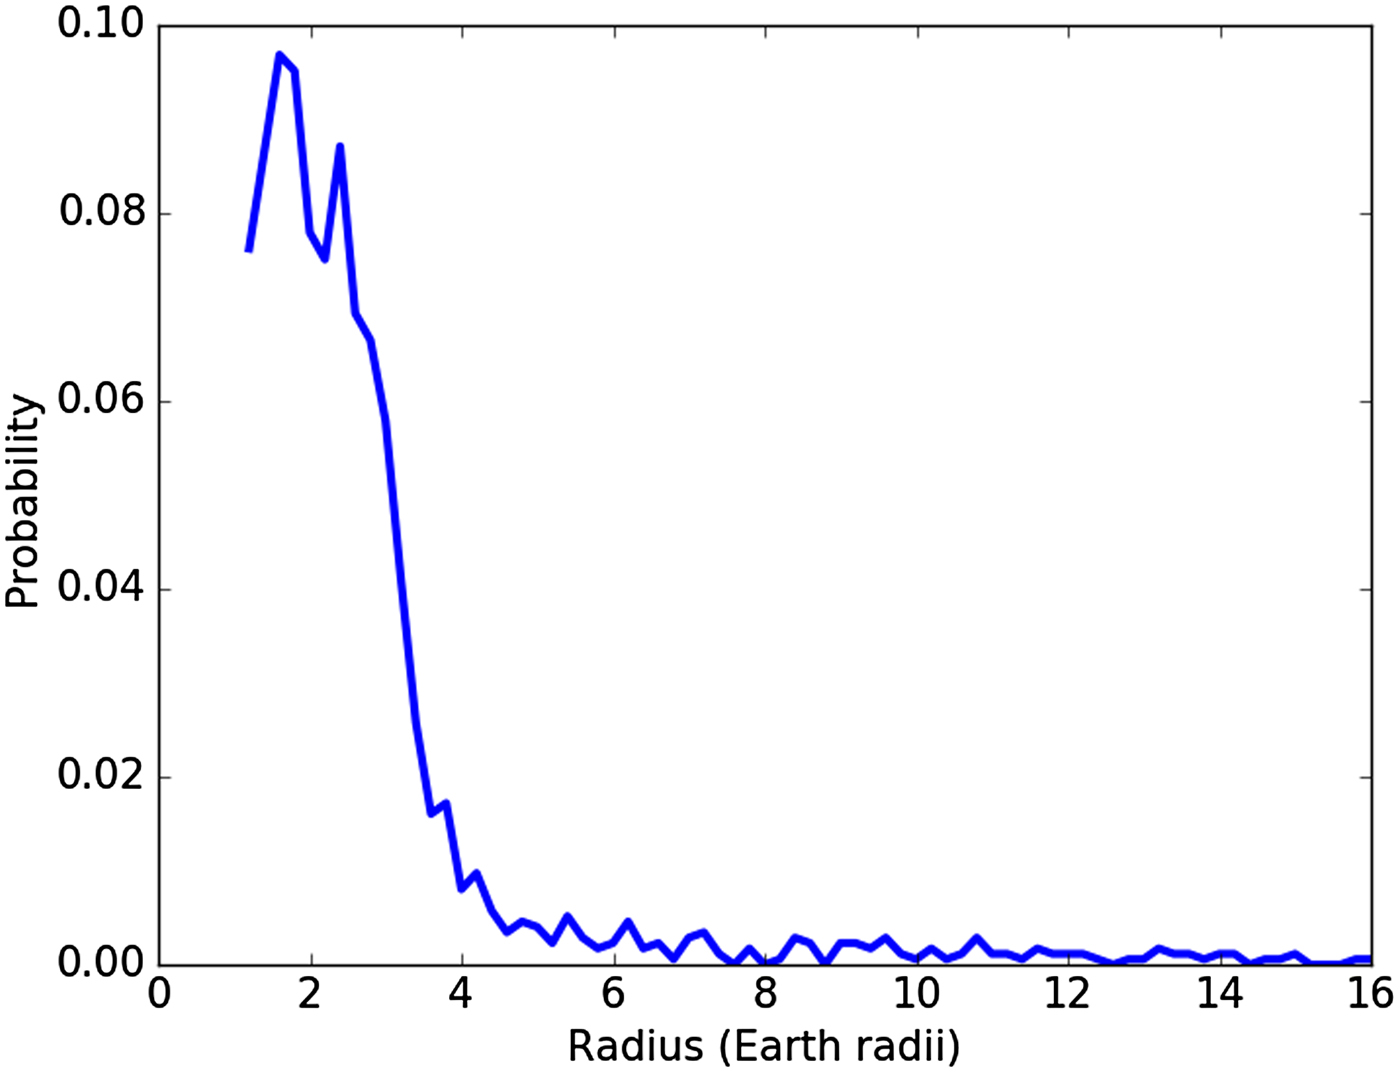
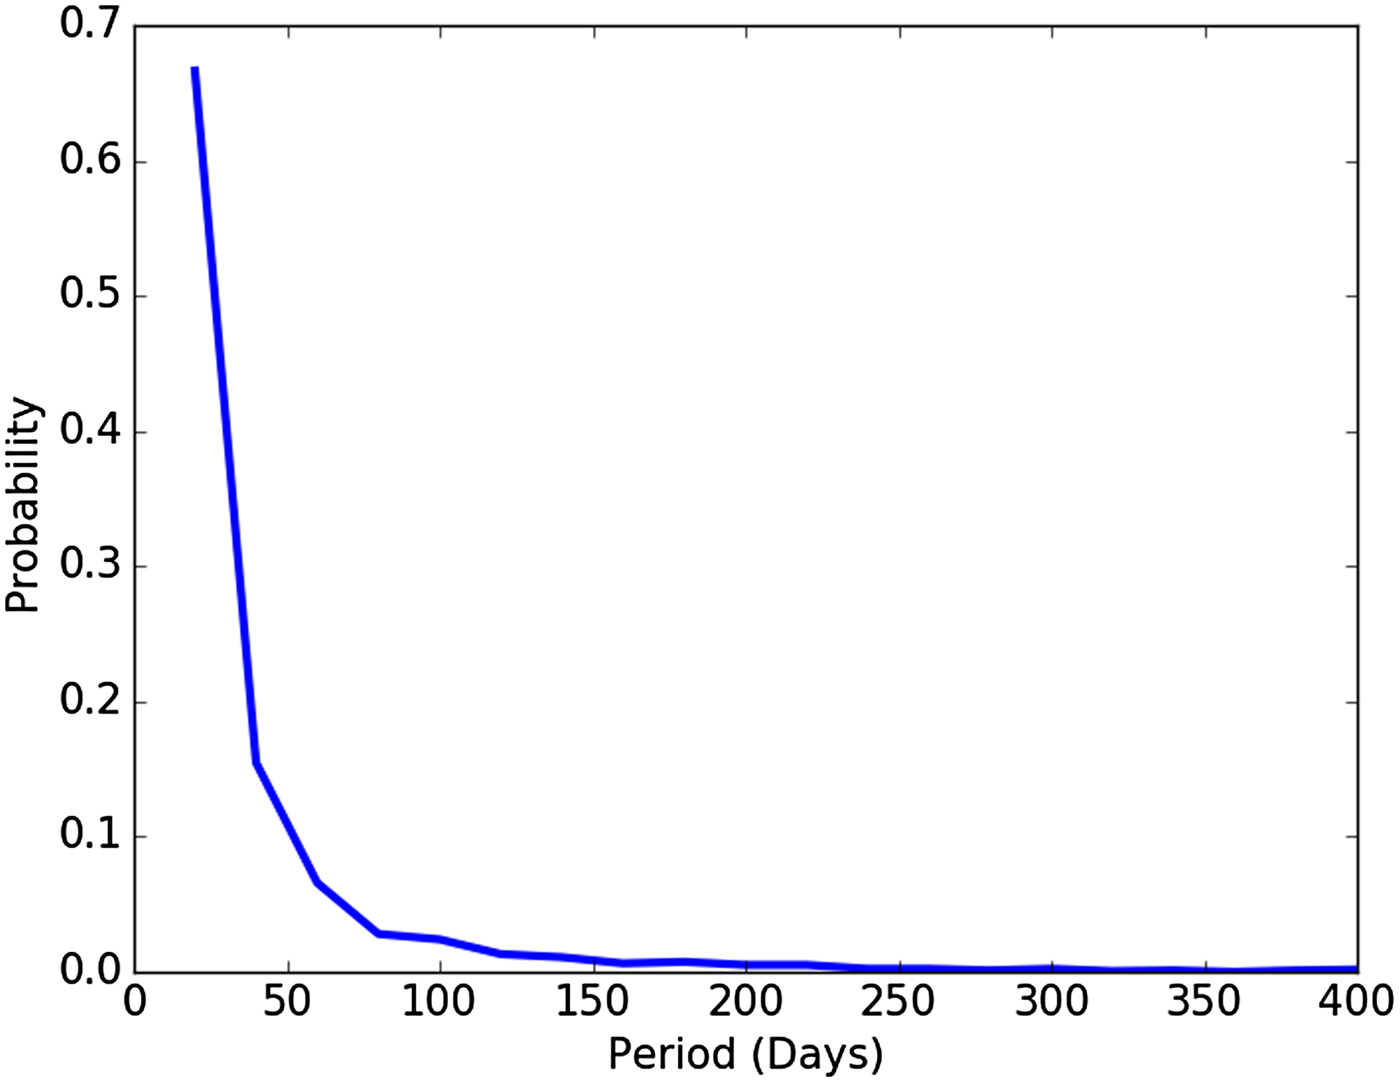
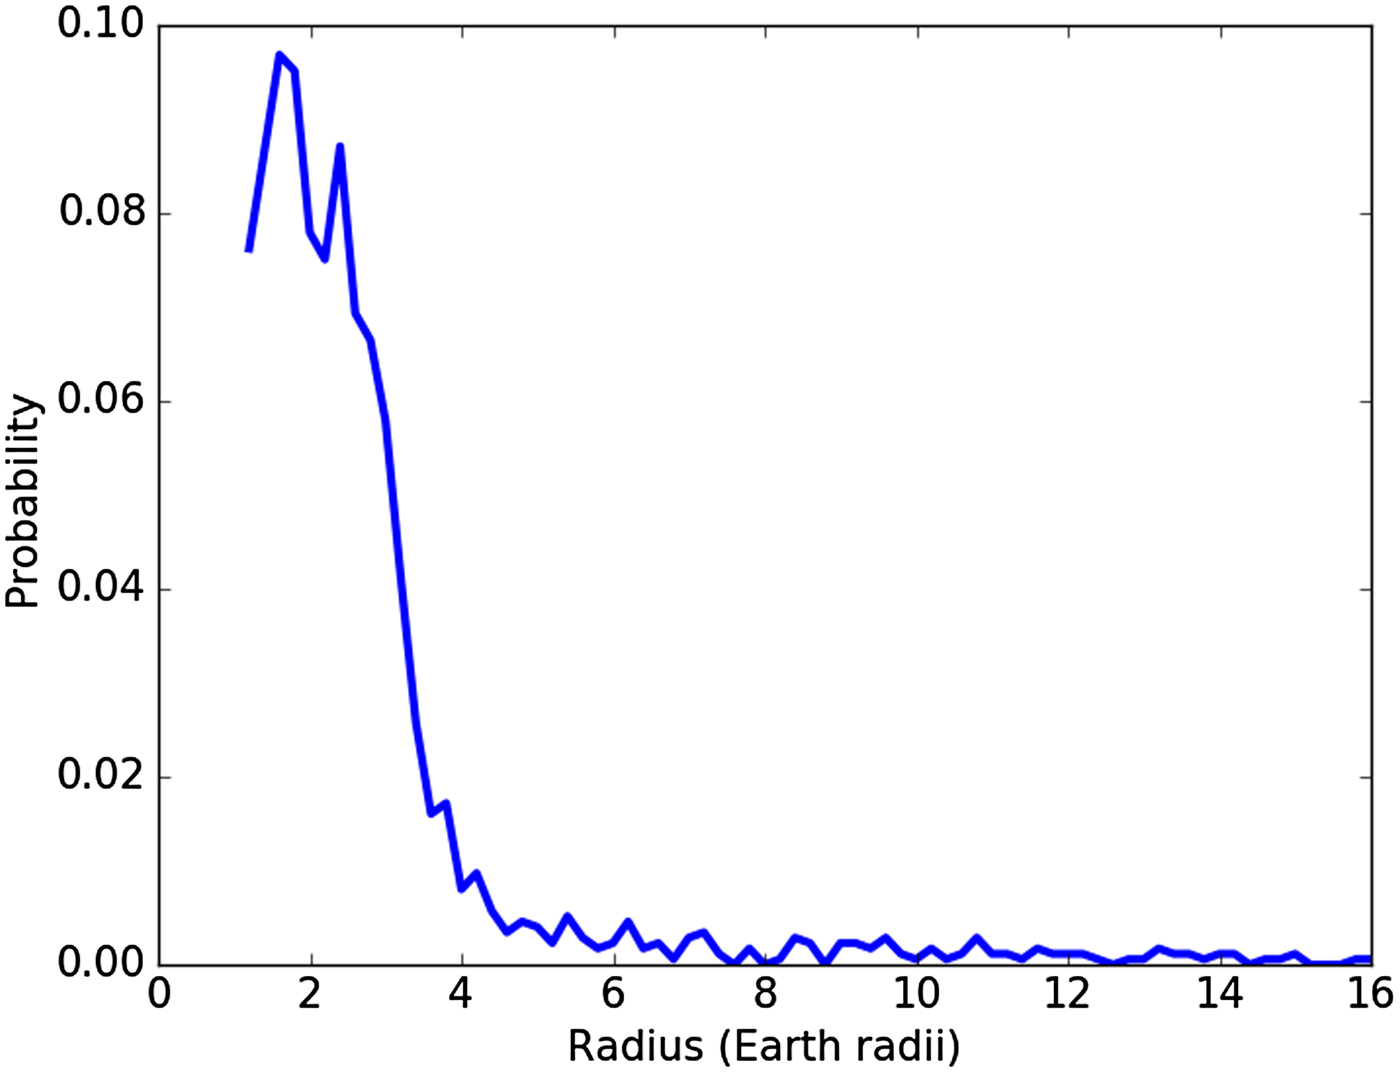
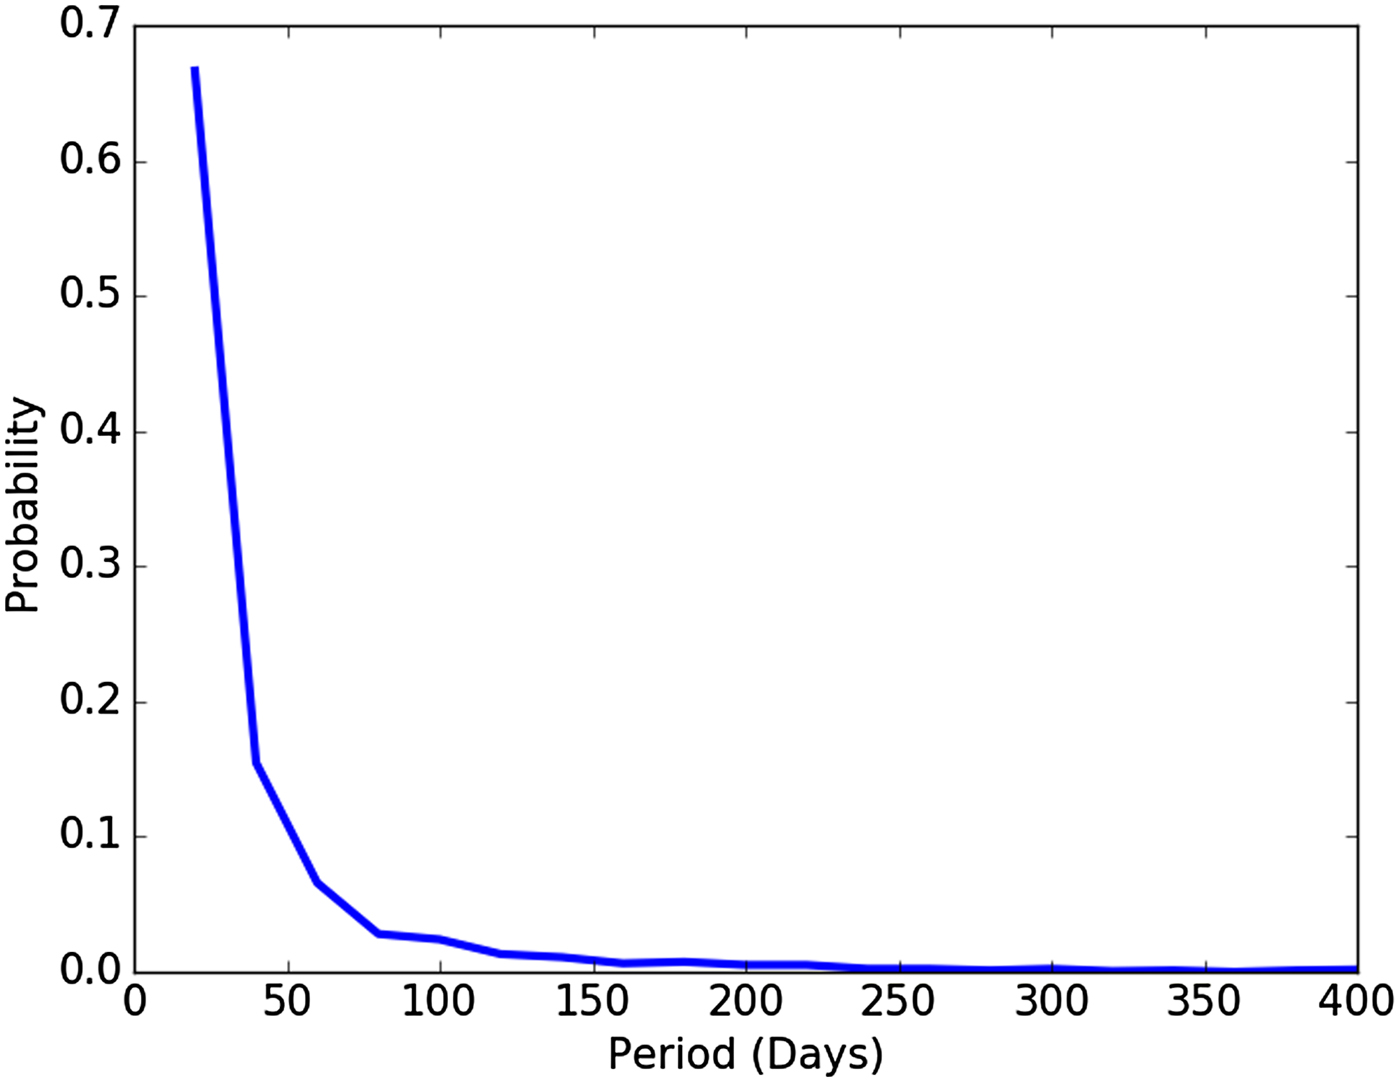
, which yielded the 1726 exoplanets used in this work. The probability of a star to host a planet was obtained from the Kepler Mission FOV. There are about 136 000 main sequence stars in the FOV (Monet Reference Monet1996) and using the IMF, around 34 595 should be F,G or K stars. According to the present information about exoplanets (exoplanets.eu, September 2016), there are 1636 different Sun-like stars hosting an exoplanet. So, we divided the number of Sun-like stars hosting planets in the FOV between the total number of Sun-like stars in the FOV and that yielded to a 4.73% chance for a star to host a planet. The radius and orbital period of each planet was randomly sampled from the distributions shown in Figs. 4 and 5, constructed from the exoplanets catalogue.
Planetary mass function constructed from Kepler's confirmed exoplanets (exoplanets.eu, September 2016).
Exoplanet's orbital period distribution used in this study constructed from Kepler's confirmed exoplanets (exoplanets.eu, September 2016).
Habitable zone
The HZ is defined as the region where a rocky planet can maintain liquid water on its surface (Kasting et al. Reference Kasting, Whitmire and Reynolds1993).The HZ has two boundaries, the inner and the outer edge. The inner edge is known as the water-loss limit or runaway greenhouse, where the temperature exceeds the critical temperature for water and the entire ocean evaporates. The outer edge is called the maximum greenhouse limit, where gaseous CO2 produces its maximum greenhouse effect.
The estimation of the HZ boundaries is based on a one-dimensional (1D) radiative-convective, cloud-free climate model done by Kopparapu et al. (Reference Kopparapu, Ramirez, Kasting, Eymet, Robinson, Mahadevan, Terrien, Domagal-Goldman, Meadows and Deshpande2013). They presented a parametric equation to calculate the relation between HZ stellar fluxes (S eff) reaching the top of the atmosphere of Earth-like planets, as follows:
 $$S_{{\rm eff}} = S_{{\rm eff}{\rm \odot}} + aT_{\rm \star} + bT_{\rm \star} ^2 + cT_{\rm \star} ^3 + dT_{\rm \star} ^4, $$
where
 $T_{\rm \star} = T_{{\rm eff}} - 5780 K$
and the coefficients are listed in Table 3 of Kopparapu et al. (Reference Kopparapu, Ramirez, Kasting, Eymet, Robinson, Mahadevan, Terrien, Domagal-Goldman, Meadows and Deshpande2013) for different habitability limits. For the purposes of this study, we used the conservative limit of the HZ. The corresponding HZ distances were calculated using the relation:
 $$d = \left( {\displaystyle{{L/L_{\rm \odot}} \over {S_{{\rm eff}}}}} \right)^{0.5}{\rm AU}{\rm.} $$
Planet size
For a planet, an important factor to retain liquid water is its size. If the planet is too small, then it would not be able to retain a thick atmosphere nor liquid water on its surface. On the other hand, if the planet is too big, it can now retain H and He in its atmosphere, and so can build a very heavy atmosphere (i.e. gaseous planet), warming the surface too much and attaining a pressure too high for liquid water (Mackwell et al. Reference Mackwell, Simon-Miller, Harder and Bullock2013). Rogers (Reference Rogers2015) showed that the majority of
 $1.6R_ \oplus $
planets have densities that are too low to be composed of Fe and silicates alone, so we will assume that planets having a radius
 $R_{\rm p} \le 1.6 R_ \oplus $
are rocky and can sustain an atmosphere and liquid water on their surfaces.
The Habitable Exoplanets Catalog (phl.upr.edu) defines an Earth-like planet as one with a radius between
 $0.8\;{\rm and}\;1.5R_ \oplus $
(
 $0.5\;{\rm and}\;5M_ \oplus $
).
Weak assumptions
The following parameters do not have well-defined values and unfortunately observational data are limited to the Earth's biosphere. In spite of this, the last two probabilistic parameters used in this model affect the final result significantly, so the study of what happens when used different values is easy, as it will be explained later.
Emergence and evolution of life and intelligence
A wide variety of organic molecules, from amino acids and other organic compounds extracted from meteoritic material (e.g. Pizzarello Reference Pizzarello2007) to prebiotic molecules in the interstellar medium have been discovered that are important building blocks of DNA (Zaleski et al. Reference Zaleski, Seifert, Steber, Muckle, Lommis, Corby, Martinez, Crabtree, Jewell and Hollis2013).
Some studies suggest that having the right conditions and ingredients, molecules as the RNA can be formed purely as a chemical reaction path (Patel et al. Reference Patel, Percivalle, Ritson, Duffy and Sutherland2015). Hence, we assume that if the habitability criteria are met the probability of the planet to harbour life, P life, is 1. For other choices of P life, the probability of the arise of life would be proportionally reduced, i.e., if P life = 0.5 the planets harbouring any type of life would be halved.
Intelligence and convergent evolution
There are many studies about the evolution of intelligence focusing on monkeys and apes (e.g., Tomasello & Call Reference Tomasello and Call1997), since they have a very close evolutionary relationship with the humans. Because of that, the primates are not a good justification that intelligence is something that will always appear when life emerges on a planet. However, complex cognition does not only occur in primates.
Convergent evolution is the emergence of structures or similar characteristics in organisms that do not share a common ancestor with such characteristics, i.e., they emerged independently in different organisms (Reece et al. Reference Reece, Urry, Cain, Wasserman, Minorsky and Jackson2011). An important example of this phenomenon is observed with corvids and primates. Corvids, like primates, use the same cognitive tools such as: casual reasoning, flexibility, imagination and prospecting. Both families developed these qualities independently. Even more surprising is that the structure of the brains of corvids and primates is very different, which has major implications because, although having a very different brain structure for humans, complex cognitive skills can be developed (Emery & Clayton Reference Emery and Clayton2004).
In the scope of the search for intelligent life, this supports the feasibility of the existence of another intelligent civilization, as it is observed that the emergence of intelligence is common in the evolution of life. It should be noted, that despite this, the intelligence in humans, is much more complex than that mentioned above, which, along with our morphological evolution, allows us to be the only living beings on Earth with the ability to build technology and communicate with the cosmos.
This is a very delicate assumption. If we do not consider that the rise of intelligence is only matter of time in the evolution of life, then there is no parameter to estimate an uncertainty for it. Any factor that could reduce the probability of the emergence of intelligence will proportionally reduce the number of intelligent civilizations that we could obtain with our model.
Life algorithm
The only place in the Universe where we know of the existence of life is Earth. Therefore, it is clever to apply the Copernican principle to life, and assume that life on Earth could be replicated elsewhere in the Galaxy, if the conditions are similar to those on the Earth (Clark Reference Clark2000). Having said that, we take the timescales of the emergence of life on Earth and evolutionary history for modelling how life can emerge on other planets. Life has an evolutionary tendency to become more complex (e.g., Bogonovich Reference Bogonovich2011; Rospar Reference Rospar2013), so we assume that, allowing a sufficient amount of time, life could evolve to become an intelligent civilization if it overcomes a series of ‘resets’ or extinction events. This is called the ‘hard step’ scenario of evolution (Carter Reference Carter2008). The algorithm we adopt was developed by Forgan (Reference Forgan2009) and considers some key biological parameters that dictate the evolution of life on a planet.
If a planet is within the habitable zone and its radius is
 $R_{\rm p} \le 1.5 R_ \oplus $
, then it will enter the life algorithm. First, N
stages is randomly sampled from a Gaussian distribution with the mean to be 6, and standard deviation of 1, taken from the major stages life went through on the Earth (Carter Reference Carter2008).Then, the number of resets are calculated as a function of the galactocentric radius as:
 $$N_{{\rm resets}} = {\rm \mu} _{{\rm resets,0}}\left( {\displaystyle{{r_{{\rm gal}}} \over {r_{{\rm gal,}{\rm \odot}}}}} \right),$$
where μresets,0 is 5, reflecting the ‘Big Five’ mass extinction events in Earth's fossil records (Raup & Sepkoski Reference Raup and Sepkoski1982). Then the time needed to complete each stage, t i, is sampled from a Gaussian distribution with mean 0.8 Gyr, and standard deviation of 0.25 Gyr. Increasing N stages or/and t i will increase the number of planets with primitive life, as the time needed to reach intelligence would be longer. Increasing N resets would lead to a higher number of planets where the biosphere is annihilated. However, to avoid the arbitrary choice of these parameters, we stick to the values used by Forgan (Reference Forgan2009) and some modification will be done to the parameters to study their influence on the model.
In each stage, if there is a reset event, life has a chance of being annihilated. This fraction is sampled from a Gaussian distribution with a mean of 0.5 and a standard deviation of 0.25. If it is >1, the planet's life is completely destroyed. On the other hand, if it is <1, the stage decreases by 1 and the intelligence timescale (time needed by life to complete all stages), t int, increases a fraction of time between 0 and t i. If there are no reset events, then t int increases by t i.
The algorithm will continue while all of the following statements are met:
-
1. The current stage <N stages;
-
2. t int is less than the main sequence lifetime of the host star;
-
3. annihilation has not occurred;
-
4. t int plus the age of the host star is not greater than the present time.
After the algorithm ends, if all stages were completed, ‘vulnerable’ intelligent life has been reached, and it has a certain chance of surviving. If it survives, then it becomes advanced on a timescale t adv. If all the stages were not completed because point 4 (from the list above) was not met, then the planet is defined to have primitive life.
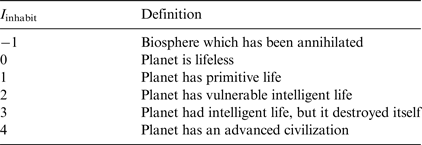
Then each planet is classified with an Evolutionary Intelligence Index (Table 1), introduced by Forgan (Reference Forgan2009), depending upon its biological history.
Evolutionary intelligence index

Signal detectability
To detect a signal from an extraterrestrial civilization we need to consider two aspects: when did the civilization arise, and how far it is from us.
Thus, to detect a live intelligent civilization signal, the next condition must be satisfied:
 $$13.2 - (t_{\rm 0} + t_{{\rm int}}) \ge t_{{\rm lt}},$$
where 13.2 Gyr is the age of the Galaxy, t 0 is the age of the star and t lt is the light travel time between such civilization and us. On the other hand, to detect a self-destructed civilization, this other condition must be satisfied:
 $$13.2 - (t_{\rm 0} + t_{{\rm int}} - t_{\rm l}) \ge t_{{\rm lt}},$$
where t l is the lifetime of the civilization.
These conditions would give us the total number of signals that could reach the Earth only considering the time and distance as parameters. Being more realistic, not every signal would be detectable by our instruments. Loeb & Zaldarriaga (Reference Loeb and Zaldarriaga2007) calculated the maximum distance to which we could detect an intelligent civilization that produces radio broadcasts similar to ones produced by the military radars on the Earth, using some of the radio telescopes that could perform SETI studies.
These authors show that, for a given distance to the source d, the minimum power required by the transmitter to be detected on the Earth is:
 $$P_{{\rm min}} = C \times 3.5 \times 10^{12}{\rm W} \times \left( {\displaystyle{d \over {{\rm 100}\;{\rm pc}}}} \right)^2 \times \left( {\displaystyle{{\Delta {\rm \nu}} \over {{\rm 8} \;{\rm kHz}}}} \right)^{1/2} \times \left( {\displaystyle{{t_{\rm o}} \over {{\rm month}}}} \right)^{ - 1/2},$$
where C is a constant that depends on the collecting area of the telescope, Δν is the bandwidth and t o is the observation time. For the Murchinson Widefield Array (MWA) C = 1.
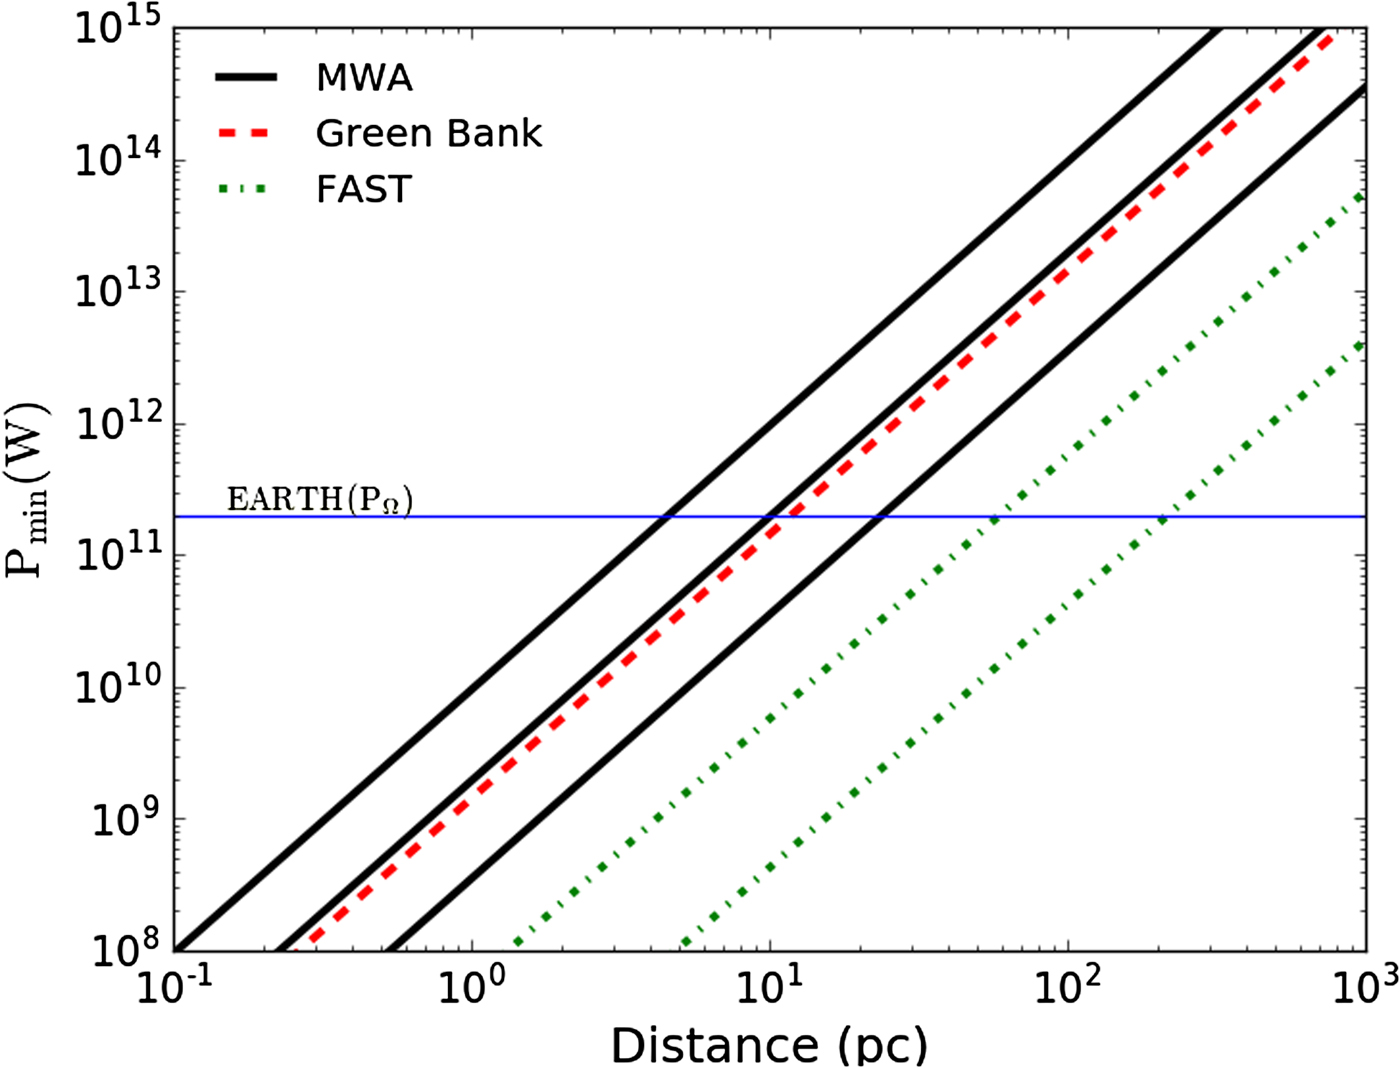
Figure 6 shows the minimum detectable radio power P min, for the MWA, calculated by Loeb & Zaldarriaga (Reference Loeb and Zaldarriaga2007), for the Green Bank Telescope (GBT), a 100 m diameter radiotelescope which is part of the Breakthrough Listen Project dedicated to SETI, and the Five hundred meter Aperture Spherical Telescope (FAST) which consists of a fixed 500 m dish with a collecting area 25 times bigger than the GBT and the MWA.
Minimum detectable radio power P min for various radiotelescopes and observing times as a function of distance to the source: the MWA with observing times of 1 h, 1 day and 1 month (solid lines from top to bottom, Loeb & Zaldarriaga (Reference Loeb and Zaldarriaga2007)), the Green Bank Telescope with Δν = 1 Hz and observating time of 20 s (red dotted line) and the FAST with Δν = 1 Hz and observating time of 20 s and 1 h (green dotted line, from top to bottom). The blue line delineates the power per solid angle of military radars, and the intersection with the lines delimitates the maximum distance for a civilization to be detected by the telescope on Earth.

The MWA should be able to detect an ET signal up to distances of 25 pc with 1 month of observing time, the GBT up to distances of 12 pc with 20 s of observing time, the FAST up to 60 pc with 20 s and up to 220 pc with 1 h of observing time. We will calculated how many extraterrestrial civilizations generated by the simulations are within those limits.
Models
Human history hypothesis
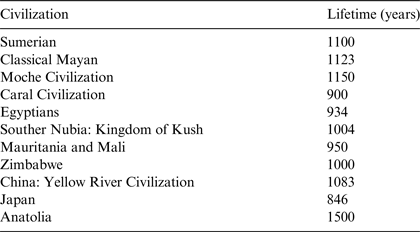
An extraterrestrial civilization may not last forever. A civilization can die due to the lack of resources (e.g., food, water), overpopulation, or wars, among other factors. We calculated the probability of survival based on the history of civilizations on Earth. Examining some of the early civilizations they seem to have a fixed lifetime of about 1000 years (Blaha Reference Blaha2007), those civilizations and lifetimes are shown on Table 2.
Examples of early civilizations and their lifetimes (adapted from Blaha Reference Blaha2007)

Even though the end of those civilizations did not mean the end of the human race, we are studying the lifetime of civilizations not the specie itself. The collapse of an ancient civilization did not impact globally as the civilizations were more independent one from another. Today, the collapse of a technological civilization or a bad decision by one country (e.g., start a nuclear war) could create a global catastrophe, so the collapse of a civilization could mean the end of the human species.
The probability that a ‘vulnerable’ intelligent civilization survives long enough to become ‘advanced’ was calculated as the average of the ratio of the individual civilizations lifetime to the summation of all civilizations lifetime (
 $t_{{\rm civ}} = 9000 \;{\rm years}$
; Kapitza Reference Kapitza2010), giving a result of 11% chance of surviving. Other approximations to this factor exist, such as the ‘sustainability solution’ (Haqq-Misra & Baum Reference Haqq-Misra and Baum2009), which relates the probability of survival with the speed of its growth, or the consideration of the physical limits (‘light cage limit’, McInnes Reference McInnes2002).
The ‘Tortoise and Hare’ hypothesis
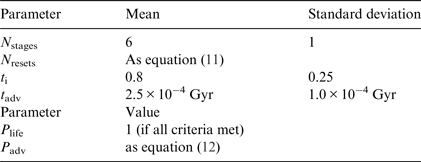
The ‘Tortoise and Hare’ hypothesis was introduced by Forgan (Reference Forgan2009). It proposes that civilizations that arise too quickly are more susceptible to self-destruction, and those that take longer to emerge are more likely to survive. The probability of self-destruction was parametrized by Forgan as:
 $$P_{{\rm destroy}} = \displaystyle{{t_{\rm 0}} \over {t_{{\rm int}}}},$$
where t 0 = N stages t i is the minimum time for life to evolve in the planet (when N resets = 0).
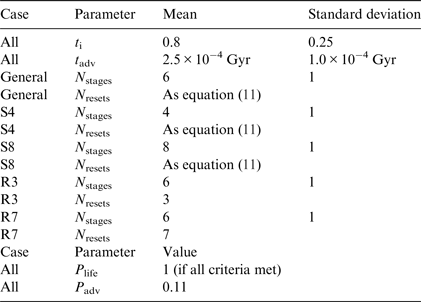
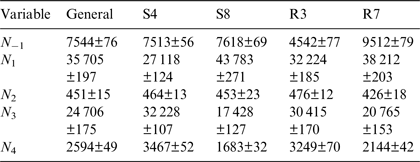
Most of the Drake equation factors affect proportionally the results, as it has been stated in several sections of this work. On the other hand, for the life algorithm it is harder to predict the dependence of the parameters in the generation of life. We ran the simulations with slightly different parameters values to better understand how our model depends upon these parameters. For that, we took the Human History Hypothesis as the general model, and then we ran four cases with modified parameters. For the first two cases, we changed the number of stages needed for life to evolve to an intelligent civilization (N stages), one with four steps as mean and another with eight steps (cases S4 and S8, respectively). In the second two cases, we changed the number of resets (N resets), one with three resets and one with seven resets (cases R3 and R7, respectively). A summary of the parameters used are presented in Tables 3 and 4.
Parameters used in the Human History Hypothesis

Parameters used in the Tortoise and Hare Hypothesis

Results and discussion
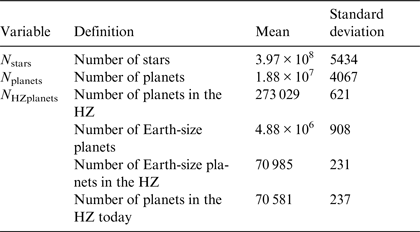
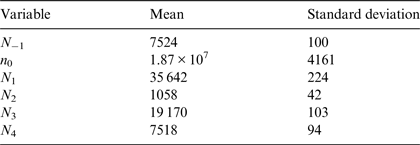
In Table 5, we show the statistics for the galactic model. The results show that 1.22% of Sun-like stars host an Earth-size planet (
 $N_ \oplus /N_{{\rm stars}}$
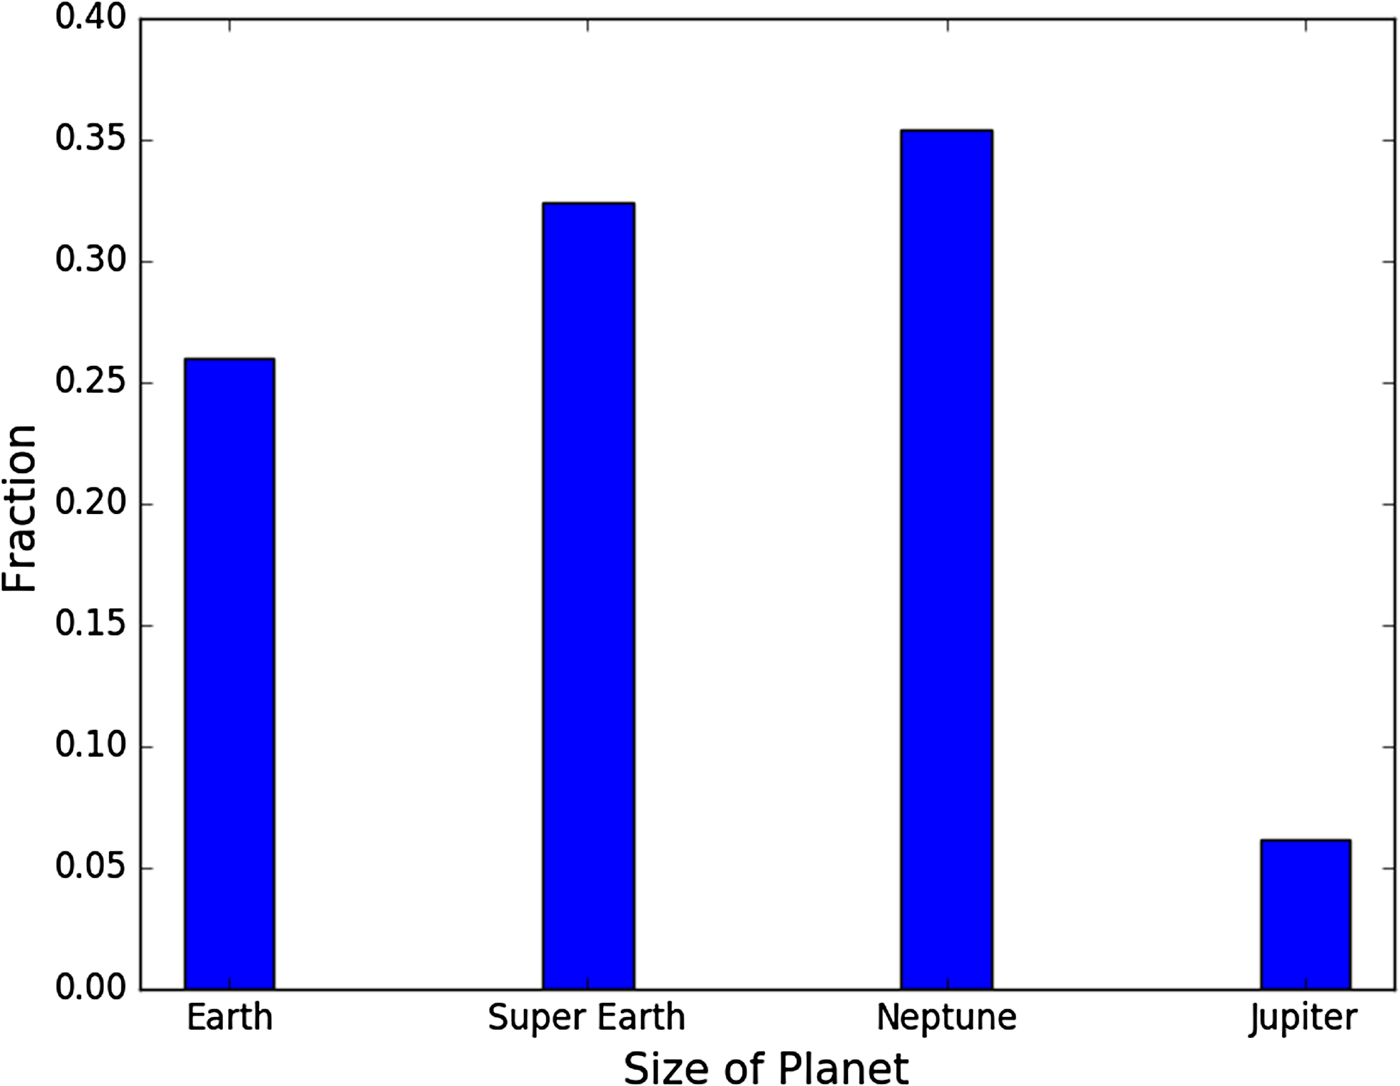
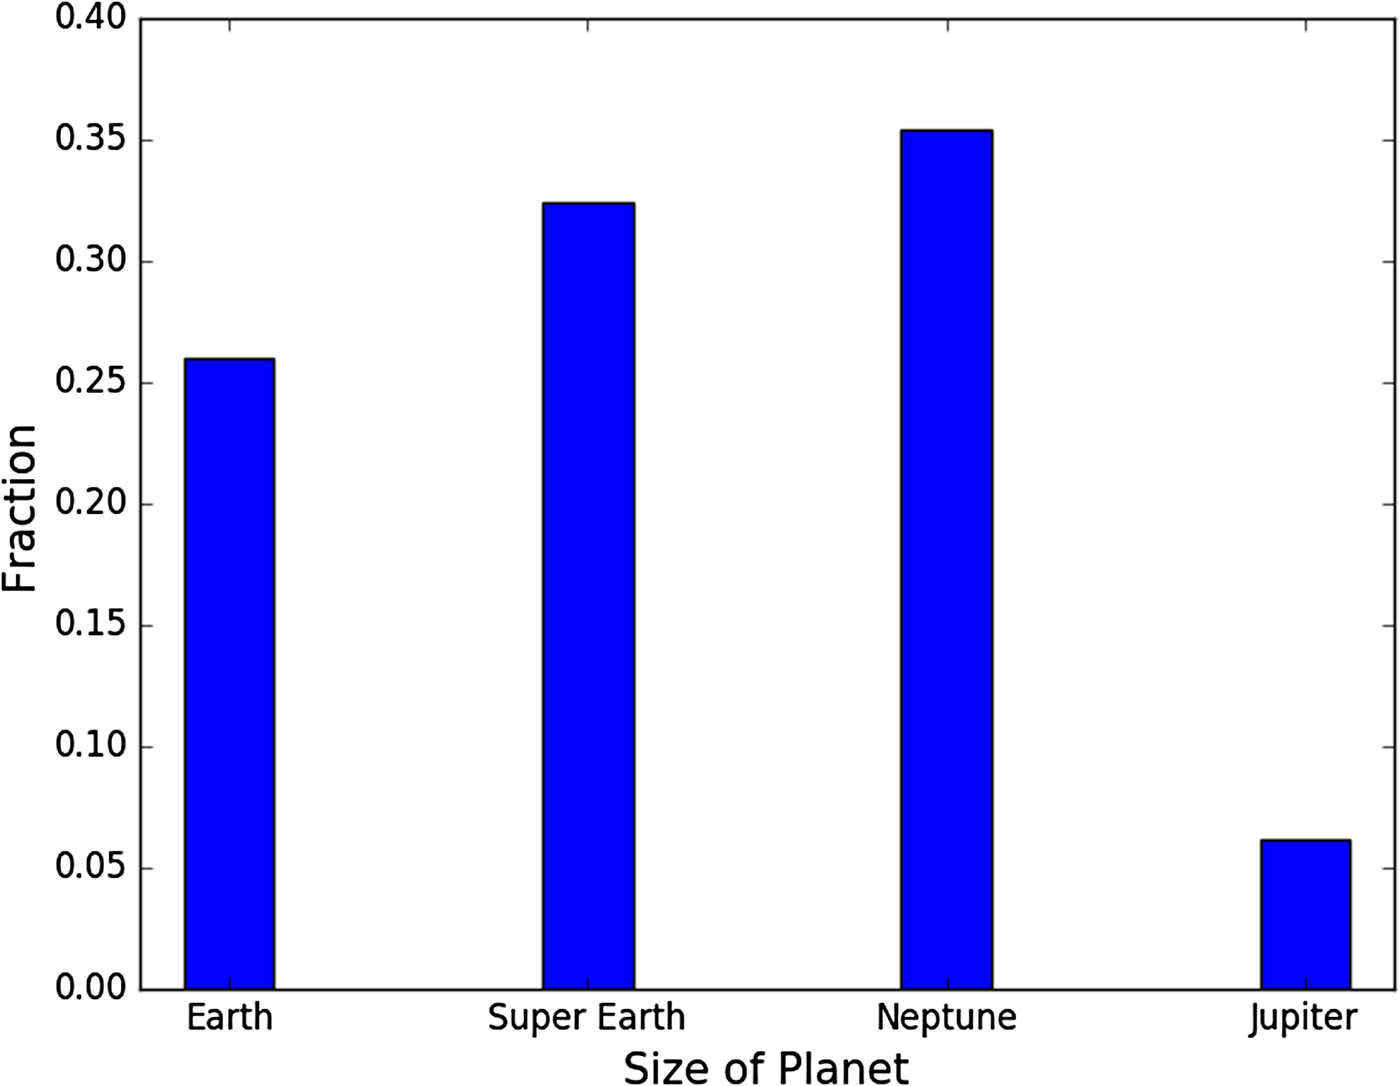
), 5.58% of those Earth-size planets are in the habitable zone, so 0.33% of Sun-like stars harbour an Earth-like planet in the habitable zone. Figure 7 shows the fraction corresponding to each size of planets; 26% are Earth-size (1–1.6
 $R_ \oplus $
), 32.5% are Super-Earth (1.6–2.5
 $R_ \oplus $
), 35.5% are Neptune-size (2.5–6
 $R_ \oplus $
) and 6% are Jupiter-size (6–16
 $R_ \oplus $
).
Fraction of planets depending on their size: Earth-size planet (1–1.6 R E), Super-Earth (1.6–2.5 R E), Neptune-size (2.5–6 R E) and Jupiter-size (6–16 R E).
Statistics for the galactic model

It has to be considered that our model is only based on statistics from the raw Kepler data, as the goal of this study is to observe the relative tendency of the results as the observational data improves. Estimations made by other authors (e.g., Petigura et al. Reference Petigura, Howard and Marcy2013) predict a higher fraction of Earth-like planets orbiting in their habitable zones (22%) since they corrected for instrumental limitations and observational biases.
Human history hypothesis
For the general case, around 51% (
 $N_1/N_{{\rm PHZ} \oplus} $
) of the present Earth-like planets in the HZ have primitive life. This supports the hypothesis that simple life is common in the Universe whenever the habitability criteria are met. The model predicts that there should be around 450 ‘vulnerable’ intelligent civilizations and 2600 advanced civilizations coexisting in the Milky Way at this moment. The reason there are more advanced than ‘vulnerable’ civilizations is because the time needed to evolve from a vulnerable to an advanced civilization is much smaller than the time needed to evolve from primitive life to a vulnerable civilization. Also, an advanced civilization can survive forever while the ‘vulnerable’ one may destroy itself (N
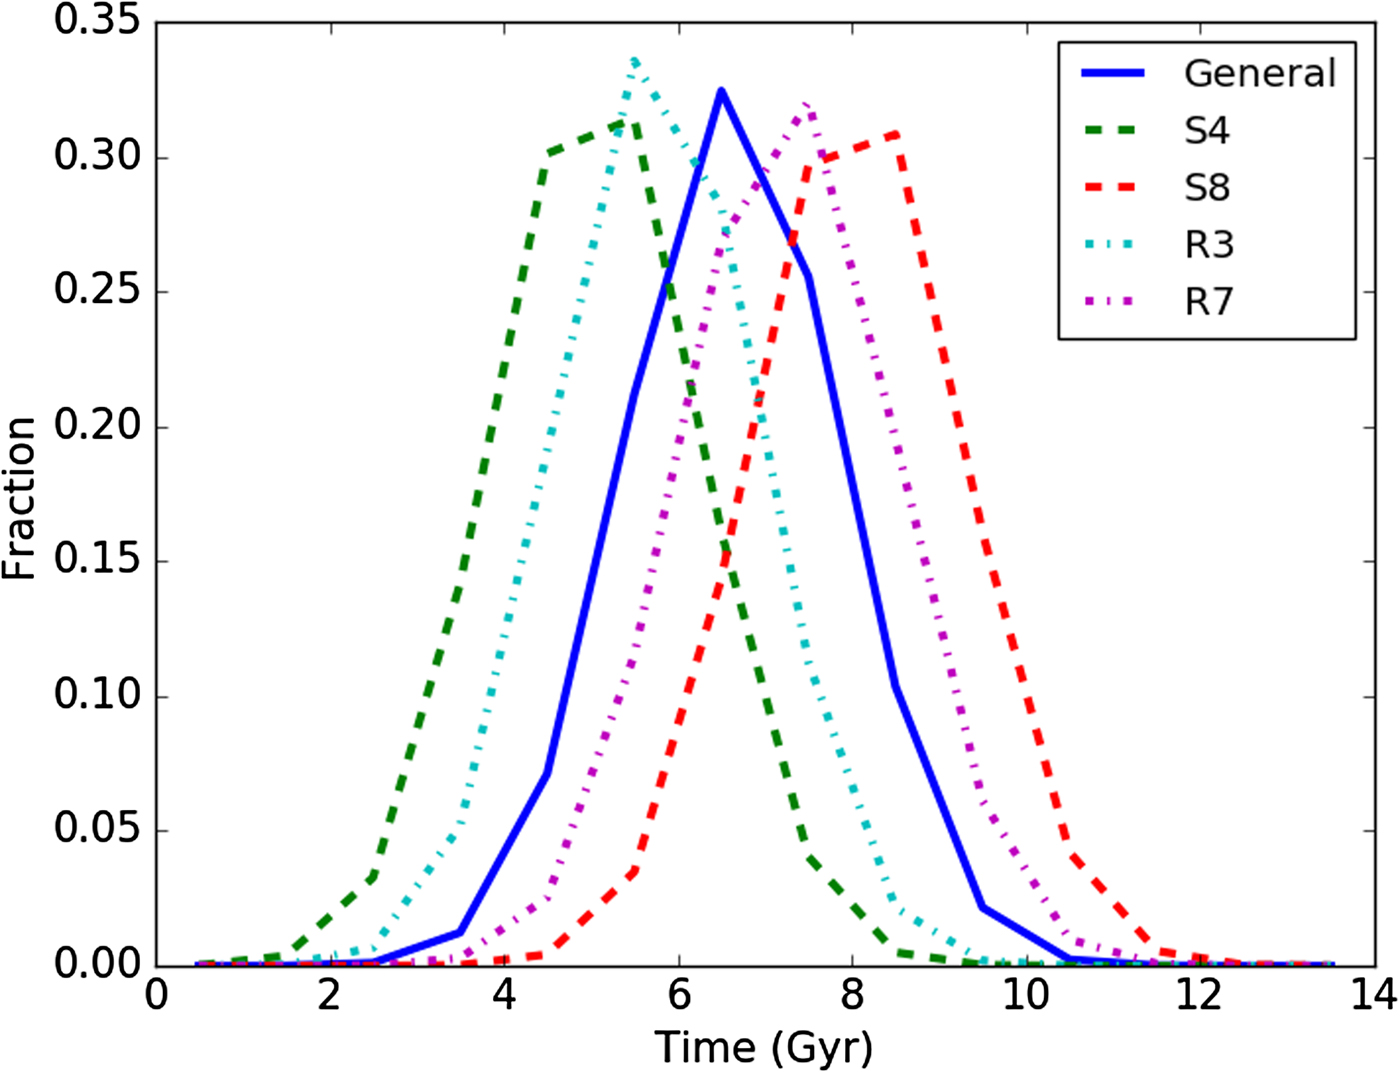
3). Around the 7.7% of the life-hosting planets are inhabited by intelligent civilizations. This means that the biggest bottleneck is the progression from simple life to intelligence. As we see in Fig. 8, in most cases, life takes around 6 Gyr to evolve from simple to intelligent. Integrating the curve we obtain that life on the Earth evolved to intelligence faster than 85% of the total intelligent civilizations. This scenario supports the idea that we have not been contacted by a superior intelligent ET civilization because we are one of the first intelligent civilizations of the Galaxy. The next great bottleneck is the progression from ‘vulnerable’ to advanced civilization. Sagan & Shklovskii (Reference Sagan and Shklovskii1966) speculated that technological civilizations will either destroy themselves or master their self-destructive tendencies and survive for billion-year timescales.
Time needed for a life hosting planet to develop intelligent life. The five cases for the Human History Hypothesis are shown: general case (blue line), four steps case (S4, green dotted line), eight steps case (S8, red dotted line), three resets case (R3, cyan dotted line) and seven resets case (R7, purple dotted line).
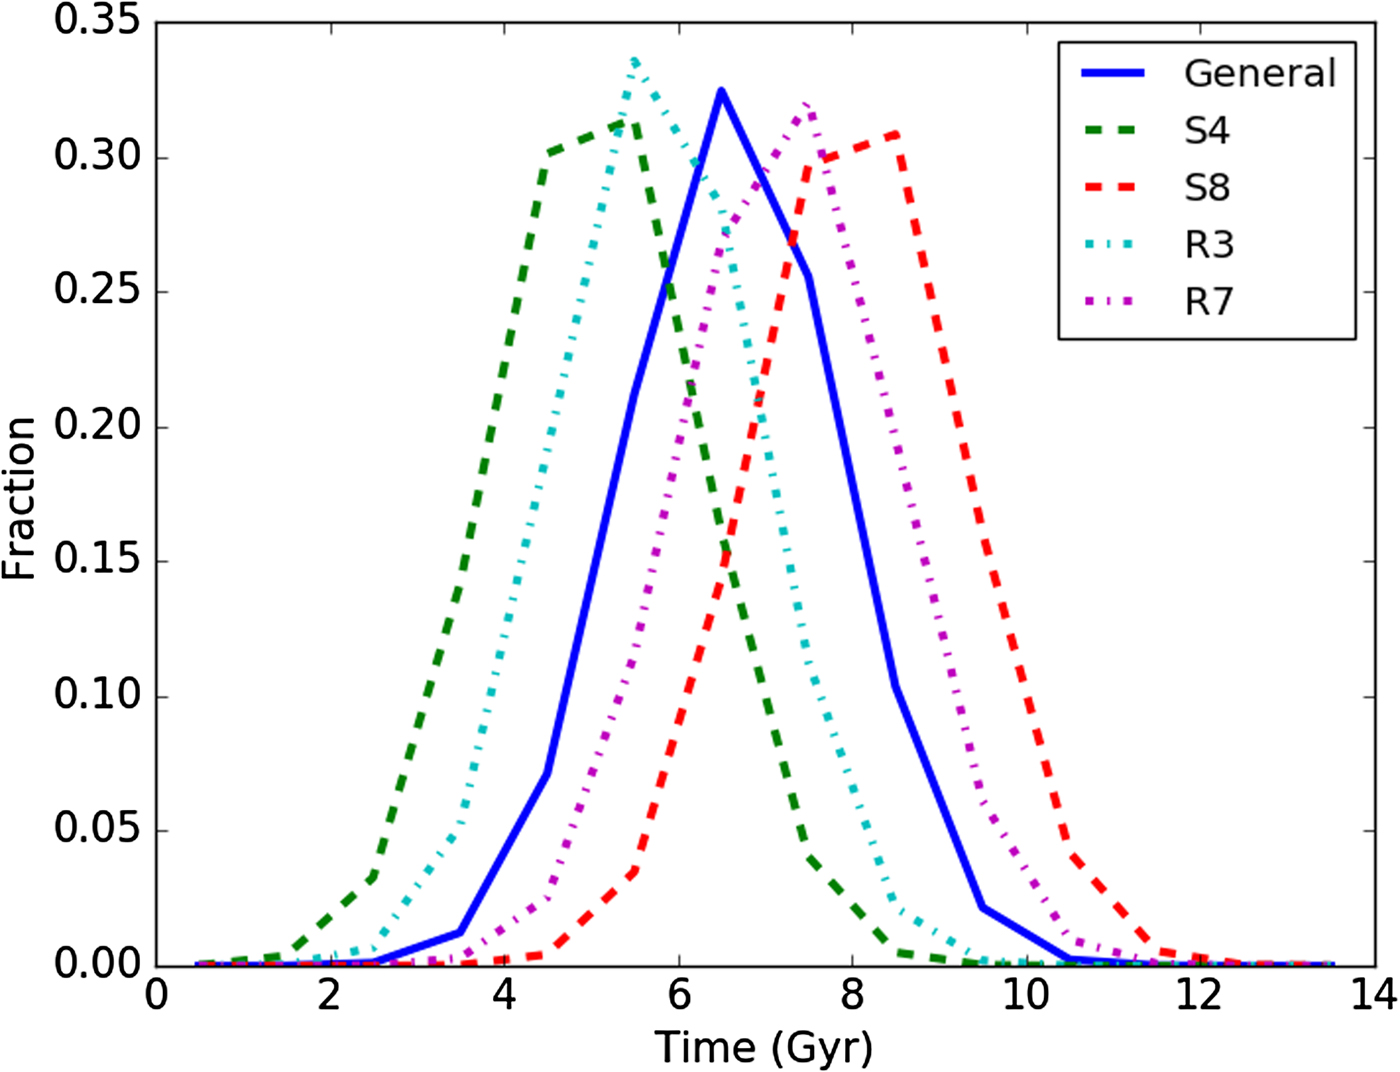
Table 6 shows the different cases for this hypothesis to see how some parameters affect the results. Starting with the modification in the number of evolutionary steps, the number of planets with primitive life (N 1) decreased by 24% for S4 and increased 23% for S8. The number of ‘vulnerable’ civilizations (N 2) had a small variation, increasing by 2.2% for S4 and decreasing by 0.4% for S8. The number of self-destroyed civilizations (N 3) increased and decreased by 30% in S4 and S8, respectively. Lastly, the number of advanced civilizations (N 4) increased and decreased by 35% in S4 and S8, respectively. Figure 8 shows that for S4 the curve shifts to the left and for S8 shifts to the right. S4 is centred around 4.5 Gyr and S8 is centred around 8.2 Gyr. For the cases where the number of reset events changes, the main effect is on the number of biospheres which are annihilated (N −1), decreasing by 40% with two less reset events (R3) and increasing 26% with two more resets (R7).

In general, the number of evolutionary steps has a greater influence on the time needed to develop an intelligent civilization than the number of reset events.
The Tortoise and Hare hypothesis
The results for the Tortoise and Hare Hypothesis are shown in Table 7. It can be seen that the difference between the hypothesis affects the evolution of life once primitive has been established. More than twice as many planets with primitive life evolve to host vulnerable civilizations and these, in turn, are 20% less likely to self-destruct. Consequently, the Tortoise and Hare hypothesis produces approximately three times the number of advanced civilizations compared with the Human History hypothesis.

According to both models, 85% of the civilizations that have existed in the Galaxy are ‘detectable’ (their signals reach the Earth). The closest detectable civilization is 110 ± 35 light years away from the Earth, but the closest non-detectable civilization is 33 ± 10 light years away. Observing for 1 month with the MWA radiotelescope we should be able to detect one civilization, translating to a probability of ~ 10−3, but with less observation time we should not be able to detect any. The Green Bank telescope, which is currently the biggest radiotelescope dedicated to SETI work, would not be able to detect an ETI signal with the 20 s sample time assigned. The FAST radiotelescope from China raises expectations of detecting an ET signal, with a probability of detecting ET civilizations of ~ 10−2 (4 ± 1 civilizations) and ~ 10−1 (37 ± 6 civilization) with 20 s and 1 h of observation time, respectively. A similar study for the SKA (Square Kilometre Array) was done by Forgan & Nichol (Reference Forgan and Nichol2011) and they showed that the probability of civilizations accidentally detecting each other was ~ 10−7.
We have applied the results to the data from the Kepler Mission FOV. This field comprises about 223 000 stars, from which about 136 000 are estimated to be in the main sequence (Monet Reference Monet1996). Comparing the numbers, there should be six Earth-like planets in the HZ orbiting main sequence Sun-like stars within Kepler's FOV. According to the Human History Hypothesis results, there is a high probability of finding simple life on three of them, but a probability of only a 4.3% of finding an intelligent civilization. On the other hand, applying the results of the Tortoise and Hare Hypothesis, there should be three planets with primitive life and a 12% probability for the existence of an intelligent civilization. At the time of writing, there is only one confirmed exoplanet in the habitable zone orbiting a G2 star (Jenkins et al. Reference Jenkins2015).
Conclusions
We have estimated the number of habitable planets within the SGR and the probability of those planets for hosting life from primitive to advanced civilizations using a simple galactic model, updated exoplanet data, conservative habitability criteria, and a hard step scenario to simulate the evolution of life.
Our model predicts that about 55% of the Earth-like planets in the HZ are inhabited, 51% by primitive life and 4% by an intelligent civilization. According to our general model, most of the life in the Galaxy takes more time to evolve to intelligent than Earth's life.
We showed that the life algorithm is very consistent, as changing some parameters do not affect the final results by more than 35%.
The model has limitations due the incompleteness of the planetary observational data and simplifications in the galactic model, such as not considering chemical evolution of the Galaxy and its consequences in the generation of Earth-like planets. The weak parameters are very difficult to estimate accurately; any changes in them proportionally affect our final result.
We also predict that there should be six Earth-like planets in the HZ within the Kepler FOV, which is consistent with the present data. The probability of finding primitive life is very high on those planets, as three of them could have it. However, the probability of finding technological life in that region is only 4.3% (0.26 planets!)
Our results support two possible solutions for the Fermi Paradox: (1) We are the only technological civilization in our Galaxy or one of the few, since most of the life in our model is incapable of developing technology to communicate outside their planets. (2) We cannot detect other civilizations because, as we showed, the probability of detecting human-like technological civilizations is low (~ 10−1) with our current instruments and observation plans.
Even though the probability of finding technological civilizations seems low, it is not minuscule. More studies have to be done to discuss the probability of success of the current SETI projects, more observation time or the participation of more and bigger radiotelescope could be necessary.
It is important to highlight that this is only a model, and the results should not be taken as absolute values but as relative trends as the input parameters improve.
Further studies are required to improve the model. The astrophysical parameters are ever better constrained frequently, especially the exoplanet data. Future missions, such as PLATO (Catala et al. Reference Catala2010) or CHEOPS (Claudi et al. Reference Claudi, Favata, Aigrain and Wilson2004), will provide more details of the properties of the exoplanets and their habitability characteristics. Biological parameters are the main problem for doing this type of models, by finding life anywhere outside our planet we could make fewer assumptions and have more precise results.
Acknowledgements
This paper has been supported by Mexican grants PE109915 (PAPIIT-DGAPA-UNAM), 128563 (CONACYT) and 275311 (CONACYT-AEM). R.R. acknowledges CONACYT for his graduate scholarship. The authors acknowledge to Drs L. Carigi, A. Segura, Y. Gómez Maqueo Chew and M. Richer for fruitful discussions and comments. We thank the two anonymous reviewers for their helpful comments on the work.