INTRODUCTION
Denitrifying bioreactors (Schipper et al. Reference Schipper, Robertson, Gold, Jaynes and Cameron2010) are engineered structures that remediate single contaminants such as nitrate (NO3 −), in surface and subsurface drainage (in-line or outfalls of tile systems) or groundwater flow systems (Cooke et al. Reference Cooke, Doheny and Hirschi2001; Cameron & Schipper Reference Cameron and Schipper2011; Christianson et al. Reference Christianson, Hanly and Hedley2011a , Reference Christianson, Bhandari and Helmers b ; Schmidt & Clark Reference Schmidt and Clark2012). Generally, they act as artificial nitrogen (N) sinks where a carbon (C) source (e.g. woodchip, straw or cardboard) provides bioavailable dissolved organic carbon (DOC), which is used to fuel heterotrophic activity, and can be mixed with soil or sediments to achieve a target-saturated hydraulic conductivity (k s ). Even if these technologies have proven efficient to remediate NO3 −, in reality mixed contaminants migrate through a denitrifying bioreactor and during NO3 − remediation, pollution swapping (Stevens & Quinton Reference Stevens and Quinton2008; Ibrahim et al. Reference Ibrahim, Fenton, Richards, Fely and Healy2013) can occur emitting other contaminants e.g. ammonium (NH4 +) and nitrous oxide (N2O). Hence, there is a need to move from solely NO3 − remediation to NO3 − and other contaminant remediation.
The aims of the present paper are to: (1) review evidence of pollution swapping in denitrifying bioreactor research (2) present a framework to identify and prioritize contaminant leaks in the system and (3) explore molecular ecology as a predictor of pollution swapping with respect to N.
Evidence of pollution swapping
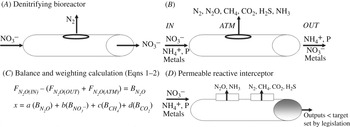
Pollution swapping involves the production of contaminants by the bioreactor, either in soluble, particulate or gaseous forms. It arises from the physicochemical and biological processes occurring in the bioreactor, through contaminated water and reactive media interactions, or down-gradient of the bioreactor, where installation of such a technology significantly modifies contaminant cycling in aquatic receptors. Work from Schipper et al. (Reference Schipper, Robertson, Gold, Jaynes and Cameron2010), Kult & Jones (Reference Kult and Jones2011), Shih et al. (Reference Shih, Robertson, Schiff and Rudolph2011), Warnecke et al. (Reference Warnecke, Schipper, Bruesewitz, Mcdonald and Cameron2011) and Healy et al. (Reference Healy, Ibrahim, Lanigan, Serrenho and Fenton2012) have highlighted pollution swapping in bioreactor research. A convenient way to illustrate pollution swapping is through the use of the ‘Hole in the Pipe’ conceptual model (Fig. 1) by Firestone & Davidson (Reference Firestone, Davidson, Andreae and Schimel1989) and Davidson & Mosier (Reference Davidson, Mosier, Hatch, Chadwick, Jarvis and Roker2004). This analogy examines variable N inputs (entrance of pipe), N losses through ‘holes’ that are pathways indicative of transmission to air and water, the sizes of which are determined by environmental conditions, and N outputs at the exit of the pipe. Where N species are only considered in the case of a denitrifying bioreactor, no pollution swapping occurs if all input NO3 − is reduced to di-nitrogen (N2) gas (i.e. denitrification stability, Gentile et al. Reference Gentile, Yan, Tiquia, Fields, Nyman, Zhou and Criddle2006, Reference Gentile, Jessup, Nyman and Criddle2007) and if no other N species are being produced. In contrast, pollution swapping can occur as: (1) N2O emissions due to denitrification instability and perturbation or (2) ammonia (NH3) and NH4 + losses to atmosphere or water, for example due to media leaching or dissimilatory NO3 − reduction to NH4 + (DNRA, Healy et al. Reference Healy, Ibrahim, Lanigan, Serrenho and Fenton2012) and NH3 volatilization. In addition, further microbial decomposition and/or anaerobic digestion of the organic-carbon media may lead to losses of non-N species, such as metals, carbon dioxide (CO2), methane (CH4) or organic carbon (OC). While denitrifying bioreactors can operate for more than a decade, they can release large contaminant fluxes right after their installation. Such losses (e.g. DOC, NH4 + or phosphorus (P)) have been attributed to organic media and/or sediment leaching within the bioreactor (Schipper et al. Reference Schipper, Robertson, Gold, Jaynes and Cameron2010; Healy et al. Reference Healy, Ibrahim, Lanigan, Serrenho and Fenton2012). This initial period contrasts with steady-state conditions, when this excess pool of contaminants has been washed away. The characterization of solute release in this initial leaching period is essential for the establishment of design criteria to attenuate high pollution loads to receptors in the early stages of the experiment (Healy et al. Reference Healy, Ibrahim, Lanigan, Serrenho and Fenton2012).
Steps required when moving from a single contaminant remediation technology (e.g. denitrifying bioreactor (A)) to a permeable reactive interceptor (D) through a holistic assessment (B), and mass balance and weighting calculations (C) of mixed contaminants remediation and pollution swapping. Changes in font size signify relative fluxes in solute or gas.

Controlling pollution swapping
Design or management manipulation in tile drainage and streambed denitrifying bioreactors has shown that pollution swapping occurs but may also be controlled.
Before installation of the bioreactor in the field, washing of the reactive media in a controlled environment to decrease initial leaching of contaminants is reported as a potential solution (Schipper et al. Reference Schipper, Robertson, Gold, Jaynes and Cameron2010; Healy et al. Reference Healy, Ibrahim, Lanigan, Serrenho and Fenton2012). The type of media used in the bioreactor also has a significant influence on gas production. Healy et al. (Reference Healy, Ibrahim, Lanigan, Serrenho and Fenton2012) observed that C fluxes were highest for cardboard (11·6–13·9 g C/m2/day) and barley straw (BBS) column bioreactors (3·9–4·4 g C/m2/day). These were correlated with the total surface area exposed within the media (Healy et al. Reference Healy, Ibrahim, Lanigan, Serrenho and Fenton2012). In a functioning bioreactor, achieving efficient reduction of pollution swapping requires identification of the physicochemical or biogeochemical processes responsible for contaminant generation. Often in the bioreactor, down-gradient of the area where the majority of the NO3 − has been reduced, there are still large amounts of DOC bioavailable to fuel microbial activity. Heterotrophic reduction of manganese (Mn) and iron (Fe) oxyhydroxides, which mostly occur when NO3 − has been reduced, can release adsorbed or co-precipitated heavy metals or P. Similarly, Shih et al. (Reference Shih, Robertson, Schiff and Rudolph2011) observed that sulphate reduction in a bioreactor increased methylmercury (MeHg) production in a streambed. In this particular case, keeping the NO3 − concentration above 0·5 mg/l as NO3-N appeared to inhibit MeHg release, as it could potentially stop further CO2 and CH4 emissions, as well as NH4 + production through DNRA. In contrast, areas of the bioreactor where denitrification occurs can be prone to N2O emissions, especially where water velocity is high (Fenton et al. Reference Fenton, Richards, Kirwan, Khalil and Healy2009b ). Indeed, Healy et al. (Reference Healy, Ibrahim, Lanigan, Serrenho and Fenton2012) showed that only small N2O emissions occur close to the water input in low-water velocity systems, due to the anaerobic conditions that prevail within the denitrifying bioreactors. In contrast, systems operated with high-water velocity tend to have higher N2O emissions spread along the denitrifying bioreactor and lower CO2 and CH4 emissions.
Hence, the key to preventing such forms of pollution swapping is to control water transit times and velocity in the bioreactor, so that no large emissions of N2O occur close to the water input, and no decrease in redox status occurs after most of the NO3 − has been reduced. Kult & Jones (Reference Kult and Jones2011) achieved this by lowering the outlet pipe of a bioreactor in a tile drainage system to avoid standing water or stagnation at low flows. In groundwater systems, temporal variations in NO3 − are smaller (Jahangir et al. Reference Jahangir, Johnston, Khalil, Hennessey, Humphreys, Fenton and Richards2012) but it is also more difficult to manipulate water residence times in the bioreactor than in a surface system.
When manipulation of water transit times is not sufficient to stop pollution swapping, new reactive cells (i.e. additional remediation sequences) will need to be added to an existing bioreactor. For P control, P sorbing material such as ochre, zeolite (also very good for NH4 + adsorption) or biochar (Fenton et al. Reference Fenton, Healy and Rodgers2009a ; Buda et al. Reference Buda, Koopmans, Bryant and Chardon2012) can be used as a sequential cell or can be mixed with the solid C media to a certain permeability. Also, Tanner et al. (Reference Tanner, Sukias, Headley, Yates and Stott2012) showed that simple sequential hybrid systems, combining wetland and denitrifying bioreactor components, can achieve advanced effluent quality with low-energy inputs. Methane losses may be reduced by the creation of an aeration zone above the bioreactor (e.g. soil capping or installation of a reactive layer e.g. biochar (Zhang et al. Reference Zhang, Cui, Pan, Li, Hussain, Zhang, Zheng and Crowley2010), low metal-emitting ochre (Pangala et al. Reference Pangala, Reay and Heal2010), a polymer or a biofilm layer which supports bacterial oxidation of methane) or by flaring off the CH4 at the surface (Simon & Müller Reference Simon and Müller2004; Themelis & Ulloa Reference Themelis and Ulloa2007; Huber-Humer et al. Reference Huber-Humer, Gebert and Hilger2008). Similarly, N2O emissions to the atmosphere might be limited by covering the bioreactor with a layer of biochar.
Towards a new generation of denitrifying bioreactors
Technical solutions to prevent pollution swapping can also be used to remediate the large range of dissolved contaminants belonging to the N cascade or other elemental cycles (e.g. P, C and heavy metals) occurring in an agricultural context. For example in addition to NO3 − remediation, N2O may be targeted. This is an intermediary product of full denitrification. Nitrous oxide emissions often occur in extensive NO3 − plumes or in tile drains, where natural conditions do not promote complete denitrification to N2 gas. They can be quite significant as indicated by the current IPCC default value of 2·5% from indirect emissions from leached N (IPCC Reference Eggleston, Buendia, Miwa, Ngara and Tanabe2006). Measurement and abatement of N2O is therefore important (Li et al. Reference Li, Lanigan and Humphreys2011).
PERMEABLE REACTIVE INTERCEPTOR
Since a denitrifying bioreactor is only designed to remediate a single contaminant, the current authors propose the term ‘permeable reactive interceptor’ (PRI) where the aim is to achieve agricultural sustainability. A PRI is a modified denitrifying bioreactor with additional remediation cells for specific contaminants in the form of solutes, particles or gases, and the capacity to deal with high temporal variation in contaminant fluxes.
During the operational phase of a PRI, practitioners will aim to achieve what the current authors term ‘a mixed-contaminant blockade’. This is the ability of a PRI to achieve complete remediation of mixed-contaminant solutions while blocking the leaks in the ‘hole in the pipe model’ of Firestone & Davidson (Reference Firestone, Davidson, Andreae and Schimel1989) (i.e. preventing pollution swapping). This may be possible in theory but may never happen in reality. Another more realistic term would therefore be a ‘mixed-contaminant blockade balance’ where both the mixed-contaminant remediation and pollution swapping occur but at acceptable rates defined by specific environmental legislation to the area the bioreactor is installed in. This balance is dynamic and will change over the lifetime of the PRI as legislative targets change. In addition, temporal changes to the characteristics of the PRI due to functional dynamics of and interactions within the microbial community, changes to organic C bioavailability, saturation of reactive media within a PRI or changes in contaminant inputs to the bioreactor may be required. Therefore, the PRI design will need to be flexible during its operational lifetime.
Contaminant blockade or contaminant blockade balance?
A simple methodology is used to determine if the mixed-contaminant blockade or contaminant blockade balance, as defined above, is achieved through a holistic analysis of the PRI in its development and operational phases. Once the state is known, intervention can occur to improve the system. The following procedure may be undertaken for any dissolved contaminants (e.g. NH4 +, NO3 −, dissolved reactive P and heavy metals), greenhouse gases (GHGs;CO2, N2O and CH4) and NH3 gas. Consider, for example, N2O:
 $$F_{{\rm N}_{\rm 2} {\rm O(IN)}} - (F_{{\rm N}_{\rm 2} {\rm O(OUT)}} + F_{{\rm N}_{\rm 2} {\rm O(ATM)}} ) = B_{{\rm N}_{\rm 2} {\rm O}} $$
where
 $F_{{\rm N}_{\rm 2} {\rm O(IN)}} $
and
 $F_{{\rm N}_{\rm 2} {\rm O(OUT)}} $
are the dissolved flux (F) of N2O at the inlet (IN) and outlet (OUT) of a PRI, respectively. The term
 $F_{{\rm N}_{\rm 2} {\rm O(ATM)}} $
is the N2O lost from the PRI to the atmosphere (ATM) (Fig. 1), and
 $B_{{\rm N}_{\rm 2} {\rm O}} $
is the balance of N2O between these three fluxes. If
 $B_{{\rm N}_{\rm 2} {\rm O}} $
>0, remediation within the PRI has occurred; if
 $B_{{\rm N}_{\rm 2} {\rm O}} = 0$
, the compound is conserved during transport through the PRI (or remediation and production of the compound are equal), and if
 $B_{{\rm N}_{\rm 2} {\rm O}} $
<0, then pollution swapping has occurred. Even if such calculations are made by considering the PRI in isolation, they could be extended to any connected water body, by accounting for pre- and post-PRI contaminant fluxes in such a water body.
Balances calculated using Eqn (1) can be used to derive a sustainability index (x) and a weighting system can be applied, whereby the weighting of trade-offs between different loss pathways can be judged (Eqn 2). The advantage of this is that different regions can apply different weightings depending on the environmental policy emphasis. An example here is where aeration is a problem in a system, resulting in a trade-off between CH4 and N2O:
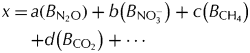 $$\eqalign {x = \tab a(B_{{\rm N_{2}O}} ) + b\left( {B_{{\rm NO}_{\rm 3}^{\rm -}}} \right) + c\left( {B_{{\rm CH}_{\rm 4}}} \right) \cr \tab {+ d\left( {B_{{\rm CO}_{\rm 2}}} \right) + {\cdots}} $$
where a–d and so on are weighting factors and B terms here are gathered from Eqn (1). Other contaminants in gaseous (e.g. NH3 and H2S), dissolved (e.g. NH4 +, metals) and particulate (e.g. particulate P) forms may also be added.
Working through Eqns (1) and (2) for all contaminants creates an overall balance, identifies contaminants of concern and remediation sequences, which can be implemented to form a PRI (See Fig. 1 for a N2O example). This process should be repeated at different intervals during the development and operational phases of the PRI.
To illustrate the use of Eqn (1), a dataset summarizing the balances of selected GHGs and dissolved contaminants for a series of laboratory scale denitrifying bioreactors is presented in Table 1 after Healy et al. (Reference Healy, Ibrahim, Lanigan, Serrenho and Fenton2012). In this case study, NO3 − reduction and pollution swapping were tested for four different C substrates (lodgepole pine woodchips (LPW), cardboard, lodgepole pine needles (LPN) and BBS) mixed with soil (C source-to-soil volume ratio of 1). Nitrate spiked water (19·5–32·5 mg/l as NO3-N) was circulated into the columns at a hydraulic loading rate of 30 mm/day for up to 460 days. This low hydraulic loading rate, combined with a source of OC in excess, was aimed to represent shallow groundwater conditions and promote heterotrophic activity (see Healy et al. (Reference Healy, Ibrahim, Lanigan, Serrenho and Fenton2012) for further details). Ammonia concentrations were negligible in the study and were therefore omitted from the balance for this case study. For example, NH3 losses associated with dirty water and lagoon systems ranged from 0 to 0·6 g/m2/day NH3-N (Hill et al. Reference Hill, Smith, Russell, Misselbrook and Brookman2008).
Balances (in g/m/day) of major dissolved compounds and greenhouse gases from laboratory scale denitrifying bioreactors (see Healy et al. (Reference Healy, Ibrahim, Lanigan, Serrenho and Fenton2012)) as calculated using Eqn (1). Four carbon sources are used: lodgepole pine woodchips (LPW), cardboard, lodgepole pine needles (LPN) and barley straw (BBS). Negative and positive balances indicate remediation and production of the compound, respectively

In order to implement adequate weighting factors as in Eqn (2) for such a system, one has to identify prominent environmental legislation or issues at stake in the geographic area where the PRI is installed. Current concentration thresholds or maximum admissible GHG emissions can be used to attribute weighting factors. For instance, in Ireland, the maximum admissible concentrations (MAC) for molybdate reactive phosphorus (MRP=PO4 3−−P in the present case study) and NH4 + in rivers are set at 35 and 65 μg/l, respectively, while NO3 − in groundwater should not exceed 8·5 mg/l (the current threshold, whereas 11·3 mg/l as NO3-N is the MAC). Hence, the weighting factor for PO4-P should be 1·86 times higher than for NH4-N (65/35=1·86). Similarly, the weighting factor for PO4-P should be 242·03 times higher than for NO3-N (8471/35=242·03). Similarly, global warming potential (GWP) is a measure of radiative forcing attributable to an individual GHG relative to that of CO2, which has a GWP of 1. This variable, which is 25 and 296 on a 100-year basis for CH4 and N2O, respectively (IPCC Reference Eggleston, Buendia, Miwa, Ngara and Tanabe2006), could be used in addition to others to determine the weighting factors. This exercise is illustrated using the three cases given below.
Case 1
Case 1 (e.g. USA, intensive feedlot pastoral, pig and poultry systems, legislative instruments are focused on water quality): NO3 − removal is the most important environmental concern, while GHGs emissions to the atmosphere and other contaminant losses to water are perceived as secondary. In this case, NO3-N balances are attributed significantly highest weighting factors in Eqn (2) than other contaminants. An example of this is given in Table 2 (Case 1), where the weighting factor for NO3-N is set to 1, and all other weighting factors to <1. The results of Eqn (2) are then expressed in g/m2/day as NO3-N. In this case, the ranking of the different bioreactors is as follow: 1-LPW; 2-LPN; 3-BBS; 4-Cardboard.
Ranking of the four carbon sources. Case 1 is expressed in g/NO3-N/m/day, Case 2 in g/PO4-P-eq/m/day and Case 3 in g/CO2-eq/m/day. Smaller values within the same column indicate lower environmental impact. (X) indicates ranking for individual cases. For Case 1 all weighting factors are set to zero except for NO3-N, for Case 2 all weighting factors for greenhouse gases are set to zero and for Case 3 all weighting factors for dissolved contaminants are set to zero

Case 2
Case 2 (e.g. EU – Ireland, extensive pasture-based livestock production, legislative instruments are focused on water quality (EU Water Framework Directive 2000/60/EC (CEC 2000) and Nitrates Directive, Directive 91/676/EEC (CEC 1991), GHG (EU 2020 Effort Sharing Decision, Decision No. 406/2009/EC (CEC 2009)) and transboundary pollutants (National Emissions Ceilings Directive, Directive 2001/81/EC (CEC 2001)): contaminant losses to water are perceived as a more important issue than GHG and transboundary emissions to the atmosphere. When only accounting for NO3 −-N, NH4 +-N and PO4 3−-P, the weighting factors are set to 1, 0·538 (35/65) and 0·004 (35/8471), respectively. The results of Eqn (2) are then expressed in g PO4 3−-P-eq/m2/day. In this case, the ranking of the different bioreactors is: 1-BBS; 2-LPN; 3-Cardboard; 4-LPW.
When accounting only for GHG and NH3 emissions, one must refer to national legislation targets. In Ireland, the national target of GHG reduction is set to 20% in 2020, but there is no legislative limit set on individual farmers. In addition, while transboundary gases are limited to 100 ktonnes NH3, national emissions are 10% under this ceiling. Hence, the potential weighting factors for GHG and NH3 are 0·2 and 0·1, respectively.
Research should now focus on ways to amalgamate weighting factors for dissolved and particulate contaminants, and GHG and NH3 emissions.
Case 3
Case 3: For example, in New Zealand (intensive pastoral system, legislative instruments are focused on GHG without NH3) gaseous emissions to the atmosphere are perceived as a more important issue than contaminant losses to water. Currently, New Zealand is committed to reducing emissions by 5% by 2020 (10–20% in the case of a global agreement). Under the Climate Change Regulations (Agricultural Sector) 2010 (New Zealand Government 2010), agricultural emission targets are set for processors and live exporters with a subsequent ‘trickle down’, which is an impetus on farmers, particularly in terms of reducing farm N surpluses. In this case, CH4, CO2 and N2O balances are attributed significantly higher weighting factors than for N deposition or dissolved and particulate contaminants. An example of this is given in Table 2 (Case 3), where the weighting factor for CO2, CH4 and N2O are set at 1, 25 and 296, respectively, while all dissolved contaminants are given a weighting factor of <1. The results of Eqn (2) are then expressed in g CO2-eq/m2/day. In this case, the ranking of the different bioreactors is: 1-LPW; 2-LPN; 3-BBS; 4-Cardboard. One key point of the New Zealand approach is that agricultural emissions are quantified by ‘emissions intensity’ or emissions per unit product basis. Therefore in this case, the emissions generated from the PRI should be expressed in terms of the production activity (yearly milk or beef output, for example) from the farm.
Based on these three case studies, an overall ranking can be determined, as presented in Table 2. Attributing weighting factors to both dissolved contaminants and GHGs in the same case study is more complex and would require assessing their respective environmental costs and benefits. Stevens & Quinton (Reference Stevens and Quinton2009) propose economics through cost-effectiveness analysis as a tool which could potentially enable the inclusion of pollution swapping in policy. Schipper et al. (Reference Schipper, Robertson, Gold, Jaynes and Cameron2010) have already shown using a preliminary cost–benefit analysis that such systems are synergistic to other management practices that try to minimize N losses, but this needs to be assessed at PRI implementation level. Multi-criteria analysis may offer a solution and incorporates any number of variables including cost effectiveness to assess a system in a holistic way, thereby taking account of pollution swapping (Balana et al. Reference Balana, Vinten and Slee2011).
In the first instance, pressure or weighting will be towards water quality as agriculture is currently outside of the GHG emissions trading scheme (ETS). As a result, there is no mechanism for individual farmers to gain or lose under such schemes. While this may change in the future, medium-term pressure for farmers to reduce emissions will be from producers and retailers focusing on marketing low C footprint agri-food products. Reducing the C footprint of agricultural produce is currently viewed as a principle (and easily measurable) metric of ‘sustainable’ production, and is viewed as a key factor in distinguishing quality produce and exploiting emerging markets by retailers and processors. This, rather than official trading schemes, is likely to put pressure on farmers to reduce GHGs. The efficacy of incorporation into trading schemes will be dependent on: (1) the point of obligation (farmer or processor) and (2) the price of C. This is exemplified in New Zealand where agriculture has been brought into the national ETS. Here the point of obligation is the processor, which in turn puts pressure on the farmer to reduce emissions.
Permeable reactive interceptor performance will be affected by inherent variability of contaminant fluxes and base flow/storm flow conditions between sites and PRI type (groundwater v. drainage). Using a natural drainage spring system as an example, an adaptable system will need to be designed in both cases to cope with variations in contaminant fluxes (e.g. base flow contamination from point source pollution or storm flow contamination from diffuse source pollution). In Ireland, large areas of intensive grassland is underlain by karst limestone, and spring discharges tend to range from a few litres per second for most to >10 litres/s in 200 cases and >25 litres/s for 50 cases with catchments of several km2 (Drew Reference Drew2011). Using an average denitrification rate of 7·6 g N/m3/day calculated by Warnecke et al. (Reference Warnecke, Schipper, Bruesewitz, Mcdonald and Cameron2011) in a denitrification bed with a flow rate of 1·7 litres/s (equivalent to 145 m3/day), which is similar to that of a likely karst spring, the volume and dimensions of a PRI primarily targeting NO3 − remediation can be estimated for different input and output NO3 − concentrations. For example, to attenuate an input concentration of double the present EU-MAC (22·6 mg/l NO3 −-N) to the actual MAC, a bioreactor would need a volume of 218·4 m3, while to achieve total removal of N the volume increases further to 436·8 m3.
Several aspects here are interesting: (1) the denitrification rate needs to be estimated preferably at a field site, ensuring that real conditions prevail (e.g. temperature), using the selected organic C media or alternatively in control rooms under laboratory conditions (Healy et al. Reference Healy, Ibrahim, Lanigan, Serrenho and Fenton2012); (2) where land availability is scarce, the size of the PRI may be a limiting factor and may control the output concentration of NO3 −; and (3) an adaptive system might be needed to divert a proportion of the inlet flow to additional remediation units during times of excessive flow rates, e.g. storms.
THE WAY FORWARD: USING MOLECULAR ECOLOGY AS A PREDICTOR OF POLLUTION SWAPPING IN A PERMEABLE REACTIVE INTERCEPTOR
For the purposes of this special issue, the present paper focuses on the impact of molecular ecology on N cycling. Equivalent technologies should be explored for other elements. It will be expensive to assess a PRI in a holistic way. In the future, useful in situ tools such as biosensors should be developed for on-going monitoring and improvement of PRI performances. Microorganisms drive the majority of biogeochemical processes in natural and engineered systems, and have a major role in the cycling of N. As such, an understanding of the prevalence, diversity and activity of functionally important microbial groups can offer critical insights into important biogeochemical cycles in systems such as PRIs, and offer tools for optimization of system functioning. While numerous approaches are currently available to measure transformation processes, many suffer from limitations making their use undesirable or impractical (Groffman et al. Reference Groffman, Altabet, Böhlke, Butterbach-Bahl, David, Firestone, Giblin, Kana, Nielsen and Voytek2006). A particular methodological challenge in the context of the pollution swapping is accurate measurement of N2 gas fluxes against a background of high N2 concentrations in the environment (Groffman et al. Reference Groffman, Altabet, Böhlke, Butterbach-Bahl, David, Firestone, Giblin, Kana, Nielsen and Voytek2006), and the resulting calculation of N2O : N2 ratios, a critical component in the assessment of the environmental sustainability of PRI systems. Molecular microbial ecology approaches that focus on the populations, genes, transcripts and enzymes driving these processes offer new opportunities to overcoming these challenges (Philippot et al. Reference Philippot, Hallin and Schloter2007).
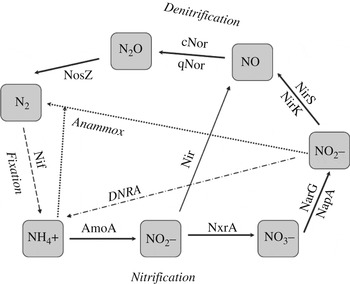
The capability for denitrification is widely dispersed across environments and microbial phylogenetic groups, with greater than 60 genera known thus far to contain denitrifiers (Throbäck et al. Reference Throbäck, Enwall, Jarvis and Hallin2004; Philippot et al. Reference Philippot, Hallin and Schloter2007). These include representatives from bacterial, fungal and archaeal groups (Groffman et al. Reference Groffman, Altabet, Böhlke, Butterbach-Bahl, David, Firestone, Giblin, Kana, Nielsen and Voytek2006). As such, commonly used molecular taxonomic markers, such as 16S rRNA, are of limited use for identifying denitrifiers. Molecular techniques since the late 1990s have instead focused on the use of functional genes and enzymes involved in N transformations within the denitrification pathway (Groffman et al. Reference Groffman, Altabet, Böhlke, Butterbach-Bahl, David, Firestone, Giblin, Kana, Nielsen and Voytek2006; Philippot et al. Reference Philippot, Hallin and Schloter2007). Seven enzymes have since been identified which catalyse the four major transformations within the pathway (Fig. 2) (Philippot & Hallin Reference Philippot and Hallin2006; Philippot et al. Reference Philippot, Hallin and Schloter2007). The initial transformation of NO3 − to nitrite is catalysed by NO3 − reductase. This can be of two types: membrane-bound (Nar) or periplasmic (Nap), and denitrifers can have either or both forms (Philippot & Hallin Reference Philippot and Hallin2006). Dissimilatory NO2-reduction is catalysed by enzymes encoded by two genes, nirS and nirK. These genes are functionally and physiologically similar, yet structurally different (Throbäck et al. Reference Throbäck, Enwall, Jarvis and Hallin2004). In most cases, only one of the two types of nitrite reductase is observed within individual denitrifers, but cases of isolates possessing both have also been reported (Philippot & Hallin Reference Philippot and Hallin2006). Reduction of NO is also performed by two types of enzymes, cNor and qNor. Nitrous oxide reductase performs the final step in denitrification, the reduction of N2O to N2, and the catalytic subunit nosZ is used as a molecular marker for this process in Gram-negative bacteria (Philippot et al. Reference Philippot, Hallin and Schloter2007). Other functional gene targets have been identified within other N-cycling pathways, such as within N fixation and nitrification. The quantification of these functional genes enables potential rates of different N transformations to be estimated and the effect of media/environmental changes on potential rates to be deduced. In particular for denitrification, the quantification of nosZ and nirK/nirS within PRIs enables potential rates of complete and incomplete denitrification, respectively, to be estimated. Functional gene targets for other processes that may be important with respect to pollution swapping within these systems, such as methanogenesis (mcrA) and sulphate-reduction (dsrAB), are also available (Nercessian et al. Reference Nercessian, Bienvenu, Moreira, Prieur and Jeanthon2005). While microbial ecology tools are now being employed with increasing frequency to better understand processes underlying system functionality in a large array of other engineered systems, such as water infiltration systems, their use in PRIs is rare. Recent investigations of denitrifiers in such systems have used culture-based methods (Moorman et al. Reference Moorman, Parkin, Kaspar and Jaynes2010), which may underestimate numbers due to difficulty in culturing denitrifiers (Wallenstein et al. Reference Wallenstein, Myrold, Firestone and Voytek2006; Philippot et al. Reference Philippot, Hallin and Schloter2007) or non-quantitative molecular approaches (Elliot Reference Elliot2009). A notable exception was a study carried out by Warnecke et al. (Reference Warnecke, Schipper, Bruesewitz, Mcdonald and Cameron2011), who investigated the microbial ecology of laboratory denitrification beds filled with different C media incubated at different temperatures and receiving variable NO3 − inputs. NirS, nirK and nosZ genes were quantitatively investigated over time and compared with measured rates of N transformations. Results showed that the abundance of denitrifying genes was similar in replicate barrels under cold incubation and this changed under warmer incubation temperatures. Warm incubation enhanced growth of nirS-containing bacteria and bacteria that lacked the nosZ gene. This may have implications for studies undertaken in a warmer laboratory or natural environments, which generally exhibit higher N2O emissions. Feng et al. (Reference Feng, Xu, Xu, Zhu, Xu, Ding and Luan2012) also recently used molecular fingerprinting methods to deduce the relative dominance of functional microbial populations in a denitrifying bioreactor, according to variations in bioreactor operation and environmental conditions during treatment.
Selected N biotransformation pathways and common gene targets used in molecular ecology.

While in general terms denitrification will be the most important process in a denitrification bioreactor or PRI, other lesser known processes such as DNRA, nitrification and anammox may play a role in certain sections of the bioreactor where conditions for denitrification cease to be ideal. For example, if NO3 − rates decrease at the end of the PRI pathway, other processes such as DNRA may become more important. This may offer opportunities with regard to pollution swapping, for example, when end-of-system NH4 + rates are considered unacceptably high. Environmental conditions within a PRI system change both temporally and spatially, with a resulting impact on the distribution of denitrifying microbial communities and their metabolic response to a given set of conditions (Groffman et al. Reference Groffman, Altabet, Böhlke, Butterbach-Bahl, David, Firestone, Giblin, Kana, Nielsen and Voytek2006; Wallenstein et al. Reference Wallenstein, Myrold, Firestone and Voytek2006; Philippot et al. Reference Philippot, Andert, Jones, Bru and Hallin2011). For example, not all denitrifiers can catalyse all steps in the denitrification process, and a truncated pathway is often observed (Philippot & Hallin Reference Philippot and Hallin2006). Most commonly, denitrifiers lack the nosZ enzyme, thereby limiting the genetic capacity to produce N2 gas and necessarily producing the GHG N2O as an end product (Braker et al. Reference Braker, Schwarz and Conrad2010; Philippot et al. Reference Philippot, Andert, Jones, Bru and Hallin2011). Thus, the response to environmental regulators of compositionally different denitrifier communities varies and has been shown to result in different N2O emission rates (Braker et al. Reference Braker, Schwarz and Conrad2010). The genetic composition of the denitrifier population is therefore of importance, when considering the potential of PRIs to reach the contaminant blockade. However, it must be noted that the genetic composition alone of a community is insufficient to predict the transformation rates, as bacterial denitrification is generally a facultative ability. Thus, use of this respiratory pathway is not essential for the survival of members of these communities (Groffman et al. Reference Groffman, Altabet, Böhlke, Butterbach-Bahl, David, Firestone, Giblin, Kana, Nielsen and Voytek2006). Consequently, the targeted genes may not necessarily be expressed under the environmental conditions studied (Philippot Reference Philippot2005). However, molecular characterization of denitrifiers, together with quantification of environmental controllers and denitrification rates, potentially offers a unique opportunity to evaluate and manipulate both abiotic and biotic controls driving observed N transformations (Groffman et al. Reference Groffman, Altabet, Böhlke, Butterbach-Bahl, David, Firestone, Giblin, Kana, Nielsen and Voytek2006; Stark & Richards Reference Stark and Richards2008). In addition to DNA-based insights into the diversity and genetic potential of a community for denitrification, currently evolving methodologies, based either on mRNA or proteins, aim to target active microorganisms to understand the relationship between community diversity and system function (Philippot & Hallin Reference Philippot and Hallin2006; Wallenstein et al. Reference Wallenstein, Myrold, Firestone and Voytek2006).
CONCLUSIONS
In the present paper, a novel remediation technology, or PRI, is presented. Existing denitrifying bioreactor design should be modified to create PRIs able to achieve: (1) remediation of mixed-contaminant solutions and (2) limited pollution swapping. Such a move from denitrifying bioreactors to PRIs makes use of two new concepts: (1) a mixed-contaminant blockade, which is the ability of a PRI to fully remediate contaminants without pollution swapping (‘leaks’ in the ‘hole in the pipe model’) and (2) a mixed-contaminant blockade balance, where both contaminant remediation and pollution swapping occur. Before and after installation of a PRI prototype at a site, equations are used to calculate mass balances of gases and dissolved and particulate contaminants within the PRI. Equations are first applied theoretically before the PRI is installed, so that the potential need for additional remediation cells can be incorporated into the PRI design. In turn, these balances are used as inputs into a weighting calculation, whereby the weighting of trade-offs between different loss pathways can be evaluated, by accounting for the respective environmental and monetary costs of the contaminants. Following this initial step, additional remediation sequences can be implemented to the PRI prototype to target specific contaminants. Balances and weighting calculations are computed again: (1) to provide an initial assessment of the remediation efficiency and potentially manipulate the PRI design in order to increase this efficiency and (2) to monitor long-term performances of the PRI. There may be a further need to express PRI performance in terms of overall farm productivity (the concept of emissions intensity), as greater production will probably result in higher throughput or more PRIs on a farm. The use of PRIs coupled to an intensification of production may result in greater decoupling of losses v. productivity. Developments in the field of molecular and microbial ecology may offer a way forward as indicators of contaminant dynamics and overall sustainability of PRIs. Further testing of the concepts and equations presented in this paper are required during field studies of PRIs.
This research was funded by the Department of Agriculture, Food and the Marine under the Research Stimulus Fund (grant no. RSF 07 525). The authors would also like to thank the French Embassy (Dublin) foreign travel fund for the attendance at the 6th World Water Forum in Marseille.