

Once considered a disease associated with young persons, HIV disease is increasingly recognized as one that impacts people of all ages, including older adults. Although in most gerontological research, older adults are defined as those over the age of 65, in HIV research, older adults are usually defined as being aged 50 and older (Poindexter & Keigher, Reference Poindexter and Keigher2004). This change in definition is partially a legacy from earlier in the epidemic when HIV was considered a terminal illness and few survived very long with a diagnosis of HIV or AIDS.1 Another reason is that we are beginning to see that those who are living with HIV often face “premature aging” (Deeks & Phillips, Reference Deeks and Phillips2009). Data from both Canada and the United States indicate that the number of adults aged 50 and over living with HIV disease is growing2 (Public Health Agency of Canada [PHAC], 2010; Centers for Disease Control and Prevention [CDC], 2011).
It is difficult to ascertain how many people who are living with HIV/AIDS (PHAs) in Canada are over the age of 50. In 2010, PHAC issued a report titled HIV/AIDS among Older Canadians. The report stated that 15.3 per cent of all new HIV case reports (between 2,300 and 4,300) in 2008 were among those over the age of 50. Thus, there were somewhere between 351 and 658 new HIV infections in 2008 among adults over the age of 50. PHAC did not report the overall age of PHAs across Canada.
It is important to understand the needs of older PHAs because the PHA population is aging. The success of highly active antiretroviral therapy (HAART) in changing HIV disease from a fatal condition to a chronic episodic health condition for much of the developed world contributes to the growing prevalence in the aging population (Mack & Ory, Reference Mack and Ory2003). In its most recent surveillance report, the U.S. Centers for Disease Control and Prevention (CDC, 2011) indicated that in 2006, an estimated 166,445 individuals aged 50 and over were living with HIV infection in the United States (from the 40 states providing confidential name-based reporting), and that by 2008, that number had increased to 208,947 – an increase of approximately 25.5 per cent. This increasing number may be the result of the success of HIV treatments among those diagnosed at a younger age and who are now aging.
Although Canadian statistics are not detailed enough to provide absolute evidence of increases in the incidence and prevalence of older PHAs in Canada, it is noteworthy that the potential for under-reporting of HIV/AIDS among older people exists, suggesting the possibility that HIV infections could be higher than reported. One reason for potential under-reporting includes misdiagnosis due to lower clinical suspicion in relation to older adults and risk behaviours (Martin, Fain, & Klotz, Reference Martin, Fain and Klotz2008). For instance, physicians and other health care providers commonly avoid discussing issues of sexuality with older adults (Gott, Hinchliff, & Galena, Reference Gott, Hinchliff and Galena2004), thereby increasing the possible lack of HIV awareness and testing in relation to older adults. Misdiagnosis often results in a late diagnosis of HIV. This misdiagnosis is concerning because HIV-infected patients whose CD4 counts are below 200 cells/μL experience increased morbidity and mortality, diminished responses to HIV treatment including antiretroviral therapy, and higher health care expenditures (Mugavero, Castellano, Edelman, & Hicks, Reference Mugavero, Castellano, Edelman and Hicks2007). Additionally, late diagnosis may result in an undiagnosed person’s continuing to engage in unprotected sex, unaware of the infection.
Evidence is clear that increased age is a factor associated with late diagnosis of HIV disease. Hall et al. (Reference Hall, Geduld, Baulos, Rhodes, An and Mastro2009) analysed 1996–2005 data on AIDS and HIV diagnoses reported to the American and Canadian national surveillance systems. The researchers found that in both Canada and the United States, persons aged 50 and over were more likely than younger individuals to be diagnosed with AIDS within a year of their HIV diagnosis. In Canada specifically, 69.6 per cent of those aged 50 and over fell into this category. U.S. data were comparable, with nearly 60 per cent of those aged 50 and over receiving a late diagnosis.
This dynamic is complicated by the fact that many HIV/AIDS symptoms are mistakenly viewed as a normal part of aging (Health Resources and Services Administration, 2009; Paul, Martin, Lu, & Lin, Reference Paul, Martin, Lu and Lin2007). In an oft-cited study from the 1990s, el-Sadr and Gettler (Reference el-Sadr. and Gettler1995) studied serum samples from deceased patients in a New York City hospital over the course of one year. The source patients, between the ages of 60 and 79, were not previously known to be HIV positive. The study reported that 5 per cent of men and 9 per cent of women in this age group were found to be HIV-positive post-mortem.
Older adults living with HIV disease face some specific concerns. In particular, they commonly face co-morbid health conditions. These conditions may be age-associated disease states that often manifest earlier with an HIV diagnosis or that may be brought on directly by HIV or even HIV treatments. The New York Research on Older Adults with HIV (ROAH) study found that among older PHAs, more than 9 in 10 older persons interviewed had at least one other health condition, and 77 per cent listed two or more such conditions (Karpiak, Shippy, & Cantor, Reference Karpiak, Shippy and Cantor2006). In addition to the chronic health conditions typically associated with aging, some evidence suggests an increased risk for additional disorders associated with HIV disease and its treatment. These include metabolic and hormonal disorders, cardiovascular disorders, and diabetes (Kohli et al., Reference Kohli, Klein, Schoenbaum, Anastos, Minkoff and Sacks2006). Other researchers have reported a risk for increased liver and kidney disorders (Goulet et al., Reference Goulet, Fultz, Rimland, Butt, Gibert and Rodriquez-Barradas2007). As Justice (Reference Justice2010) pointed out, the co-occurrence of HIV and co-morbid conditions can produce frailty and decreased functional capacity associated with both HIV disease and its interaction with other conditions.
Despite the variety of concerning health outcomes that may affect older PHAs, very few analyses of larger datasets, outside of epidemiological reports, offer a description of the socio-demographics of older adults living with HIV. The ROAH study (Karpiak et al., Reference Karpiak, Shippy and Cantor2006), which sampled nearly 1,000 older PHAs (over age 50), was a significant and critical study that provided a detailed overview of the socio-demographics of older PHAs in New York City. This study utilized convenience and outreach sampling in order to maximize the voice of this often marginalized population. Their sample was primarily heterosexual (67%) and male (70%, with 29% female, and 1% transgender), and was racially diverse (50% Black, nearly one-third Latino, and 14% White). Over one-half (58%) of those sampled were between 50 and 55 years of age, 26 per cent were between 56 and 60 years, and nearly 16 per cent were aged 60 and older.
Although the ROAH study (Karpiak et al., Reference Karpiak, Shippy and Cantor2006) provides some needed information about a population of older PHAs, the study’s findings may not be generalizable to other regions. Given that the demographics of HIV populations may vary, depending on the makeup of the jurisdiction and the communities affected, other investigations into the socio-demographics of older PHAs can help to illuminate their needs.
Previous research has also highlighted significant differences among the sub-populations of those living with HIV in North America, based on gender and sexual orientation. For instance, evidence suggests that individuals who identify as heterosexual men and women are more likely to be immigrants to Canada from a country where HIV is endemic, especially if they did not report getting HIV through injection drug use (PHAC, 2007). Among HIV-positive adults, gay and bisexual men are more likely to report higher education levels and income than their heterosexual counterparts (Penniman et al., Reference Penniman, Taylor, Bird, Beckman, Collins and Cunningham2007). Other research has shown that among people living with HIV, perceived and actual social supports affected mental health outcomes differently for gay, bisexual, and heterosexual men, as well as for women (Chesney et al., Reference Chesney, Ehrhardt, Gore-Felton, Johnson, Kelly and McAuliffe2009). In particular, among gay men, having networks of social support was a more predictive positive factor than supportive family (Wohl et al., Reference Wohl, Galvan, Myers, Garland, George and Witt2010). These differences have not yet been assessed among older adult populations living with HIV.
In 2009, of all HIV cases reported among the Canadian provinces to the PHAC, Ontario reported the highest proportion of cases (42%). According to the Ontario HIV Epidemiologic Monitoring Unit, between 1985 and 2009, 4.7 per cent (n = 1,341) of all HIV diagnoses in Ontario were among those aged 55 years and older (R. Remis, personal communication, May 15, 2011). An analysis of a dataset from Ontario may help to illuminate issues for other jurisdictions interested in examining and responding to the needs of older PHAs. The Ontario HIV Treatment Network [OHTN] Cohort Study (OCS) is an ongoing longitudinal observational cohort study that collects data on the clinical profile and social determinants of health of people living with HIV in the province of Ontario, Canada (Ontario HIV Treatment Network [OHTN], 2011). The OCS dataset provides an opportunity to examine a sample of this population in a more comprehensive way than has been done previously due to the limited information available only through surveillance data. By providing a more detailed examination of the socio-demographic profile of a sample of older PHAs in Ontario, health and social service providers – as well as researchers and policy makers – can develop strategies to advance the health and well-being of this population. The purpose of our study discussed in this article, therefore, was to describe the socio-demographic characteristics of adults aged 50 and over living with HIV disease in Ontario, Canada, who are participating in the OCS. Additionally, this study sought to highlight some of the differences in relation to gender and sexual orientation among the sample.
Methods
Data Source
Data for the OCS are collected at 10 clinical sites across the province: Greater Toronto Area (Toronto General Hospital, St. Michael’s Hospital, Maple Leaf Medical Clinic, and Sunnybrook Health Sciences Centre), Kingston (Hotel Dieu Hospital), Ottawa (The Ottawa Hospital), Hamilton (St. Joseph’s Hospital), Windsor (Windsor Regional Hospital), London (St. Joseph’s Health Care), and Sudbury (Sudbury Regional Hospital).
The OCS collects clinical data through electronic medical records, chart extraction, and linkages to other databases. It also collects socio-behavioural data once per year through interviewer-administered questionnaires. The OCS questionnaire has two versions: (1) the core questionnaire takes approximately 30 minutes to complete and collects demographic information and limited socio-behavioural data at seven sites across Ontario; and (2) the extended questionnaire takes approximately 90–120 minutes to complete and collects a wider scope of socio-behavioural data through validated instruments at three sites in the Greater Toronto Area. OCS staff routinely invites HIV-positive patients who are under care at these clinics to participate in the study.
All OCS participants are screened for eligibility and informed consent is obtained prior to clinical data extraction and questionnaire administration. Eligible participants include adult (>18 years old) residents of Ontario with evidence of HIV infection (i.e., positive HIV antibody test or laboratory evidence of HIV infection). Enrolled patients are provided with an honorarium for participation. OCS research studies are developed by investigators through the OCS Working Group and Scientific Steering Committee discussions and approved by the OCS Governance Committee, the majority of whom are people living with HIV. This study was approved by the Research Ethics Board of the University of Toronto and was exempt from Human Subjects Review by the University of Washington.
Sample
We selected a sub-sample of the OCS database in order to include adults who were aged 50 or older at the time of their most recent interview (n = 1,129). As we were also interested in comparing sub-groups of older PHAs based on gender and sexual orientation, we excluded those who did not provide data on one or both of these variables of interest (n = 26). A full description of excluded respondents is provided in the next section. Our final sample included 1,103 older adults who completed the core (n = 643) or both the core and the extended questionnaire (n = 460). Analysis of socio-demographic and health-related variables was based on the entire sample (n = 1,103), while the analysis of psychosocial and clinical variables was based on those who completed the extended questionnaire (n = 460).
Measures
Definition of Sub-samples
Based on evidence of gender and sexual orientation differences among PHAs, we constructed a variable representing self-defined gender and sexual orientation in order to explore differences between the following sub-samples: women, heterosexual men, gay men, and bisexual men. Gender was assessed by asking participants to “define your gender” as woman, man, trans (male to female), trans (female to male), two-spirited, inter-sexed, or other. Unfortunately, due to extremely small sample sizes, we were unable to include those who described themselves as transgender, two-spirited, or “other” (n = 9). No one identified as inter-sexed. Sexual orientation was assessed using the following categories: heterosexual, lesbian, gay, bisexual, and other. Once again, due to small sample sizes, we could not include the “other” category (n = 8). Also, we could not sub-divide females by sexual orientation because very few older women identified as lesbian, gay, or bisexual. In total, 26 individuals were excluded: 10 with missing data on gender and/or sexual orientation and 16 who defined themselves using one or both of the excluded gender/orientation categories.
The other measures used in this study can be broadly divided into three groupings: (a) socio-demographic, (b) health-related, and (c) psychosocial and clinical. All socio-demographic data were collected at the baseline interview, and all health-related, psychosocial, and clinical data were collected at the most recent interview.
Socio-demographic Variables
A variety of socio-demographic variables were included: age, highest education level, personal income, occupational category, employment status, marital status, the presence of children, whether or not the respondent was Canadian born, race, Aboriginal status, and urban/rural residence. Unfortunately, due to small sample sizes in a number of racial groups, we could only include three racial categories: White, Black/African/Caribbean and Other/Mixed race.
Health-related Variables
Health-related variables consisted of health behaviours, HIV-specific measures, and general health status. The health behaviours measured were cigarette history, non-medical drug use in the last six months, and harmful alcohol use. The latter measure was based on the Alcohol Use Disorders Identification Test (AUDIT) (Allen, Litten, Fertig, & Babor, Reference Allen, Litten, Fertig and Babor1997; Saunders, Aasland, Babor, de la Fuente, & Grant, Reference Saunders, Aasland, Babor, de la Fuente and Grant1993). Those scoring eight or higher (out of a possible total of 40) were coded as engaging in harmful alcohol use. The total AUDIT scale had a Cronbach’s alpha of .80 in this study (n = 605). HIV-specific variables measured time since HIV-positive diagnosis in years, most recent CD4 test count, and whether or not viral load was detectable at the most recent interview. We obtained viral load and CD4 cells count data from the study sites through chart abstractions supplemented from the Ontario Agency for Health Protection and Promotion – an agency responsible for all HIV-related clinical testing in the province. Time since HIV diagnosis was computed by subtracting the date of initial HIV-positive test from the date of the baseline interview. We categorized recent CD4 counts into < 200, 200–499, and ≥ 500 cells/ml and viral load data into detectable (≥ 50 copies/ml) versus undetectable (< 50 copies/ml). Respondents were also asked whether or not they were originally from an HIV-endemic country. Finally, general health status was measured using the following question: “In general, would you say your health is excellent, very good, good, fair or poor?” Response options were recoded into two categories (excellent/very good/good and fair/poor).
Psychosocial and Clinical Variables
Standardized scales were used to assess the following psychosocial constructs: HIV stigma, health-related quality of life, social support, coping, mastery, and depression.
Stigma
A modified version of the HIV Stigma Scale was used to measure HIV-related stigma (Berger, Ferrans, & Lashley, Reference Berger, Ferrans and Lashley2001; Bunn, Solomon, Miller, & Forehand, Reference Bunn, Solomon, Miller and Forehand2007; Wright, Naar-King, Lam, Templin, & Frey, Reference Wright, Naar-King, Lam, Templin and Frey2007). This version includes 16 items evaluating four components of the experience of stigma: (1) Personalized Stigma (Enacted Stigma) asks about the consequences of others knowing about the person’s HIV status and is related to the experience of rejection; (2) Disclosure Concerns probes the need to control information and concealment of HIV-status; (3) Negative Self-image inquires about expressions of guilt and shame; and (4) Concern with Public Attitudes refers to what other people may think about people living with HIV. Each item was measured using a scale with five response categories ranging from “strongly disagree” to “strongly agree”. Total scores of each of the four subscales (range 4 to 20) were calculated by adding the item scores in the subscale if all items had valid responses. An overall Total HIV Stigma score (range 16 to 80) was calculated by adding the total scores of the four subscales, with higher scores indicating a higher degree of stigma. The original measure has been shown to have good reliability with alphas for the overall scale and all subscales above 0.90 and test-retest reliabilities of 0.87 or greater (Berger et al., Reference Berger, Ferrans and Lashley2001; Bunn et al., Reference Bunn, Solomon, Miller and Forehand2007). Emlet (Reference Emlet2007) found the original scale to have good reliability for all subscales and the summated scale in a sample of older adults. All alphas ranged from .92 to .96. It has also been shown to have adequate construct validity (Berger et al., Reference Berger, Ferrans and Lashley2001). The HIV-Stigma Scale had a Cronbach’s alpha of 0.90 in this study (n = 405).
Health-Related Quality of Life
The Medical Outcomes Study (MOS) SF-36 Health Survey measures self-reported health-related quality of life. The 36 items are combined to create eight health domains: (a) physical functioning, (b) role limitations due to physical health, (c) bodily pain, (d) general health perceptions, (e) vitality, (f) social functioning, (g) role limitations due to emotional problems, and (h) mental health. Scores range from 0 to 100 with higher scores indicating higher health-related quality of life within the domain (Ware et al., Reference Ware, Kosinski, Bjorner, Turner-Bowker, Gandek and Maruish2007). We computed both the Physical Component Score (PCS) and the Mental Component Score (MCS) following the developers’ instructions. The results of several studies support the reliability and validity of the SF-36 in HIV populations (Bing et al., Reference Bing, Hays, Jacobson, Chen, Gange and Kass2000; Hsiung, Fang, Chang, Chen, & Wang, Reference Hsiung, Fang, Chang, Chen and Wang2005; Riley, Bangsberg, Perry, Clark, Moss, & Wu, Reference Riley, Bangsberg, Perry, Clark, Moss and Wu2003).
Social Support
The MOS-HIV Social Support Survey has 19 items that evaluate the availability of emotional/informational, tangible, affectionate, and positive social interaction domains of social support (Sherbourne & Stewart, Reference Sherbourne and Stewart1991). Each item uses a scale with five response categories ranging from “none of the time” to “all of the time”. Total score of each of the four domains is computed by adding the scores of all items in the subscale if all items in the subscale had valid responses. An overall social support index (range 19 to 95) is obtained by adding scores for all 19 items. Higher scores indicate higher availability of social support from friends, family, and others. This overall index has shown to be reliable (with alpha > 0.90) with good convergent and discriminant validity (Sherbourne & Stewart, Reference Sherbourne and Stewart1991). In the current study, the Social Support Scale had a Cronbach’s alpha of 0.97 (n = 414).
Coping
The Brief COPE evaluates coping styles and includes 28 items grouped in 14 scales: (a) active coping, (b) planning, (c) positive reframing, (d) acceptance, (e) humour, (f) religion, (g) emotional support, (h) instrumental support, (i) self-distraction, (j) denial, (k) venting, (l) substance use, (m) behavioural disengagement, and (n) self-blame (Carver, Reference Carver1997). Each item uses a four-point scale indicating the level of engagement in that coping behaviour, ranging from “I have not been doing this at all” to “I have been doing this a lot”. The internal reliability of the measure has been shown to be adequate with good construct validity (Carver, Reference Carver1997). Adaptive coping can be calculated as the sum of scores for the first eight scales listed above and maladaptive coping for the remaining six scales (Meyer, Reference Meyer2001). Cronbach’s alphas for this study were 0.87 for adaptive coping (n = 436) and 0.77 for maladaptive coping (n = 446).
Mastery
Pearlin’s Mastery Scale includes seven items evaluating the sense of personal control over important life outcomes (Pearlin & Schooler, Reference Pearlin and Schooler1978). The items assess whether individuals feel they have control over what happens to them, the decisions they make, and whether they are able to deal effectively with problems. Here, each item was measured with a scale with four response categories ranging from “strongly agree” to “strongly disagree”. A summary score (range 7 to 28) was generated by adding these items with higher scores indicating higher levels of mastery. The scale has adequate construct validity and good reliability with all alphas above 0.74 (Adams, Smyth, & McClendon, Reference Adams, Smyth and McClendon2005; Pearlin, Lieberman, Menaghan, & Mullan, Reference Pearlin, Lieberman, Menaghan and Mullan1981; Schieman & Turner, Reference Schieman and Turner1998; Skaff, Pearlin, & Mullan, Reference Skaff, Pearlin and Mullan1996). In this study, the Pearlin’s Mastery Scale had a Cronbach’s alpha of 0.78 (n = 443).
Depression
The Center for Epidemiologic Studies Depression Scale (CES-D) includes 20 items evaluating the frequency of depressive symptoms over the past week (Radloff, Reference Radloff1977). Each item includes four response categories ranging from “rarely or none of the time (less than 1 day)” to “most or all of the time (5–7 days)”. The scale consists of six domains: (a) depressed mood, (b) feelings of guilt and worthlessness, (c) feelings of helplessness and hopelessness, (d) psychomotor retardation, (e) loss of appetite, and (f) sleep disturbance. Item scores were added together to create a summary score ranging from 0 to 60. Higher scores indicate a higher level of depressive symptoms. This measure has been shown to have high internal consistency, test-retest reliability and concurrent and construct validity (Knight, Williams, McGee, & Olaman, Reference Knight, Williams, McGee and Olaman1997; Radloff, Reference Radloff1977). The CES-D scale had a Cronbach’s alpha of 0.91 in this study (n = 445).
Analysis
The primary goal of the analyses was to describe a sample of older PHAs from Ontario and the secondary goal was to compare four sub-samples of older PHAs: Women, heterosexual men, homosexual men, and bisexual men. To do this, we undertook a series of descriptive analyses first describing the whole sample and then comparing across the four sub-groups. For categorical variables, we calculated frequencies and used chi-square tests to determine overall statistical significance. For continuous variables, means and standard deviations were calculated and statistical significance was established using ANOVA as an omnibus test and a priori orthogonal contrasts to determine differences between groups. In particular, three contrasts were allowed (df = 3) which compared women with men, women and heterosexual men with gay and bisexual men, and gay men with bisexual men. Homogeneity of variance across the groups was examined using the Levene’s test.
Results
Socio-demographics of Full Sample
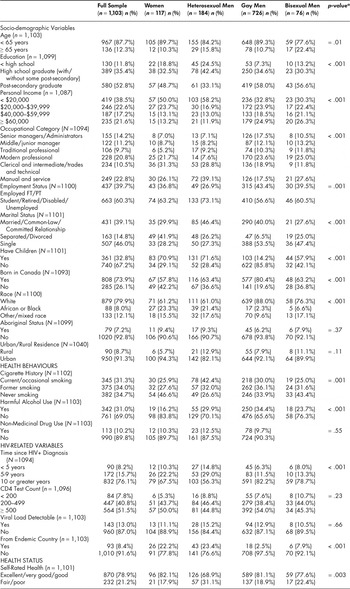
The majority of the 1,103 older adults living with HIV/AIDS identified as gay men (65.8%), followed by heterosexual men (16.7%), women (10.6%), and bisexual men (6.9%). The mean age was 57 years (SD = 6.2), and ranged from 50 to 86 years; the majority of the sample was under age 65 (87.7%). While more than half of the older PHAs sampled had a post-secondary education (52.8%), over a third reported a personal income of less than $20,000 annually, which may have reflected the fact that 60 per cent of all PHAs were retired, unemployed, or unable to work due to disability. Almost three quarters of all older PHAs were born in Canada, and just slightly more than that (79.9%) identified their race as White. About 7 per cent of the sample identified as Aboriginal (see Table 1 for a complete description of the socio-demographic characteristics of the sample).
Description of the full sample and comparison of sub-groups of older PHAs in Ontario (n = 1,103)

a p-value is based on a comparison of the four sub-groups and is derived from a chi square test. None of the expected frequencies were < 5.
Note:
Total numbers vary due to the missing data.
Comparison of Socio-demographics across Sub-groups
Table 1 also reveals interesting and important differences across the four selected sub-groups. For example, gay and bisexual men were more highly educated than were heterosexual men (p < .001). Similarly, gay and bisexual men had higher personal incomes compared to heterosexual men and women (p < .001).While a majority of those in all four groups were not employed, heterosexual men had the highest frequency of non-employment (73%) and gay men had the lowest (57%; p = .001). A larger proportion of gay men reported being born in Canada (80%) compared to heterosexual and bisexual men (both about 63%) and women (57.8%; p < .001). Also, a larger proportion of gay men identified themselves as White (88%) compared to bisexual men (76%) and heterosexual men and women (both 61%; p < .001). Over one fifth of each of the latter two groups identified as Black or African, and less than 10 per cent of each group identified as Aboriginal.
Health-related Profile of the Full Sample
Analysis of health-related factors showed that the sample of older PHAs was relatively healthy. The large majority of older adults were former smokers or non-smokers and did not engage in harmful drinking or use non-medicinal drugs. Moreover, while three quarters of the sample had been diagnosed with HIV/AIDS for more than 10 years, most had CD4 levels of 500 or over and undetectable viral loads. Finally, nearly 80 per cent of older adults rated their health as excellent or good.
Comparison of Health-related Profiles across Sub-groups
Comparison across groups revealed significant differences according to cigarette smoking history (p = .001) and harmful alcohol use (p < .001) (see Table 1). While heterosexual men comprised the largest proportion of regular or occasional smokers, gay men made up the largest proportion of harmful alcohol users. Women and bisexual men less frequently engaged in either health risk behaviours. The frequency of those with a long-time diagnosis also differed significantly across groups: a high of 82 per cent of gay men were diagnosed for 10 or more years compared to a low of 56 per cent for heterosexual men (p < .001). Nearly a quarter of women and heterosexual men were from an endemic country compared to 3 per cent and 8 per cent of gay and bisexual men respectively (p < .001). Women and gay men made up the largest proportion of those having self-rated excellent/good health, and heterosexual men comprised the smallest proportion (p = .003).
Comparison of Psychosocial and Clinical Profiles across Sub-groups
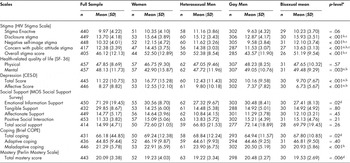
Table 2 provides the mean scores of the psychosocial and clinical scales assessed for the full sample. Note that these results are based on the “extended” sub-sample which only included three clinics from the Greater Toronto Area (n = 460). The post hoc contrasts revealed that gay men had a significantly lower total mean score on the HIV stigma scale compared to women, heterosexual, and bisexual men (p < .001). Gay men also had a significantly lower mean score on the Disclosure, Negative Self-image, and Concern with Public Attitude stigma subscales (each p < .001).
Mean scale scores in the full sample and comparison of mean scores across four sub-samples of older PHAs from three clinics in the Greater Toronto Area

* The p-level comparing four sub-samples was derived using a one-way ANOVA and F-test
a Post hoc tests showed significant difference between women and men
b Post hoc tests showed significant difference between women/heterosexual men and gay men/bisexual men
c Post hoc tests showed significant difference between gay men and bisexual men
d p-level was significant, but there were no contrasts between variables
SD = standard deviation
Gay and bisexual men had significantly higher mean scores in the mental health–related quality of life compared to heterosexual men and women (p = .003). Women reported the lowest mean scores in the mental health domain and had the highest mean scores for depression based on the total CES-D score, followed by heterosexual men, (p < .001). Gay men and women had higher mean levels of emotional-informational social support measured using the MOS social support scale compared to straight and bisexual men. Finally, gay and bisexual men had significantly lower mean maladaptive coping scores based on the brief COPE scale compared to women and heterosexual men (p < .001).
Discussion
The present study was undertaken to develop a better understanding of the socio-demographic features of a large cohort sample of older PHAs to assist in the development of relevant and useful practice, policy, and service delivery. AIDS service organizations (ASOs) and other agencies, programs, and health care settings for people living with HIV have been developed primarily with younger adults in mind. Such entities may need to modify existing programs or develop new ones that address the needs of older adults. Findings from this study suggest that there are significant differences between sub-populations of older PHAs. As those individuals who are living with HIV age, they will bring with them the diversity and realities of their cohort as well as cultures and ethnoracial identities.
Overall, older PHAs in this sample were largely gay and bisexual men with a significant minority of women and heterosexual men. The findings of this study suggest that gay and bisexual men are doing fairly well compared with their heterosexual counterparts. Gay and bisexual men were more educated, had higher incomes, and were more likely to be born in Canada than heterosexual participants. Gay men were more likely to be living with an HIV diagnosis 10 years or longer. Gay men and all women were more likely to report their health as excellent/good, when compared to bisexual and heterosexual men. Compared to other groups, heterosexual men were more likely to smoke, and gay men were more likely to report harmful drinking. Among the sample who answered the “extended” questionnaire items, gay men had lower scores on HIV stigma, disclosure stigma, negative self-image stigma, and concern with public attitude stigma. This study highlights that there were significant differences among participants in terms of mental health outcomes, but not overall physical health outcomes.
Compared to heterosexual men and women, gay and bisexual men reported higher overall scores in mental health quality of life, lower scores on depression, and lower scores on maladaptive coping. These differences could be the result of a number of factors. For instance, the poorer mental health outcomes of heterosexual men and women may have resulted, in part, from racial discrimination and/or acculturation stress given that a large proportion of these two groups are from endemic countries. Given that gay men were more likely to be living with HIV for more years, this could be the result of having more time to adjust to an HIV diagnosis and to develop support systems and mechanisms to assist in managing the complexities of living with HIV in later years. It may also be that since the epidemic was first seen in the West among gay and bisexual men, the programs and services designed for those living with HIV have been developed with that population in mind. These programs may be more attuned to the specific needs of gay and bisexual men, particularly younger gay and bisexual men, who may feel as though they have more supports.
Further research is required to better understand the reasons that gay and bisexual men are doing better in this realm. Research could examine how older heterosexual populations living with HIV access support services and what programs or policies could assist them in managing living with HIV. For example, Emlet (Reference Emlet2004) noted that in a sample of older adults living with HIV disease, respondents knew of and utilized services from the network of HIV services significantly more than aging services. Perhaps there are cultural, social, programmatic, and/or population-specific factors that are working well among gay and bisexual men and which can be enhanced or modified for older heterosexual populations.
Given the implications of this study along with others that highlight the needs of an aging population of those living with HIV (Elford, Ibrahim, Bukutu, & Anderson, Reference Elford, Ibrahim, Bukutu and Anderson2008), researchers are suggesting that new models of addressing the care needs of older adults living with HIV are needed. Chu and Selwyn (2011) have suggested that innovative primary care models which advance knowledge and skills in managing HIV among front-line care providers are essential given the growing population of those living with HIV. Additionally, there is a burgeoning discourse in the literature on the advanced and complicated co-morbidities of aging and HIV (Kirk & Goetz, Reference Kirk and Goetz2009). The current study showed no significant differences in physical health outcomes based on sub-populations. Physical health concerns may be more universal and require interdisciplinary models of care to address. Future research is needed to advance the application of comprehensive models of care for the needs of older adults living with HIV.
This study’s findings have some limitations. The cross-sectional study design limits the generalizability of these findings. Similar to the ROAH study (Karpiak et al., Reference Karpiak, Shippy and Cantor2006), our study did not use probability sampling, so the sample may have some selection bias. Unlike ROAH, our sample comprised mostly gay and bisexual men, as opposed to a largely heterosexual population. OCS data are collected primarily through medical clinics and not through community-based organizations. Thus, these data may represent the gay and bisexual men who are more connected to care, although, once again, our study cannot provide evidence to support that claim. Although specific information about the proportion of people aged 50 and older currently living with HIV in Ontario is not currently available, gay, bisexual, and other men who have sex with men continue to be the largest group acquiring HIV (PHAC, 2011). Additionally, individuals from HIV-endemic countries are under-represented in the sample (14% of PHAs in Ontario compared to 8% of this sample).
The outcomes from the extended survey (stigma, quality of life, depression, social support, coping, and mastery) were from clinics within Toronto where there is a large and thriving gay community as well as busy and active HIV community organizations. Thus, the fact that gay and bisexual men are doing well may be a result of the geographic context in which they live. Additionally, these specific findings may not be generalizable outside of the context of Toronto. Given the ongoing nature of the OCS, those who are diagnosed later are not likely to be represented in the sample, and those who are never diagnosed are not represented. Furthermore, the sample has a possibility of a survivor bias. It may be that the resiliency associated with longer-term survival also translates into greater well-being. Indeed, the gay men in the sample were more likely to have been diagnosed for a longer period of time than other sub-populations. The participants were interviewed regarding a great number of details about their lives and in fact, are asked to be interviewed annually. This may result in a self-selection bias whereby those who are interviewed are the ones most comfortable with discussing these details. Thus, they may not represent all older PHAs.
Because of small sample sizes, the analyses of sub-groups of women and racial groupings other than White and Black/African/Caribbean were limited; we therefore were not able to adequately assess the role of racial identity in the differences reported here. The category of Other/Mixed race should be interpreted with particular caution as this group is not likely homogeneous. However, they were not removed from the study as this group represents an important aspect of the socio-demographic characteristics of older PHAs in Ontario.
This article represents the first socio-demographic description of a large population of older PHAs living in Ontario. Given the growing numbers of older PHAs who may require specific programs and policies, our study provides a richer and contextualized description of the population above and beyond surveillance data. This study may be useful in the development of programs that address the specific needs of older PHAs, such as educational events for the population and their families, friends, and health and mental health caregivers. In addition, programs aimed at providing psychosocial supports may need to be directly targeted at this older population, particularly heterosexual men and women.
In terms of policy, this study highlights that training for professionals may be needed, given the inevitable increase in the number of PHAs who are growing older, and so this study may help to guide the development of such training programs. In addition, the surveillance data currently being collected and reported regarding older PHAs in Canada is significantly limited. The Public Health Agency of Canada classifies older persons by age in five-year groupings and all HIV reports as one group over the age of 50. The findings of this study illuminate a need to report more-specific ages of the growing, older-PHA population in order to better distinguish the specific needs of older PHAs.
Finally, this study suggests that further research is required to more fully understand the needs of older PHAs. Indeed, little information is still known about this population. Qualitative research methods could provide more of an in-depth understanding of the reasons that gay and bisexual men are doing well when compared to their heterosexual counterparts. Such analysis may also reveal if there are other factors influencing the health and well-being of older PHAs that are not currently being studied. New research could focus on the resiliencies of older PHAs and attempt to build a model that illustrates the complexities of living with HIV over the age of 50.