Implications
The routine practice for horse owners is to choose forage based on sensory properties as perceived by sight, touch and smell, but not based on nutritional values. This can lead to unbalanced rations causing decreased production, health problems and supplementary costs. The present study explored the relationship between sensory properties and the nutritional value of hay measured by biochemical analysis. Digestible energy (DE) of hays and some biochemical parameters (fibre, protein and non-fibre carbohydrate (NFC) content) could be discriminated using sensory analysis. Further research on this sensorial-biochemical relationship could enable building grids to evaluate DE of hays with an acceptable error.
Introduction
Forage is the foundation of all equine diets as it not only feeds the horse but also contributes to its welfare and health, milk production and growth, and even athletic performance (Julliand and Grimm, Reference Julliand and Grimm2017; Harris et al., Reference Harris, Ellis, Fradinho, Jansson, Julliand, Luthersson, Santos and Vervuert2017). Considering a daily forage intake of 10 kg dry matter (DM) for a 500 kg horse, a 2.0 MJ/kg DM delta would result in a total 20 MJ difference. This represents 30% of the daily energy requirement of a 500 kg horse at maintenance. Underfeeding or overfeeding horses can result in major health troubles and decreased production and athletic performance (Geor and Harris, Reference Geor and Harris2013; McGregor Argo, Reference McGregor Argo2013). It can also leads to significant additional dietary costs. Thus, being able to estimate the nutritional value of hay fed to horses is an essential issue for equine keepers.
The nutritional value of hay depends predominantly on its nutrient content, which varies greatly depending on many factors such as pasture botanical composition, maturity or management through fertilization, harvesting, or storage conditions (Bruinenberg et al., Reference Bruinenberg, Valk, Korevaar and Struik2002; Andueza et al., Reference Andueza, Rodrigues, Picard, Rossignol, Baumont, Cecato and Farruggia2016; Harris et al., Reference Harris, Ellis, Fradinho, Jansson, Julliand, Luthersson, Santos and Vervuert2017). When designing a ration, one should know the chemical composition of forages that governs their nutrient characteristics and thus their nutritional value (Van Soest, Reference Van Soest1965). This is why it is highly recommended to conduct forage analysis (Harris et al., Reference Harris, Ellis, Fradinho, Jansson, Julliand, Luthersson, Santos and Vervuert2017). However, most hays are currently sold without any accompanying chemical data and buyers rarely ask for forage analysis, as it is not always feasible or cost effective. The routine practice for horse owners is to choose forage based on its availability or on personal preference based on its ‘perceived’ nutritional value.
In an informal study carried out in France, 27 hay buyers (equine breeders, race trainers, owners and riding school managers) were interviewed on their forage buying habits. All of them reported that they took into account forage sensory characteristics as an indicator of nutritional quality, and colour and odour were the most often cited features. Among private owners, breeders and riding school managers none of the interviewees requested hay biochemical analysis. This was occasionally asked by four of the nine interviewed race trainers.
In the area of food, people often use visual cues such as colour or shape to predict taste and expected liking (Lyon et al., Reference Lyon, Francombe, Hasdell and Lawson1992; Spence, Reference Spence2015). For instance, the colour of apples generally correlates with sweetness, both evolving during ripening, which in turn implies sweet taste and higher energy content. In everyday life factual links among all sensory characteristics are learnt thought associative learning at repeated exposures (Verhagen and Engelen, Reference Verhagen and Engelen2006). Beyond sensory characteristics, food experiences shape food representations that also include affective (such as hedonic valence or quality judgements) and cognitive (related to semantic knowledge) dimensions (Sester et al., Reference Sester, Dacremont, Deroy and Valentin2013). Representations lead to expectations: when one feature of the representation, such as one aspect parameter, is detected, other features are activated and interfere with food perception (Shankar et al., Reference Shankar, Levitan and Spence2010). The same kind of mechanisms may be at play when equine keepers select hay. Based on their theoretical and experiential knowledge they might estimate hay nutritional value from sensory characteristics namely appearance, odour and texture. If horses’ owners use such cues to select hay, it could somehow rely on a link between sensory properties of the forage and its nutritional value. Hence, the objective of the present work was to explore the correlation between sensory properties as perceived by sight, touch and smell by untrained panellist and the nutritional value of hay measured by biochemical analysis. We assumed correlations between sensory properties and nutritional values of hay.
Material and methods
Sensory characteristics (appearance, smell and touch assessed by hand) of a large set of hays for the equine market were described using a ‘free sorting task’ method, followed by a description of the groups that were formed. This method is commonly used in food industry to get a fast description of a set of objects with untrained participants (Valentin et al., Reference Valentin, Chollet, Lelièvre and Abdi2012; Varela and Ares, Reference Varela and Ares2012). It provides a sensory map based on perceptive similarities: two hays similarly described will be located close to each other on the map and conversely, two hays described differently will be located far away from each other. During a second step, correlations between hays sensory characteristics and their nutritional values for horses were sought.
Samples collection
Twenty-one hays originating from 15 different administrative departments of France were collected during the ‘Salon du Cheval’ in Paris (Table 1). About 2 kg of each hay were randomly hand-sampled from one opened bale in 10 different locations of the bale. Samples were immediately stored in large trash bags after sampling.
Geographical provenance, pasture management, harvest and storage conditions of the 21 hays used for exploring the relationship between sensory properties and the nutritional values of hays fed to horses

UNM = unfertilized/unplanted natural meadow; AM = artificial meadow; MI = missing information.
a Little bales weighed less than 25 kg, large bales between 180 and 250 kg, extra-large bales over 400 kg.
Biochemical analysis
Five hundred grams of each hay were used for biochemical analysis. Samples were packed in hermetic plastic bags the day after collection. Dry matter content of hays was determined by drying at 60°C until constant weight. Hay samples were incinerated for 2 h at 600°C for determination of ash content following the AOAC International (2012) method (942.05). Crude proteins were determined by combustion measurement (AOAC 990.03) using a Leco FP-528 Nitrogen/Protein Analyzer (Leco Corporation, Saint-Joseph, MI, USA). Neutral-detergent fibres, ADF, ADL were assessed using Ankom fibre analyzer (Ankom Technology, Macedon, NY, USA) following van Soest (van Soest et al., Reference Van Soest, Robertson and Lewis1991) and AOAC 973.18 methods. Crude fat (CF) was measured by extraction using anhydrous diethyl ether with Soxtec System and residue determined gravimetrically after drying (AOAC 2003.05). Non-fibre carbohydrates were calculated as organic matter (OM)−(CP+CF+NDF). Calcium and phosphorus were analysed using a Thermo ICAP 6300 Inductively Coupled Plasma Radial Spectrometer after microwave digestion. Digestible energy was calculated from biochemical parameters (National Research Council (NRC), 2007).
Sensory analysis
Sensory analyses were performed the week after sample collection. During the 2 days of experiment, hay samples were replaced every half day.
Participants
Fifty-four participants (36 females and 18 males, aged from 19 to 56 years old) were recruited among students and staff members from Agrosup Dijon and University of Burgundy, France. All were volunteers. Among participants, 32 reported having some experience of cattle or horse feeding with hay. None of them were professional in the equine industry or trained for hay sensorial analysis.
Experimental method
All participants performed individually a free sorting task for each of the three modalities: appearance, odour and texture. The order of three modalities was counter balanced according to a Latin square design.
Hays were presented in different ways according to the sensory modality. For appearance description, about 100 g of hay were presented on white paper plates (diameter 260 mm) in a well lit room. Participants were instructed to observe the hays without smelling or touching them. For odour description, about 100 g of each hay were presented in glass jars (500 ml) closed by a glass cap, in a dim lighted room to minimize the influence of appearance on their judgment. Participants were instructed to open the jar and sniff inside, but they were not allowed to touch the hays. For texture description, about 200 g of hay were placed in cardboard boxes (310×280×220 mm) with an opening in the frontal side allowing participants to introduce their hand inside and touch the hay without seeing and smelling it.
The whole set of hays was presented in a randomized order and participants were asked to group the products according to their perceived similarities. All participants were orally informed with the same read sentences, and received written instructions too. Participants were required to: (1) observe all samples, (2) group similar samples together and (3) characterize each formed group with a maximum of five descriptive terms that could be single words (e.g. ‘green’, ‘soft’) or groups of words (‘lots of leaves’, ‘first cut’, ‘short fibres’). Participants were allowed to explore the samples as many times as necessary. They were free to form as many groups as they wanted, between 2 and 20.
Data analysis
For each modality, all generated terms were collected and grouped according to their semantic meaning. Consolidation of the descriptive terms was first performed independently by the five authors. Then, a discussion was undertaken to reach a consensus regarding the generated categories and their labels. For instance, descriptive terms like ‘appétent’, and ‘appétissant’, were grouped together under the same label ‘appétent’ which means palatable. The three successive steps followed to build the descriptive terms matrix of appearance are detailed in the Supplementary Material S1 and Supplementary Tables S1 to S3. The whole process was conducted in French by native speakers. For reading convenience, English translations are used though the manuscript.
All terms used by one participant to describe a group of hays were associated to each hay of the group she/he had made. It was hypothesized that all the hays forming a group shared similar perceptive characteristics. For each modality, results were recorded in a contingency matrix (hays × terms) where the number of occurrences of every descriptive term was reported for each hay (Cariou and Qannari, Reference Cariou and Qannari2018). It was assumed that terms mentioned by two different participants represented a similar sensation. Only terms cited at the minimum by five participants for at least one hay were kept for data analysis. A correspondence analysis (CA) was performed on the contingency matrix to plot both samples and descriptive terms on a χ 2 metric map (Cariou and Qannari, Reference Cariou and Qannari2018). Then, a Hierarchical Ascending Classification (HAC) was performed on the coordinates of samples in the CA space (Cariou and Qannari, Reference Cariou and Qannari2018). Analyses were performed with SPAD software (version 7). Clusters were identified by truncating the hierarchical tree-diagrams. The attributes that defined the best resulting clusters were identified by computing their probability of characterizing a cluster (Lebart et al., Reference Lebart, Morineau and Piron1995; Cariou and Qannari, Reference Cariou and Qannari2018). Correlations were computed between each biochemical parameter on one hand and the first two dimensions of the CA map on the other. Finally, correlations between the values of each hay on the first dimension of the three CA maps (appearance, odour and texture) were computed. The level of significance was set at P < 0.05.
Results
Biochemical analysis
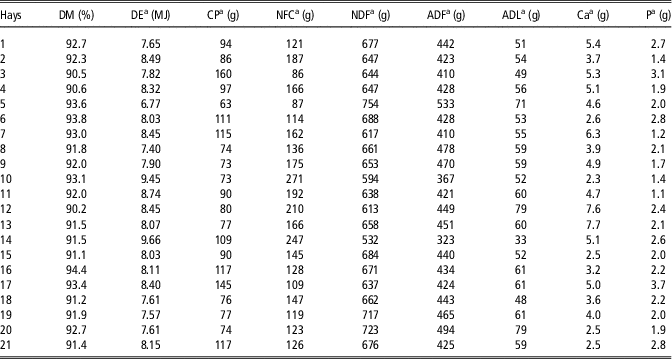
Results of biochemical analysis are detailed in Table 2. Nutritional values for DE ranged from 6.77 to 9.66 MJ/kg DM and CP from 63 to 160 g/kg DM. Hay number 5, which ranked as the lowest in terms of energy and protein values had the highest NDF and ADF and the lowest NFC. The two hays (numbers 10 and 14) presenting the highest energy value had the lowest NDF and ADF contents, and the highest NFC. The two hays (numbers 3 and 17) with the highest protein value also had the lowest NFC (with the exception of hay number 5).
Biochemical characteristics of the 21 hays used for exploring the relationship between sensory properties and the nutritional values of hays fed to horses

DM = dry matter; DE = digestible energy; NFC = non-fibre carbohydrate; Ca = calcium; P = phosphorus.
a Per kilogram DM.
Appearance description
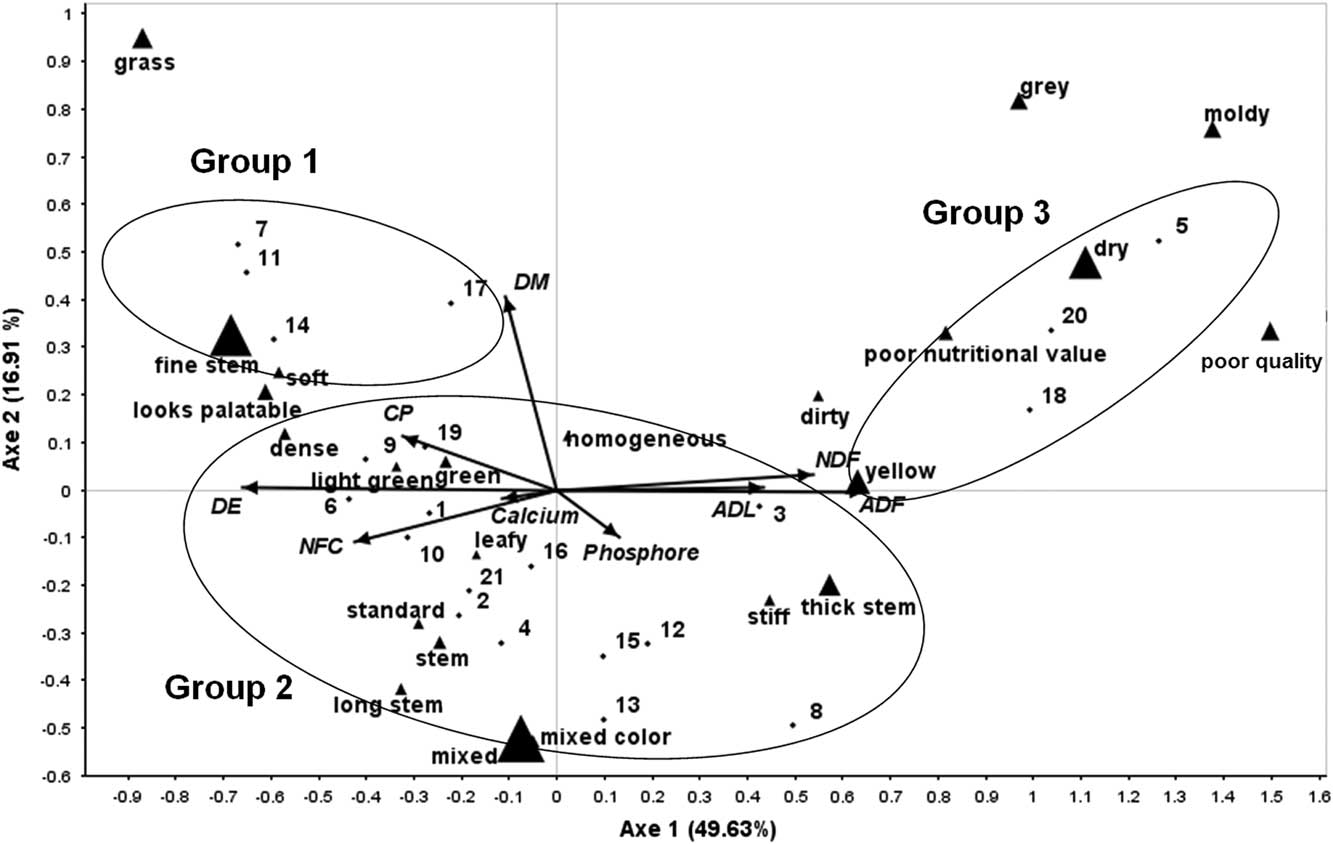
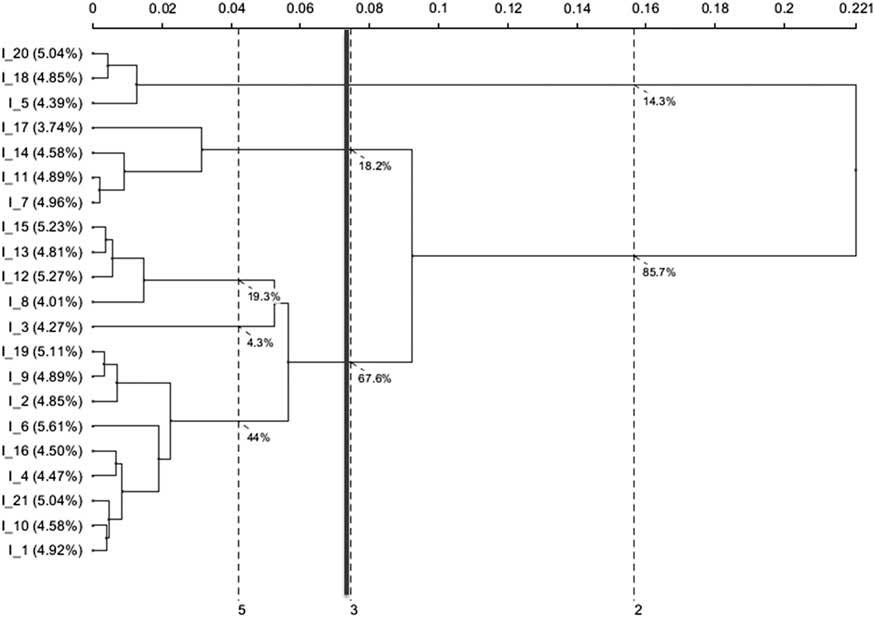
The first two dimensions of the CA map (Figure 1) explained about two-thirds of total variance (50% for the first dimension, 17% for the second). Based on the tree-diagram resulting from the HAC (Figure 2), we clustered three groups. Group 1 was composed of four hays described as ‘fine stems’, ‘grass’, ‘looks palatable’, ‘green’, ‘soft’ and ‘dense’. Group 2 included 14 hays described as ‘mixed’, ‘long stems’, ‘stems’, ‘mixed colour’ and ‘standard’. Group 3 was composed of three hays described as ‘dry’, ‘yellow’, ‘poor quality’, ‘moldy’, ‘poor nutritional value’, ‘thick stems’, ‘grey’, and ‘dirty’. The first dimension represented a quality dimension evolving from good (‘looks palatable’, ‘good nutritional value’) to poor (‘poor quality’, ‘poor nutritional value’, ‘moldy’), with mean quality (‘standard’) in intermediate position. On the CA appearance map DE, CP and ADF were significantly explained by the first two axes and NFC content tended to be (P = 0.085). Acid-detergent fibre value (P = 0.002), DE (P = 0.002), CP (P = 0.004) and NFC content (P = 0.038) were correlated to the first dimension. There was no significant correlation with the second dimension. Table 3 summarizes the nutritional values and biochemical contents of the three groups. Group 1 presented the highest values of DE (8.83±0.59 MJ/kg DM) and CP (115±25 g/kg DM), whereas group 3 had the lowest values (7.32±0.50 MJ/kg DM and 71±7 g/kg DM for DE and CP, respectively). Inversely, the lowest content of ADF was measured in hays from group 1 (395±48 g/kg DM), in opposition to group 3 that presented the highest ADF content (490±45 g/kg DM). Biochemical and nutritional values of hays from group 2 were all intermediate between groups 1 and 3.
Correspondence analysis map performed on the contingency matrix of terms given by the panelist for describing appearance of the 21 hays intended for horses. DE = digestible energy; DM = dry matter; NFC = non-fibre carbohydrate.

Tree-diagram resulting from the hierarchical correspondence analysis for aspect clustering of the 21 hays intended for horses.

Nutritional values and biochemical contents (means±SEM) of the groups of hays intended for horses formed through the Hierarchical Ascending Classification for the appearance, odour and texture modalities

DM = dry matter; DE = digestible energy; NFC = non-fibre carbohydrate; Ca = calcium; P = phosphorus.
a Per kilogram DM.
Odour description
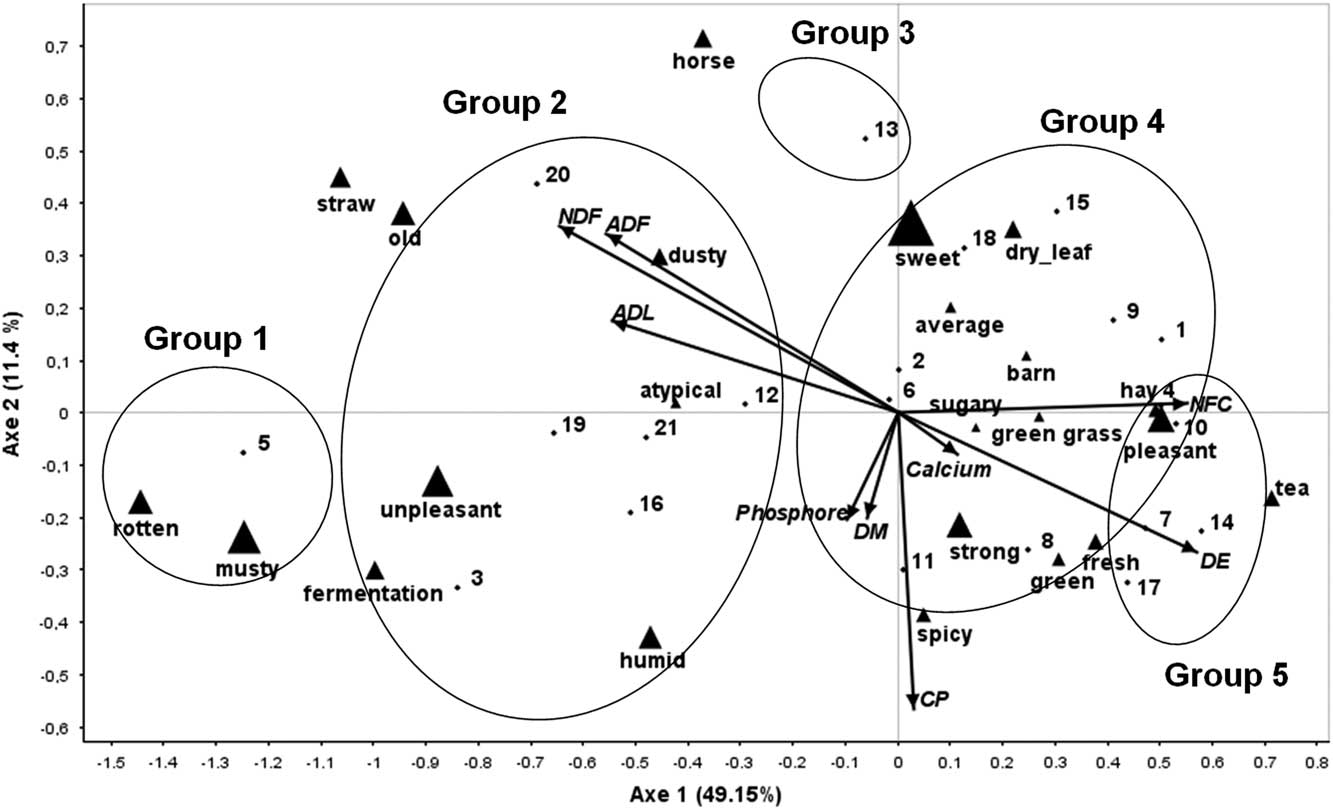
Sixty per cent of total variance (Figure 3) was explained by the first two dimensions (49% for the first dimension and 11% for the second). Based on the tree-diagram we performed using HAC, we partitioned into five groups (Supplementary Figure S1). The first group was composed of a single hay, described as ‘musty’ and ‘rotten’. Group 2 included six hays described as ‘unpleasant’, ‘fermentation’, ‘musty’, ‘rotten’, ‘old’ and ‘straw’. Group 3 included one hay that was described as ‘horse’. Group 4 was composed of nine hays described as ‘pleasant’, ‘tea’, ‘hay’, ‘fresh’, ‘strong’ and ‘green’. Group 5 included four hays described as ‘sweet’. The first dimension represented a hedonic dimension evolving from unpleasant quality (‘rotten’, ‘unpleasant’) to pleasant (‘hay’, ‘pleasant’). On the CA odour map, NDF and ADF were significantly explained by the first two axes and there was a tendency (P = 0.062) for DE. Neutral-detergent fibre, ADF and DE values were correlated (P < 0.001, P = 0.009 and P = 0.009, respectively) to the first dimension. Neutral-detergent fibre was also correlated (P = 0.028) to the second dimension. Group 1 presented the lowest value of DE (6.78 MJ/kg DM) and of CP (63 g/kg DM), whereas group 5 had the highest values of DE (8.70±0.63 MJ/kg DM) and CP (117±20 g/kg DM) (Table 3). Group 5 had the lowest NDF and ADF contents (608±52 g/kg DM and 396±49 g/kg DM, respectively). The single hay from group 1 had the highest NDF and ADF contents.
Correspondence analysis map performed on the contingency matrix of terms given by the panelist for describing odour of the 21 hays intended for horses. DE = digestible energy; DM = dry matter; NFC = non-fibre carbohydrate.

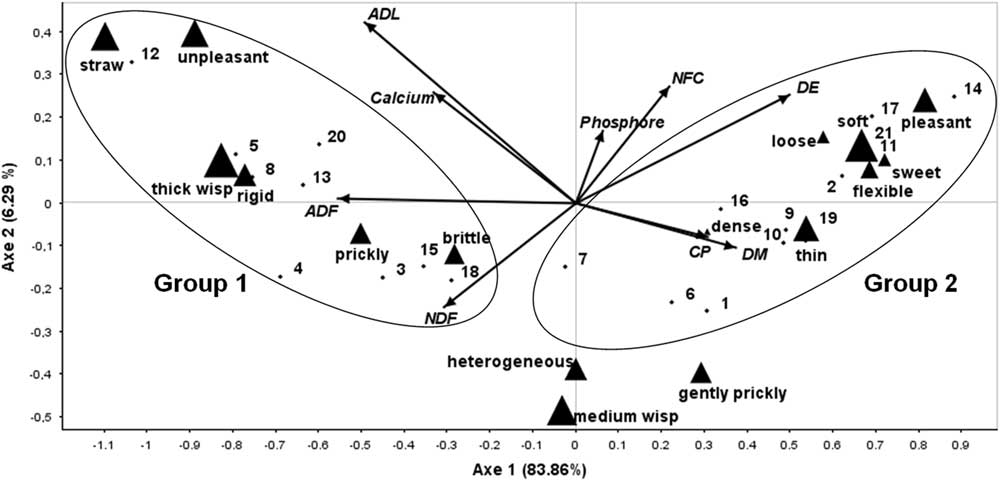
Texture description
Texture space was almost one-dimensional with the first dimension explaining 84% of total variance (Figure 4). It differentiated ‘rigid’ and ‘thick wisp’ from ‘soft’ and ‘thin’ texture. The first dimension was a hedonic dimension opposing ‘pleasant’ to ‘unpleasant’ textures. The tree-diagram resulting from the HAC highlighted two groups (Supplementary Figure S2). The first group was composed of nine hays described as ‘thin’, ‘soft’, ‘flexible’, ‘pleasant’, ‘sweet’, ‘loose’ and ‘gently prickly’ while the second group included 12 hays described as ‘thick wisp’, ‘rigid’, ‘prickly’, ‘straw’, ‘brittle’ and ‘unpleasant’. On the CA texture map, DE was significantly explained by the first two axis and ADF tended to be (P = 0.055). Digestible energy and ADF were significantly correlated (P = 0.008 and P = 0.011, respectively) to the first dimension. There was no significant correlation with the second dimension. Group 1 presented the lowest value of DE (7.78±0.50 MJ/kg DM) and of CP (88±29 g/kg DM), whereas group 2 had the highest values of DE (8.41±0.63 MJ/kg DM) and CP (101±22 g/kg DM) (Table 3).
Correspondence analysis map performed on the contingency matrix of terms given by the panelist for describing texture of the 21 hays intended for horses. DE = digestible energy; DM = dry matter; NFC = non-fibre carbohydrate.

Correlation between the first dimensions of the three CA maps Coordinates of the hays on the first dimension of CA maps were correlated between appearance and odour (P = 0.0085), and appearance and texture (P = 0.0006). There was no significant correlation between coordinates of the hays on the first dimensions of odour and texture CA maps.
Discussion
For the first time the free sorting task method was used to explore the link between perceived sensory properties and nutritional values of hays determined by biochemical analysis. For evaluating foods and beverages this approach is becoming part of the standard toolbox of sensory evaluation and is likely to be even more relevant as the field moves to rely more on untrained consumers (Valentin et al., Reference Valentin, Chollet, Nestrud and Abdi2018). In our study, we confirmed that this similarity-based approach was also well adapted for a panellist of non-experts evaluating animal feeds. Indeed, it was easily implemented with untrained participants who were able to discriminate hays according to their appearance, odour and texture. Moreover, the description of the formed groups of hays provided a convenient way to gain a description of the main differences among the set of samples, which corroborates previous observation (Chollet et al., Reference Chollet, Lelièvre, Abdi and Valentin2011). This methodology was also beneficial to identify the terms that were spontaneously used by participants, and thus that carry the highest communicative value in the field. Although participants were free to describe the hays through a multidimensional approach, results were mostly one-dimensional: good v. poor for appearance and pleasant v. unpleasant for odour and texture. These qualitative answers were in accordance with previous results, which reported that the hedonic dimension mainly controls the perceptive space of non-expert participants (Faye et al., Reference Faye, Brémaud, Teillet, Courcoux, Giboreau and Nicod2006). Hedonic descriptive terms were primarily used for describing odour and texture modalities. Even though they were also used for describing appearance, a greater variety was noticed. Participants spontaneously used visual cues referring to the hay colour (‘green’, ‘mixed colour’, ‘yellow’, ‘grey’), or its aspect (‘soft’, ‘dense’, ‘dry’, ‘fine stems’, ‘long stems’, ‘thick stems’). As the first dimension always yielded most of the global inertia (50% for appearance, 49% for odour and 84% for texture) it allowed large perceptive differences between groups on this dimension. Next dimensions carried very little additional information to discriminate hays.
The four hays (numbers 7, 11, 14 and 17) that were classified in all ‘good’ groups based on the appearance features were also given preferences based on their ‘pleasant’ texture and odour characteristics by all 54 participants. Reversely, the panellist repeatedly listed three hays (numbers 5, 18 and 20) in all ‘poor’ groups for their visual cues and concomitantly categorized them as ‘unpleasant’ for their odour and texture modalities. Interestingly our statistical analysis confirmed a global correlation between coordinates of the hays on the first dimension of CA appearance map with those of odour and texture maps. However, there was no significant correlation between coordinates of the hays on the first dimensions of odour and texture. Hence using sensory characteristics that discriminate hays in terms of odour and texture could help confirming a first visual impression.
The most notable information of the present study was the significant relationship we found between sensory properties and nutritional value of hay. Our data underlined indeed that the energy value of the 21 hays was strongly discriminated through appearance and texture evaluation and a trend was observed for odour. Using the free sorting task with the three tested modalities, participants were able to separate hays that had the highest DE content from those that had the lowest one. Based on sight, touch and smell perception, the hays with the highest DE values were qualified as ‘dark green’, ‘grass’, ‘fine stem’ (appearance), ‘thin’, ‘soft’, ‘flexible’ (texture), ‘tea’, ‘green’, ‘green grass’ (odour). In contrast, participants used the terms ‘yellow’, ‘dry’ (appearance), ‘thick wisps’, ‘rigid’, ‘prickly’ (texture), ‘straw’, ‘musty’, ‘rotten’ (odour) for hays with the lowest DE values. The terminology used by the participants appeared very relevant with respect to the plant cycle. ‘Dark green’ hay with ‘fine stems’ can indeed coincide with hay produced from an early meadow grass that generally has high DE value (Bruinenberg et al., Reference Bruinenberg, Valk, Korevaar and Struik2002; Andueza et al., Reference Andueza, Rodrigues, Picard, Rossignol, Baumont, Cecato and Farruggia2016; Harris et al., Reference Harris, Ellis, Fradinho, Jansson, Julliand, Luthersson, Santos and Vervuert2017). Likewise ‘yellow’, ‘dry’ and ‘thick stems’ are evocative of hay produced at later stages and having lower nutritive value as determined by biochemical analysis (Morrison, Reference Morrison1980; Harris et al., Reference Harris, Ellis, Fradinho, Jansson, Julliand, Luthersson, Santos and Vervuert2017).
Energy value of hays highly depends on its nutrient content and especially on key constituents of the cell-walls (cellulose, hemicellulose and lignin) (Bruinenberg et al., Reference Bruinenberg, Valk, Korevaar and Struik2002; Harris et al., Reference Harris, Ellis, Fradinho, Jansson, Julliand, Luthersson, Santos and Vervuert2017). In terms of biochemical composition, these key nutrients are characterized by NDF, ADF and ADL fractions (respectively 45% to 75%, 25% to 43% and 3% to 8% of DM in grass hays) (Agabriel, Reference Agabriel2007; NRC, 2007; Dairy One Forage Lab, 2018). Our data highlighted that NDF content was significantly correlated to sensorial characteristics for odour modality. Indeed participants used spontaneously the terms ‘unpleasant’, ‘musty’ or ‘old’ for describing hays with the highest NDF content, whereas they qualified hay with the lowest content as ‘pleasant’, ‘green’ or ‘fresh’. Similarly high ADF contents were associated to ‘dried’, ‘yellow’, ‘thick stems’ in terms of appearance perception, ‘straw’ and ‘musty’ for the odour modality, and ‘rigid’, ‘straw’ with ‘thick wisps’ regarding the texture perception. We did not notice any significant correlation between ADL content and sensory perception of hay. Our panellist of non-expert participants was also capable of discriminating hay NFC content based on smell. High NFC content was indeed associated to ‘hay’, ‘tea’ and ‘pleasant’ odours and was positively correlated to high-energy content. Meanwhile low NFC hays were described as ‘rotten’, ‘musty’, ‘old’ or unpleasant. In terms of nutritional values, the free sorting task method allowed observing a difference of DE values of 1.46, 1.92 and 0.63 MJ/kg DM in average between the extreme groups formed by our panellist for appearance, odour and texture modalities, respectively.
The protein value of hay is estimated by its CP content, which varies between 7% and 15% of the DM content based on Dairy One Forage Lab (2018). Crude protein content depends on the botanical composition, the stage of maturity at harvest and management factors like fertilizer applications, harvest techniques and storage conditions (Harris et al., Reference Harris, Ellis, Fradinho, Jansson, Julliand, Luthersson, Santos and Vervuert2017). The participants of our panel spontaneously used visual cues referring to the hay colour or aspect that discriminated the four hays containing the highest CP values (‘green’, ‘fine stems’, ‘grass’, ‘soft’ and ‘dense’) from the three hays having the lowest CP values (‘yellow’, ‘grey’, ‘thick stems’, ‘dry’, ‘mouldy’, ‘dirty’). As non-experts the participants did not naturally describe hays with terms related to either the presence/absence of legumes or botanical cycle that are known to impact protein content (Andueza et al., Reference Andueza, Rodrigues, Picard, Rossignol, Baumont, Cecato and Farruggia2016; Harris et al., Reference Harris, Ellis, Fradinho, Jansson, Julliand, Luthersson, Santos and Vervuert2017). Contrary to the appearance perception, hay protein content was not differentiated by smell and touch perception in our study.
In conclusion, although participants were not considered as experts on hay selection our work underscored, they could well discriminate DE value and ADF content of hays based on sight, smell and touch perception. To a lesser extent, NDF and CP content were distinguished through odour and appearance modalities, respectively. Further research on this sensorial–biochemical relation could enable building grids for evaluating energy content of hays. Prediction of other nutritional values from sensorial parameters could benefit from complementary observational analysis like botanical analysis. Holistic approaches (i.e. approaches that consider items as a whole) such as napping or categorization that are becoming increasingly popular in sensory analysis would probably be of interest for the future.
Acknowledgements
The authors acknowledge Alltech company for funding the biochemical analysis of hays and especially Dr Helen Warren for her support in English translations of descriptive terms. The authors also thank Olivia Parodi and Marie Orard for assistance in collecting the samples and organising the sensory tests. Finally, authors acknowledge all the participants.
Declaration of interest
The authors declare they have no actual or potential conflicts of interest that could inappropriately influence in this work.
Ethics statement
This work did not require validation by the Animal Care Committee.
Software and data repository resources
None of the data were deposited in an official repository.
Supplementary material
To view supplementary material for this article, please visit https://doi.org/10.1017/S1751731118003725