Implications
Starch is the main energy source for monogastric species and knowledge about its digestive behaviour can be important in order to understand the consequently metabolic and endocrine functioning in monogastrics. This study showed that diets formulated with heterogeneous sources of starch and characterized by a wide range in enzymatic starch digestion potential modulated the postprandial glucose response in pigs. A better understanding of the nutritive role of starch and its effect on metabolism is an important nutritional topic for monogastric animals.
Introduction
Starch is the major energy and glucose source in pig diets and its structure, along with the shape and dimension of starch granules, particle size, protein and lipid matrices and the processing method, can have a strong effect on the rate and extent of digestion and on physiological responses (Sun et al., Reference Sun, Lærke, Jørgensen and Bach Knudsen2006; Bach Knudsen, Reference Bach Knudsen2011). The kinetics of starch digestion are an emerging issue in swine nutrition (Menoyo et al., Reference Menoyo, Serrano, Barrios, Valencia, Lázaro, Argente and Mateos2011), because of their implications for productive performance (Mateos et al., Reference Mateos, Martin, Latorre, Vicente and Lázaro2007), nutrient digestibility (Vicente et al., Reference Vicente, Valencia, Pérez-Serrano, Lázaro and Mateos2008), metabolism of amino acids (Li et al., Reference Li, Dai, Yin, Zhang, Huang, Ruan, Deng and Xie2008), feed intake (van Kempen et al., Reference van Kempen, Pujol, Tibble and Balfagon2007), carcass composition (Bach Knudsen, Reference Bach Knudsen2011) and physiological responses (Regmi et al., Reference Regmi, van Kempen, Matte and Zijlstra2011).
Although the effect of different starch sources with various physicochemical characteristics (such as starch structure, amylose content, resistant starch content (RS) and degree of gelatinization) on postprandial blood glucose appearance and physiological responses has been reported both for humans (Englyst et al., Reference Englyst, Veenstra and Hudson1996) and pigs (Li et al., Reference Li, Dai, Yin, Zhang, Huang, Ruan, Deng and Xie2008; van Kempen et al., Reference van Kempen, Regmi, Matte and Zijlstra2010), their contribution in the kinetics of the in vivo postprandial glucose response is not clearly understood. In particular, in vivo responses are not always consistent (Regmi et al., Reference Regmi, van Kempen, Matte and Zijlstra2011), and results may vary considerably because of the confounding effect of nutrients other than starch or when the range of digestibility is not sufficiently wide (Noah et al., Reference Noah, Krempf, Lecannu, Maugére and Champ2000; Regmi et al., Reference Regmi, Matte, van Kempen and Zijlstra2010).
The glycemic index (GI) has initially been introduced to classify human starchy foods on the basis of their incremental postprandial blood glucose response after an equal-carbohydrate meal (Jenkins et al., Reference Jenkins, Wolever, Taylor, Barker, Fielden and Baldwin1981; Parada and Aguilera, Reference Parada and Aguilera2011) and it is currently widely adopted (Ludwig, Reference Ludwig2002; Monro and Mishra, Reference Monro and Mishra2010). Recently, Menoyo et al. (Reference Menoyo, Serrano, Barrios, Valencia, Lázaro, Argente and Mateos2011) introduced the concept of GI also for pig nutrition by ranking cereals on the basis of low and high GI. In their study, the authors reported that cereals with high GI led to an increased insulin response over time, which in turn resulted in a numeric increase in feed intake (+3.6%).
One of the approaches commonly used to estimate the in vivo GI response is through a hydrolysis index (HI) calculated from in vitro enzymatic starch digestion curves (Goñi et al., Reference Goñi, Garcia-Alonso and Saura-Calixto1997). Although numerous studies have confirmed both the role that various starch sources play on in vivo GI (Parada and Aguilera, Reference Parada and Aguilera2011) and the relationship between HI and GI for humans (Björck et al., Reference Björck, Liljeberg and Ostman2000; Araya et al., Reference Araya, Contreras, Alviña, Vera and Pak2002; Garsetti et al., Reference Garsetti, Vinoy, Lang, Holt, Loyer and Brand-Miller2005), limited information is currently available for pigs. Furthermore, to overcome the expense and difficulty of the in vivo analysis, an in vitro prediction of the GI for pigs, based on the released glucose throughout time after an enzymatic digestion, could be considered as a promising alternative to animal trials.
Therefore, five sources of dietary starch were used to test the hypothesis that diets containing starch with a wide range in starch degradation kinetics estimated by an HI approach could influence the postprandial glucose response in pigs. The HI approach was used as a link between the physicochemical properties of starch from diets and the in vivo responses.
The objectives of the study were to determine: (i) the incremental postprandial plasma glucose response in jugular-catheterized pigs fed diets containing starch with a wide range in in vitro digestion patterns; (ii) the in vivo GI values to the same diets in jugular-catheterized pigs; (iii) the possible relationship between in vitro HI and in vivo GI data.
Material and methods
Dietary treatments and preparation of the experimental diets
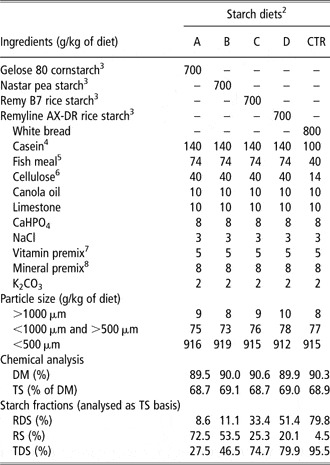
Purified Gelose 80 corn starch (Penford Food Ingredients, Centennial, Co, USA), purified Nastar pea starch (Cosucra Group Warconing, Warconing, Belgium), purified Remy B7 rice starch, purified Remyline AX-DR rice starch (Remy Industries, Leuven–Wijgmaal, Belgium) and milled white bread (purchased from a local commercial market), selected to cover a wide range of starch degradation kinetics, were used as the major source of carbohydrates for the formulation of five test starch diets (diet A, B, C, D and corresponding area for the reference diet (CTR), respectively). Using a 30 kg capacity twin-screw experimental mixer, five batches of about 15 kg per diet were prepared by mixing all the ingredients in the proportions reported in Table 1. The nutrient composition of the diets containing the five sources of starch met NRC requirements (Nutrient requirements for swine (NRC), 1998). The experimental diets were characterized for particle partition in agreement with the method reported by the American Society of Agricultural Engineers (ASAE, 1985). Briefly, 100 g of sample was sieved for 10 min by manual shaking and the residue retained over 1000 and 500 μm square diameter opening sieves was then measured.
Ingredient compositions, particle sizeFootnote 1, chemical analysisFootnote 1 and starch fractionsFootnote 1 of the five experimental diets

CTR = corresponding area for the reference diet; DM = dry matter; TS = total starch; RDS = rapidly digestible starch; RS = resistant starch; TDS = total digestible starch.
1 Values are means, n = 5.
2 Calculated digestible energy (Noblet et al., Reference Noblet, Bontems and Tran2003): 14.8, 14.8, 14.8, 14.8 and 14.9 MJ/kg for diets A, B, C, D and CTR, respectively.
3 Amylose content (as percentage of DM): 64.1%, 26.8%, 18.6% and 3.1% for Gelose 80 cornstarch, Nastar pea starch, Remy B7 rice starch and Remyline AX-DR rice starch, respectively.
4 Calcium caseinate (American Casein Company, Burlington, NY, USA).
5 Menhaden fish meal (Omega Protein, Hammond, LA, USA).
6 Solka-floc (International Fiber Corp., North Tonawanda, NY, USA).
7 Provided per kg of diet: retinol, 2.5 mg; cholecalciferol, 20.6 μg; α-tocopherol, 2.7 μg; niacin, 35 mg; D-pantothenic acid, 15 mg; riboflavin, 5 mg; menadione, 4 mg; folic acid, 2 mg; thiamine, 1 mg; D-biotin, 0.2 mg; vitamin B-12, 0.05 mg.
8 Provided per kg of diet: Zn, 100 mg as ZnSO4; Fe, 80 mg as FeSO4; Cu, 50 mg as CuSO4; Mn, 25 mg as MnSO4; I, 0.5 mg as Ca(IO3)2; Se, 0.1 mg as Na2SeO3.
Chemical analysis of purified starches and diets
Before inclusions in the experimental diets, purified starches were analysed for their amylose content using a Megazyme amylose/amylopectin assay kit (Megazyme Int. Bray, Ireland). Dried diets were ground through a 1-mm screen using a laboratory mill (Retsch grinder; model ZM1; Brinkman Instruments, Rexdale, Ontario, Canada) and stored until analysis. The samples were analysed for dry matter (DM; method 930.15 Association of Official Analytical Chemistry (AOAC), 2000) and for total starch content (TS) using an enzymatic method (Blasel et al., Reference Blasel, Hoffman and Shaver2006) modified according to the procedure described by Masoero et al. (Reference Masoero, Gallo, Zanfi, Giuberti and Spanghero2010).
In vitro study
Two distinct evaluations were conducted to completely characterize the in vitro starch digestion potential of the five starch diets. Starch from each prepared diet was first characterized as RDS (rapidly digestible starch; as a percentage of TS), RS (as a percentage of TS) and total digestible starch (TDS, 100 − RS, as a percentage of TS) according to the procedure described by Englyst et al. (Reference Englyst, Veenstra and Hudson1996).
Subsequently, each diet was also characterized for its time-course starch digestion potential with a multi-enzymatic assay that mimics the digestive processes in the gastrointestinal tract of pigs, proposed by van Kempen et al. (Reference van Kempen, Regmi, Matte and Zijlstra2010) based on the in vitro technique initially described by Englyst et al. (Reference Englyst, Kingman and Cummings1992). The enzymes used were: pepsin from Sigma (Sigma-Aldrich Co., Milan, Italy) (catalogue no. P-7000), pancreatin from Merck (Merck KGaA, Darmstadt, Germany) (catalogue no. 7133), amyloglucosidase from Sigma (catalogue no. A-7095) and invertase from Sigma (catalogue no. I-4504). In particular, to properly characterize the starch digestion rate, time points at which subsamples were taken for glucose analysis were 0, 15, 30, 60, 90, 120 and 180 min after incubation. The amount of glucose for each time interval was determined colorimetrically with a glucose oxidase kit (GODPOD; glucose SL reference 4058, Giesse Diagnostic SNC, Rome, Italy).
Using the data obtained from the multi-enzymatic in vitro assay up to 180 min, an in vitro digestion coefficient of starch for each time interval (DCt, as a percentage of TS) was calculated by the following equation:

using a factor of 0.9 to convert monosaccharides to polysaccharides (Stevnebø et al., Reference Stevnebø, Sahlström and Svihus2006).
To describe the kinetics of starch digestion, a modified first-order kinetic model (Mahasukhonthachat et al., Reference Mahasukhonthachat, Sopade and Gidley2010) was applied with time expressed in minutes and digested starch expressed as a percentage of TS. The model used is shown in equation (1):

where DCt corresponds to the in vitro digestion coefficient of starch at time t, DC0 is the in vitro digestion coefficient at 0 min, DC∞ is the in vitro digestion coefficient after 180 min, k is the digestion rate (min−1) and t is the chosen time.
Areas under the in vitro digestion curves (AUC) were calculated using equation (3) proposed by Mahasukhonthachat et al. (Reference Mahasukhonthachat, Sopade and Gidley2010) and an HI was then derived from the ratio between the AUC for each purified starch diet and CTR expressed as a percentage (Goñi et al., Reference Goñi, Garcia-Alonso and Saura-Calixto1997). Diets were considered to range from a very low to a very high in vitro digestion potential based on the in vitro obtained HI values.
In vivo study
The study was conducted in accordance with the European Community (EC) Council Directive guidelines for animals used for experimental and other scientific purposes (EC, 1986).
Five female pigs (average initial body weight 35.3 ± 1.1 kg; mean ± s.e.), housed individually in stainless steel metabolism crates in a temperature-controlled room (from 23°C to 26°C), were fitted with an indwelling jugular vein catheter (Deng et al., Reference Deng, Wu, Bin, Li, Huang, Liu, Liu, Ruan, Deng, Hou and Yin2010), which was carried out as described by Li et al. (Reference Li, Dai, Yin, Zhang, Huang, Ruan, Deng and Xie2008). Only five pigs were used because of difficulties related to animal management. After recovery, pigs were fed one of the five diets in a 5 × 5 Latin square design. Feed intake was adjusted for individual pigs at the start of each experimental period to 2.6 times maintenance energy requirement (NRC, 1998) and feed was provided twice daily in two equal meals at 0800 and 2000 h, with water available at all times. Each experimental period consisted of 6 days: 4 days of adaptation and 2 days of blood collection, where day 5 was used for the evaluation of the incremental glucose appearance, whereas day 6 was used for the in vivo GI determination. Specifically, on day 5, jugular venous blood samples were collected before the meal and at 15, 30, 60, 90, 120, 240 and 480 min postprandially. Subsequently, at the end of the blood sampling procedures, animals were deprived of food overnight and then, on day 6 at 0800 h, they were fed an amount of their starch diet to obtain an ingestion of 50 g of TS. Pigs were sampled in the fasting state and at 15, 30, 60, 90, 120 and 180 min after feeding, and at the end of the sample collection procedures, they were fed the residual part of their daily meal.
Plasma from all the collected blood samples was analysed for glucose (intra- and inter-assay CV ⩽ 2.0; glucose oxidase kit, Diagnostics Chemicals Ltd, Charlottettown, Canada).
The GI for each diet per period was then calculated by expressing the incremental area under the glucose response curve (IAUC) for each purified starch diet (i.e. A, B, C and D) as a percentage of CTR (Wolever et al., Reference Wolever, Jenkins, Jenkins and Josse1991). These values were then compared with the previously calculated in vitro HI.
Statistical analysis
Data were tested for normality using the Shapiro–Wilk test. In vitro kinetics parameters (DC0, DC∞ and k) and HI were analysed as a completely randomized design by using the GLM procedure of the SAS (Statistical Analytical System; 2003) according to the following model:

where Yij = observations; μ = overall mean; Di = effect of starchy diet (i = 1 to 5); and eij = residual error. The experimental unit was the batch.
In vivo data were analysed as a standard 5 × 5 Latin Square design by using the GLM procedure of SAS (2003) according to the model described below:

where Yijkl = observations; μ = overall mean; Di = effect of starchy diet (i = 1 to 5); Pj = effect of period (j = 1 to 5); Sk = effect of subject (k = 1 to 5); and eijkl = residual error. The experimental unit was the pig.
The least square means were compared by using LSMEANS statement of SAS (2003) and significance was declared at P < 0.05. The relationship between in vitro HI and in vivo GI was determined by using the REG procedure of SAS (2003).
Results
Chemical composition, starch chemistry and HIs of diets
The batches prepared for each experimental diet (i.e. 5 batches/diet) could be considered homogeneous, the within-diet variance being lower than 3.0% of total variance (i.e. 0.3%, 2.1%, 2.8% and 0.6% for DC0, DC∞, k and HI, respectively). In addition, the DM and TS contents and particle size partition could be considered similar for the five experimental diets, as shown in Table 1.
The different starch characteristics between diets were confirmed by the wide range in RDS, RS and TDS fractions (expressed on a TS basis), ranging from 8.6% to 79.8%, from 72.5% to 4.5% and from 27.5% to 95.5% for diet A and CTR, respectively (Table 1).
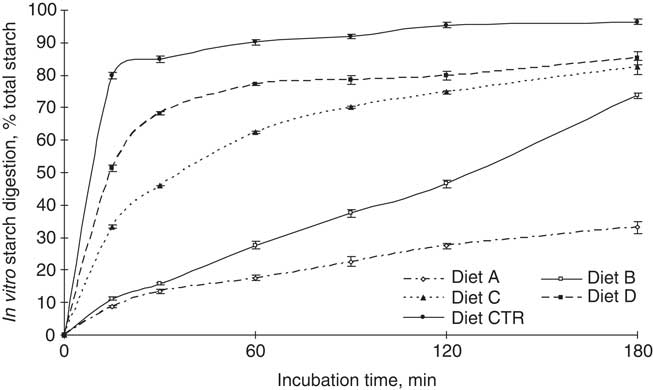
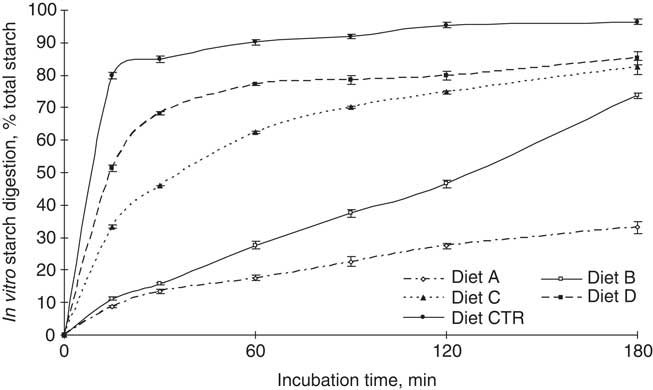
Wide between-diets variations for the in vitro starch digestion curves were observed (Figure 1). Specifically, across starch diets, diet A was digested slowly, showing the lowest DC at all time intervals, whereas diet CTR was digested faster and to a higher extent for the entire incubation period.
Effect of the five experimental diets on the time course of in vitro starch digestion. Values are means (n = 5 ± s.e.). CTR = corresponding area for the reference diet.
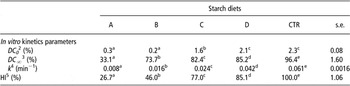
In addition, diets influenced all the in vitro kinetic parameters (i.e. DC0, DC∞ and k) and the HI values calculated from the hydrolysis curves (Table 2). In particular, different DC0 (ranging from 0.2% to 2.3% of TS), DC∞ (from 33.1% to 96.4% of TS) and k (from 0.008 to 0.061 min−1) values were recorded (P < 0.05). Lastly, on the basis of the HI, a distinction can be made between very low (i.e. A; HI = 26.7%), low (i.e. B; HI = 46.0%), moderate (i.e. C; HI = 77.0%), high (i.e. D; HI = 85.1%) and very high (i.e. CTR; HI = 100.0%) starch degradable diets (P < 0.05).
In vitro kinetic parametersFootnote 1 and hydrolysis indexFootnote 1 of the five experimental diets

CTR = corresponding area for the reference diet; DC0 = in vitro digestion coefficient of starch at 0 min; DC∞ = in vitro digestion coefficient of starch after 180 min; k = digestion rate; HI = hydrolysis index.
a,b,c,d,e Means in the same line with different letters differ at P < 0.05.
1 Values are means, n = 5.
2 DC0 (as a total starch basis).
3 DC∞ (as a total starch basis).
4 Rate of starch digestion.
5 HI calculated by using diet CTR as reference meal.
Incremental postprandial plasma glucose appearance and GI
Feed refusal and vomit events were not observed and all starch diets were promptly consumed by pigs within about 15 min after meal administration. Moreover, all pigs were healthy during the experiment as observed by normal appetite and growth, and no difference in basal jugular plasma glucose concentration was observed between diets (with an average value of 72.4 ± 2.2 mg/dl; P > 0.05).
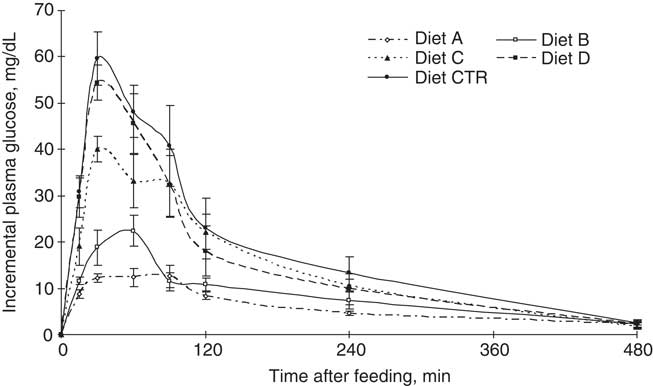
Overall, the ranking of incremental plasma glucose concentration, as a consequence of feeding the five tested diets formulated with different sources of starch, was consistent for almost the entire postprandial period among diets. In particular, the glucose response differed among diets (P < 0.05), with marked differences observed between 15 and 120 min postprandial (Figure 2).
Effect of the five experimental diets on the incremental postprandial plasma glucose concentration in jugular-catheterized pigs. Values are means (n = 5 ± s.e.). CTR = corresponding area for the reference diet.
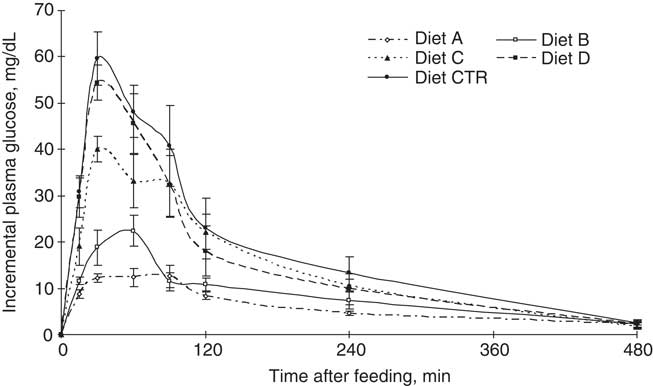
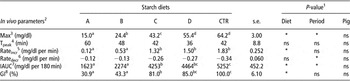
On average, plasma glucose peaked at approximately 46 ± 9 min postprandial at a maximal concentration that was higher for diets D and CTR when compared with diets A, B and C (55.4 and 64.2 mg/dl v. 15.0, 24.4 and 43.2 mg/dl, respectively; P < 0.05) (Table 3).
Effect of diets containing starches with varying in vitro degradation potential on in vivo parameters in jugular catheterized pigs

CTR = corresponding area for the reference diet; IAUC = incremental area under the glucose response curve; GI = glycemic index.
a,b,c,dMeans in the same line with different letters differ at P < 0.05.
1Statistical significance of effects of diet, period and pig are indicated: ns = not significant; *P < 0.05. 2Values are means, n = 5.
3Maximal plasma glucose concentration.
4Peak time.
5Rate of plasma glucose increment.
6Rate of plasma glucose decrement.
7IAUC obtained by feeding to pigs a portion of 50 g of total starch from each test diet.
8GI calculated by using diet CTR as reference meal.
Moreover, diets A and B elicited the lowest rate of plasma glucose increment (rateincr: 0.12 and 0.53 mg/dl per min v. 1.32, 1.50 and 1.83 mg/dl per min) when compared with diets C, D and CTR, respectively (P < 0.05), whereas no difference was recorded for the rate of plasma glucose decrement (ratedecr; P > 0.05).
The IAUCs after consumption of the same amount of TS differ (P < 0.05) between starch diets (ranging from 1623 to 5252 mg/dl per 180 min) and experimental periods (ranging from 3341 to 6623 mg/dl per 180 min). Lastly, the lowest GI values for diets A and B were recorded (30.9% and 43.3%) when compared with diets C, D and CTR (81.0%, 85.0% and 100.0%, respectively; P < 0.05) without the effect of period (P > 0.05) (Table 2).
Relationship between in vitro hydrolysis and in vivo GIs
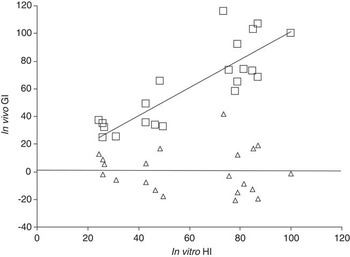
The relationship between the in vitro HI and in vivo GI showed a high coefficient of determination (R 2= 0.95; root mean square error (RMSE) = 15.8; P < 0.05). The intercept was not significant; consequently, it was not retained in the regression analysis. As a result, the in vivo GI values can be predicted by the following linear regression equation (equation 2; Figure 3):

Plot of observed (□) and residuals (Δ) for in vitro HI (%; X-axis) v. in vivo GI (%; Y-axis) data (GI = 1.013 x HI; R 2= 0.95; RMSE = 15.8; P < 0.05). HI = hydrolysis index; GI = glycemic index.

Discussion
This study evaluated the effect of five sources of dietary starch characterized by a wide range of HI values in jugular-catheterized pigs. Generally, heterogeneous starch types from different sources are considered to have a strong impact on the rate and extent of in vivo glucose response (Regmi et al., Reference Regmi, Matte, van Kempen and Zijlstra2010), even if misleading results were reported (Thorne et al., Reference Thorne, Thompson and Jenkins1983; Annison and Topping, Reference Annison and Topping1994; Noah et al., Reference Noah, Krempf, Lecannu, Maugére and Champ2000), probably because of the confounding effects of starch-associated compounds (such as fat, fibre, protein and/or anti-enzymatic complexes; Parada and Aguilera, Reference Parada and Aguilera2011) or because of experimental conditions (observation of the glucose response in peripheral circulation v. portal circulation or different coverage of in vivo postprandial duration) (Regmi et al., Reference Regmi, van Kempen, Matte and Zijlstra2011). As a consequence, additional information is currently warranted.
Moreover, in animal nutrition, there is presently a need for quick and reliable in vitro techniques, as an alternative to more expensive in vivo methodologies, for assessing the enzymatic degradation potential of dietary starches that may reflect the in vivo glucose responses. For this purpose, the separation of starch into different digestible fractions by enzymatic analysis (i.e. RDS, slowly digestible starch (SDS) and RS) has been proposed (Englyst et al., Reference Englyst, Kingman and Cummings1992). However, because of the analysis of single-point measurements and the coverage of limited time (120 min) foreseen by this in vitro assay, whether these fractions accurately reveal the full digestion profile and may adequately estimate the in vivo response is controversial (Dona et al., Reference Dona, Pages, Gilbert and Kuchel2010; van Kempen et al., Reference van Kempen, Regmi, Matte and Zijlstra2010).
Consequently, we addressed these issues using three different approaches. First, the digestion profile of the five test diets was characterized in depth with an HI approach through an extended time-course enzymatic digestion up to 180 min, where digestion parameters can be estimated to better understand the digestion process. Second, purified starches were selected in order to avoid possible confounding effects of starch-associated compounds, whereas white bread was selected as the reference starch source (Goñi et al., Reference Goñi, Garcia-Alonso and Saura-Calixto1997). Third, the in vivo responses were observed up to 480 min, because a major proportion of starch digestion can take place after 120 min postprandial (van Kempen et al., Reference van Kempen, Regmi, Matte and Zijlstra2010). Lastly, no data are currently available on the direct measure of GI in jugular-catheterized pigs.
In vitro enzymatic assessments and HI of starch diets
To appropriately characterize the starch digestion profile, we ran an extended version of the method initially proposed by Englyst et al. (Reference Englyst, Kingman and Cummings1992), characterized by seven incubations up to 180 min. Moreover, as a good estimation of the in vitro starch digestion potential requires sufficient measurements, especially during the first 60 min (Weurding et al., Reference Weurding, Veldman, Venn, van der Aar and Verstegen2001), four subsamples during the first hour were collected.
The ranking of the five test diets based on in vitro starch digestion agreed with their starch composition, in line with previous findings (van Kempen et al., Reference van Kempen, Regmi, Matte and Zijlstra2010). The rate and extent of starch degradation depends on its botanical origin (Gallant et al., Reference Gallant, Bouchet, Buleon and Perez1992), thus influencing the amylose : amylopectin ratio (Svihus et al., Reference Svihus, Uhlen and Harstad2005) and also the structural characteristic of the starch granule (Anguita et al., Reference Anguita, Gasa, Martín-Orúe and Pérez2006). In particular, purified starches used in the diet formulation contained a wide range of amylose content (ranging from 3.1% to 64.1% of DM for AX-DR rice and for Gelose 80 corn starch, respectively; Table 1). In general, the degradability of raw starches is inversely proportional to their amylose content (Svihus et al., Reference Svihus, Uhlen and Harstad2005) because of decreased enzyme accessibility to the molecule (Tester et al., Reference Tester, Qi and Karkalas2006). Moreover, rice starch is expected to be more available to enzyme action than corn or pea starches, because of the smaller size of starch granules (Tester et al., Reference Tester, Qi and Karkalas2006). Smaller granules possess greater surface area and are therefore more susceptible to enzyme hydrolysis than larger granules (Lee et al., Reference Lee, Huang, Chiang, Chung, Chiou and Yu2011). Lastly, the type of crystal structure may influence the degradation potential (Sajilata et al., Reference Sajilata, Singhal and Kulkarni2006); for instance, pea starch exhibits a C-type crystal structure, which can make it resistant to enzyme action (Sun et al., Reference Sun, Lærke, Jørgensen and Bach Knudsen2006).
Back to experimental conditions, diet A expressed the lowest in vitro starch digestion curve among all the test diets (P < 0.05), probably because of its pronounced RS content (i.e. 72.5% of TS). Several studies reported that high RS values could limit the digestion or hydrolysis rates in food (Sáyago-Ayerdi et al., Reference Sáyago-Ayerdi, Tovar, Osorio-Dìaz, Paredes-López and Bello-Pérez2005) and feed (Sun et al., Reference Sun, Lærke, Jørgensen and Bach Knudsen2006). Moreover, amylose can enhance the formation of RS (Sajilata et al., Reference Sajilata, Singhal and Kulkarni2006), which is consistent with the results of this study.
On the contrary, diet CTR had the highest in vitro digestion profile when compared with other diets. Heat-processed materials have been previously found to be more degradable than raw counterparts (Sun et al., Reference Sun, Lærke, Jørgensen and Bach Knudsen2006), because the starch gelatinization process enhances the surface of contact between the substrate and digestive enzymes (Dona et al., Reference Dona, Pages, Gilbert and Kuchel2010; Parada and Aguilera, Reference Parada and Aguilera2011). In particular, heat processing can modify the chemical structure of starch because of the loss of crystalline structures, exudation of amylose and an increase in viscosity, thus facilitating enzymatic degradation (Svihus et al., Reference Svihus, Uhlen and Harstad2005). In addition, some authors have reported that heat processing improved starch digestibility (Vicente et al., Reference Vicente, Valencia, Serrano, Lázaro and Mateos2009) and performances (Medel et al., Reference Medel, Latorre, de Blas, Lázaro and Mateos2004) in pigs, even if this effect may be strongly dependent on carbohydrate sources and processing conditions (Svihus et al., Reference Svihus, Uhlen and Harstad2005; Sun et al., Reference Sun, Lærke, Jørgensen and Bach Knudsen2006).
Irrespective of the starch source, diets exhibited monophasic in vitro digestion profiles that were suitably described by equation (1) to indicate a first-order kinetics, in accordance with previous findings (Mahasukhonthachat et al., Reference Mahasukhonthachat, Sopade and Gidley2010). In addition, the inclusion of the DC0 in the model was justified by the fact that all the test diets contained soluble glucose at the start of incubation (DC0 ranging from 0.2% to 2.3% of TS; P < 0.05). The soluble glucose must be considered in the kinetic model because it could be confused with the rate of digestion, its degradability being instantaneous.
The kinetics of enzymatic starch digestion greatly differed among diets (P < 0.05). In particular, a wide range in the rate of in vitro starch digestion (k, min−1) was reported, with the highest value recorded for diet CTR (0.061 min−1; P < 0.05). A higher rate of starch digestion could have several implications for animal performance: it may lead to a more complete digestion of starch (Weurding et al., Reference Weurding, Veldman, Venn, van der Aar and Verstegen2001; Lee et al., Reference Lee, Huang, Chiang, Chung, Chiou and Yu2011) and could minimize starch fermentation in the small intestine (Sun et al., Reference Sun, Lærke, Jørgensen and Bach Knudsen2006), ensuring a more efficient energy intake. Moreover, a high starch digestion rate could influence feed intake by minimizing the amount of undigested dietary material reaching the end of the small intestine (Al-Rabadi et al., Reference Al-Rabadi, Torley, Williams, Bryden and Gidley2011).
HI is useful for the comparison of starch digestion values between samples of interest and a reference material. The HI values significantly differed among starch diets (P < 0.05). Different authors found that the digestion potential is largely affected by the starch source, which may be primarily related to starch chemistry, granule size, accessibility to starch granules, amylose/amylopectin ratio and crystallinity (Singh et al., Reference Singh, Dartois and Kaur2010; Regmi et al., Reference Regmi, van Kempen, Matte and Zijlstra2011). In this trial, diet CTR had the highest HI value (P < 0.05), confirming its high degradation potential due to the starch gelatinization process (Dona et al., Reference Dona, Pages, Gilbert and Kuchel2011). On the contrary, diet A had the lowest HI (P < 0.05), in line with its reduced starch degradation due to its high RS and amylose contents.
Incremental plasma glucose appearance and GI characterization
Glucose is considered to be the primary trigger for postprandial changes in metabolic and endocrine functioning (Buyse et al., Reference Buyse, Janssens, van der Geyten, vas As, Decuypere and Darras2002; Hooda et al., Reference Hooda, Matte, Vasanthan and Zjilstra2010). As a consequence, defining the postprandial potential glucose response after a meal is of great interest (Regmi et al., Reference Regmi, Matte, van Kempen and Zijlstra2010). To measure in vivo glucose levels, pigs were fitted with a jugular vein catheter. The choice to analyse the glucose response on peripheral circulation is in line with the original GI procedural protocol developed by Jenkins et al. (Reference Jenkins, Wolever, Taylor, Barker, Fielden and Baldwin1981). Although this approach was sensitive for detecting differences in glucose responses in swine (Deng et al., Reference Deng, Wu, Bin, Li, Huang, Liu, Liu, Ruan, Deng, Hou and Yin2010), it could not account for hepatic glucose consumption (van Kempen et al., Reference van Kempen, Regmi, Matte and Zijlstra2010).
On the basis of in vitro HI data, an increased plasma glucose concentration in pigs was expected for high HI starch diets and indicated that gastric emptying did not confound the ranking of starch sources, in line with previous results (Regmi et al., Reference Regmi, Matte, van Kempen and Zijlstra2010). In particular, our results showed that diets with high HI increased the incremental plasma glucose appearance in jugular-catheterized pigs when compared with low HI diets in the same level of TS (P < 0.05). Different postprandial glucose responses were detected when pigs (Li et al., Reference Li, Dai, Yin, Zhang, Huang, Ruan, Deng and Xie2008; van Kempen et al., Reference van Kempen, Regmi, Matte and Zijlstra2010) and humans (Behall et al., Reference Behall, Scholfield and Hallfrisch2002) consumed various sources of dietary starch with a wide range in starch digestion kinetics. The reason for the different incremental plasma glucose levels may be related primarily to the hydrolysis of starch in the digestive tract, starch hydrolysis being a rate-limiting factor for the appearance of glucose (Cummings and Englyst, Reference Cummings and Englyst1995). Consistent with the results of previous studies conducted on pigs (Regmi et al., Reference Regmi, Matte, van Kempen and Zijlstra2010), a lower postprandial glucose response was observed with diets characterized by a low starch degradation potential and a high content in RS fraction (i.e. diet A and B). It is recognized that the consumption of diets containing RS can decrease postprandial plasma glucose (Deng et al., Reference Deng, Wu, Bin, Li, Huang, Liu, Liu, Ruan, Deng, Hou and Yin2010), because of a reduced kinetic of starch digestion (Morand et al., Reference Morand, Rémésy, Levrat and Demigé1992). Several studies (Reader et al., Reference Reader, Johnson, Hollander and Franz1997; Murray et al., Reference Murray, Patil, Fahey, Merchen, Wolf, Lai and Garleb1998) also found a reduction in the postprandial glucose response after the ingestion of a commercial RS ingredient. On the contrary, diets with high starch digestion kinetics were associated with a rapid increase in glucose concentration (Dona et al., Reference Dona, Pages, Gilbert and Kuchel2010; van Kempen et al., Reference van Kempen, Regmi, Matte and Zijlstra2010).
In general, the GI, which ranks carbohydrates according to their effect on postprandial glucose levels, is utilized for defining the effect of starch digestion (Parada and Aguilera, Reference Parada and Aguilera2011). The GI calculation was carried out in agreement with the original procedure initially proposed for humans, where the use of a fixed amount of carbohydrates (Jenkins et al., Reference Jenkins, Wolever, Taylor, Barker, Fielden and Baldwin1981) or starch (Granfeldt et al., Reference Granfeldt, Drews and Björck1994) is recommended. This is because the glycemic response increases linearly as carbohydrate ingestion increases from 0 to 50 g, whereas it tends to level off when carbohydrate ingestion increases from 50 up to 100 g (Wolever et al., Reference Wolever, Vorster, Björck, Brand Miller, Brighenti, Mann, Ramdath, Granfeldt, Holt, Perry, Venter and Wu2003).
Although GI values differ among starch sources in humans (Dona et al., Reference Dona, Pages, Gilbert and Kuchel2010), no data are currently available for pigs. The different starch diets affected both the IAUC and the GI values in jugular-catheterized pigs. In particular, a period effect was observed for IAUC, but not for GI values. This was probably because of a uniform increase of IAUC values among periods, either for pigs fed the experimental or control diets. As a consequence, the GI could be considered as a mathematical measurement more inherent to starchy diets rather than to the animal metabolic response to the same diet.
The in vivo GI ranking seems to corroborate the previous in vitro HI classification, even if the GI was found to be less distinctive when compared with HI in discerning the starch sources utilized for the diet formulation. These discrepancies may reflect the higher complexity of the in vivo evaluation compared with the in vitro technique (Parada and Aguilera, Reference Parada and Aguilera2011). Recently, Hasjim et al. (Reference Hasjim, Lavau, Gidley and Gilbert2010), studying the structure of starch granule during both in vitro and in vivo pig digestions, indicated that in vitro methods might not fully reproduce the heterogeneous and complex conditions taking place during in vivo digestion. In particular, in vitro experiment involves the interaction of only the substrate and purified enzymes and the entire sample is incubated with an optimized cocktail at time 0 (van Kempen et al., Reference van Kempen, Regmi, Matte and Zijlstra2010). In contrast, the in vivo digestion is a dynamic process that involves animal variation, chewing, bowel movement and other enzymes such as salivary amylases and glucose carriers (Lee et al., Reference Lee, Brooks, Kim, Heitlinger and Lebenthal1985; Weurding et al., Reference Weurding, Veldman, Venn, van der Aar and Verstegen2001; Hasjim et al., Reference Hasjim, Lavau, Gidley and Gilbert2010). Moreover, the lack both in the simulation of the effect of diets on passage rate and viscosity and in the removal of digestion products foreseen for the in vitro analyses could further explain these differences (Weurding et al., Reference Weurding, Veldman, Venn, van der Aar and Verstegen2001).
Relation of in vitro HI with in vivo GI
There are many reports detailing the role of GI both in human and animal nutrition (Ludwig, Reference Ludwig2002; Menoyo et al., Reference Menoyo, Serrano, Barrios, Valencia, Lázaro, Argente and Mateos2011); however, the in vivo study being laborious and expensive, interest in an in vitro methodology to estimate glycemic response has recently increased. The HI was previously found to be a good predictor of glycemic response to food ingestion and highly correlated with the GI in humans (Goñi et al., Reference Goñi, Garcia-Alonso and Saura-Calixto1997). In addition, the authors reported in their final report, a linear equation that was widely adopted to convert HI to GI data in human studies (Chung et al., Reference Chung, Shin and Lim2008; Germaine et al., Reference Germaine, Samman, Fryirs, Griffiths, Johnson and Quail2008). However, whether this equation could be applied to pigs is questionable, because monogastric animals have a digestive system only roughly similar to human beings (Parada and Aguilera, Reference Parada and Aguilera2011). Moreover, the equation proposed by Goñi et al. (Reference Goñi, Garcia-Alonso and Saura-Calixto1997) is mainly based on cooked starch-containing food, whereas the starch consumed by domestic animals is largely uncooked. In our experimental conditions, it was confirmed that the in vitro HI was a good predictor of the in vivo GI determined in jugular-catheterized pigs, as evidenced by regression analysis (equation 2). However, a high prediction error was reported (RMSE = 15.8), indicating that further study needs to be done to minimize the discrepancy between in vivo and in vitro digestion evaluations for practical purposes (Hasjim et al., Reference Hasjim, Lavau, Gidley and Gilbert2010). Moreover, this approach was mainly focussed on pig nutrition with limited relevance to humans, because uncooked starches were used.
Conclusions
This study showed that different sources of dietary starch affected the kinetics of starch digestion, the incremental plasma glucose response and the GI in pigs. In concert with chemical composition and classical criteria (as the ileal or the faecal digestibility), the in vitro procedure described for the estimation of the starch hydrolysis potential may be useful for the assessment of the GI in pigs, in order to provide valuable laboratory tools for screening the nutritional value of starch-rich materials. However, for practical purposes, further studies are required to optimize the in vitro conditions.
Acknowledgements
The authors thank Dr Ruurd T. Zijlstra and Dr Rajesh Jha for their help and technical advice. This project was supported by the AGROSCENARI project ‘Scenari di adattamento dell'agricoltura italiana ai cambiamenti climatici’ of MIPAAF (Ministero delle politiche agricole alimentari e forestali – Italy) and by the Doctoral School on the Agro-Food System (Agrisystem) of the Università Cattolica del Sacro Cuore (Italy).