I. INTRODUCTION
Hematite (α-Fe2O3), based on hexagonal close packing of oxygen with iron in 2/3 of the octahedral vacancies, is traditionally used as catalysts, pigments, gas sensors, and electrode materials due to its attractive features, such as low cost, good stability, nontoxicity, and environmentally friendly properties. Reference Chen, Xu, Li and Guo1,Reference Zhang, Chen, Wang and Qi2 Particularly, the compound has a theoretical capacity of 1007 mAh g−1, 2.7 times higher than that of commercial graphite (372 mAh g−1), thus becomes a kind of candidates for the high capacity lithium-ion battery anode materials. For instance, nanocubes, nanorods, nanotubes, hollow spheres, porous nanospheres, nanorings, and hexapod-like nanostructures of α-Fe2O3 have been synthesized and were used as electroactive materials. Reference Song, Jia, Qi, Yang, Tang and Min3–Reference Wu, Yin, Zhu, Ouyang and Xie5 However, the poor electrical conductivity and large volume change, pulverization/aggregation of Fe2O3 nanostructures during lithium insertion/extraction result in a large capacity loss and poor cycling stability. Reference Wang, Ding, Bark and Chen6
Strategies have been proposed to mitigate the pulverization and further enhance the structural stability of hematite electrode materials. (i) Designing unique micro/nanostructures or controlling pore structures of hematite is an effective path to reduce the absolute volume change and offer a shorter diffusion length for lithium ion leading to enhanced discharge/charge rates. Reference Wu, Guo, Wan and Hu7,Reference An, Zhang, Pan and Yu8 (ii) The other strategy is to disperse Fe2O3 particles into ordered mesoporous carbon Reference Fan, Wang, Yu, Tu, Jiang and Zhao9 or carbon nanotubes Reference Prem, Ramesh, Lin and Fey10 to release the volume expansion, while improving the cycling stability. (iii) Carbon coating method can also be utilized to prevent the exfoliation of the inner active material as well as improving the electrical conductivity of electrode materials. Reference Piao, Kim, Sung and Hyeon11 However, for the concept of inner-pore or internanotube confinement, it is hard to homogeneously disperse the high-surface-energy hematite nanoparticles in a carbon matrix during preparation process, and the stiff carbon framework is not good for buffering the huge volume expansion. As a result, the active nanoparticles severely agglomerate to form irregularly shaped secondary aggregates, which are detrimental to the stability of composite electrodes. Similarly, the interfacial energy of nanoparticles after carbon coating is still large and the composite particles tend to aggregate easily. And the carbon coating cannot effectively release the large strain caused by volume expansion because it tightly wraps the surface of the active particles. Considering the shortcomings of these inner-pore filling and exterior coating carbon materials, a flexible confining structure is expected to provide enough buffer space for improving the cycling stability of hematite by reducing the pulverization.
Graphene nanosheet (GNS) is a single-atom thick structure of sp 2-bonded carbon atoms that are densely packed in a honeycomb crystal lattice. Recently, GNS has attracted much research interest in energy-storage technologies due to its own properties, such as high electrical conductivity, large specific surface area, great mechanical strength, and chemical stability. Reference Chen, Tang and Li12 Several reports based on graphene/transition metal oxide composites have been studied to show drastically improved properties. Reference Zhao, Song, Liu, Xu, Fang, Jiao, Zhang and Jiang13–Reference Zhou, Wang, Li, Li, Li and Cheng17 These research efforts have demonstrated that GNS in the nanocomposites not only provides an elastic buffer space to accommodate the volume expansion/contraction of transitional metal oxide nanostructures during Li insertion/extraction process but also efficiently prevents its aggregation and the cracking or crumbling upon continuous cycling, which results in high rate capability and cyclability. Moreover, a series of graphene-based Fe2O3 composites, such as nanoparticles, nanorice, nanotubes, and nanorods Reference Lee, Deng, Fan, Mhaisalkar, Tan, Tok, Loh, Chin and Sow18–Reference Xue, Ma, Cui and Xing21 have been reported. The specific capacity and cycling performance of these nanocomposites were substantially increased compared with bare iron oxide anodes. Considering that extensive research efforts have demonstrated that intriguing properties and applications may be generated by tailoring the shape and size of functional nanomaterials, we believe that it is worthwhile to explore α-Fe2O3/graphene composites with a carefully crafted control of the Fe2O3 morphology and size. At the same time, understanding the growth mechanism of special shape of iron oxide on the graphene surface is of great significance.
Herein, Fe2O3 rhombohedra and nanoparticles were synthesized on GNS by a simple hydrothermal technique. The inorganic structure-directing additive CH3COONa has been shown to play an important role in control over the final morphology and size of the products, and then has a remarkable effect on lithium insertion/extraction behavior. Here, the thermal exfoliated graphene nanosheet is used as the integrated matrix, which has been studied to show a high surface area (227 m2 g−1) and about four orders of magnitude improvement in electrical conductivity by comparison with graphite oxide in our previous study. Reference Zhao, Liu, Jiang, Pan, Tao, Song, Fang and Xu22 Fe2O3 rhombohedra/graphene (signed as Fe2O3-R/GNS) nanocomposite showed a high reversible capacity of 905.3 mAh g−1 at 100 mA g−1 as well as significantly enhanced cycling performance compared with bare Fe2O3 and Fe2O3 particle/graphene (signed as Fe2O3-P/GNS) composites. This may be due to good accommodation and conductive networks provided by graphene nanosheets, small particle size of Fe2O3 and its good dispersion on the surface of graphene.
II. EXPERIMENTAL
A. Synthesis of graphene
Graphite oxide (GO) sheets were prepared from natural graphite powder via a modified Hummer's method as described in our previous work. Reference Zhao, Liu, Jiang, Pan, Tao, Song, Fang and Xu22 Then, the as-prepared GO sheets (0.2 g) were thermally reduced in a simple horizontal tube furnace in nitrogen atmosphere with a heating rate of 5 °C min−1 at 500 °C for 2 h. After pyrolytic reduction, the obtained final black powder was GNS.
B. Synthesis of Fe2O3 rhombohedra/graphene
In a typical synthesis process, 0.08 g as-synthesized graphene powder was dissolved in 30 mL of deionized water by ultrasonication to form a suspension. Then the suspension was mixed with 50 mL of 0.27 g FeCl3·6H2O and 0.25 g CH3COONa aqueous solution with constant stirring. After stirring vigorously in air for 30 min, the mixture suspension was then transferred into 100 mL Teflon and heated at 180 °C for 24 h. After being cooled down to room temperature naturally, the resulting precipitates were washed with ethanol and distilled water, and finally dried at 60 °C for 12 h. In a control experiment, we synthesized bare Fe2O3 and Fe2O3 particle/graphene composites without the use of CH3COONa and/or graphene by the same method.
C. Structural characterization
The morphology and microstructure of the obtained products were characterized by x-ray power diffraction (XRD, Rigaku D/max-2500, Rigaku Co., Japan, Cu Kα radiation, λ = 1.50405 Å), field-emission scanning electron microscopy (FE-SEM, JSM-6700F, JEOL Ltd., Japan) with an energy dispersive x-ray spectrometer (EDS), Fourier transform infrared (Thermo Nicolet AVATAR 370 FT-IR, Madison, Wisconsin), and transmission electron microscopy/selected area electron diffraction (TEM/SAED, JEOL JEM-200CX and JEM-2010F, JEOL Ltd., Japan) in the Instrumental Analysis and Research Center, Shanghai University.
D. Electrochemical measurements
The electrochemical test of the obtained composites was carried out in 2016 coin-type cells. The working electrodes were prepared by mixing 85 wt% active materials, 10 wt% acetylene black, and 5 wt% polytetrafluoroethylene (PTFE). The lithium metal foil was used as the anode while the electrolyte used was a solution of 1M LiPF6 in dimethyl carbonate (DMC) and ethylene carbonate (EC) (1:1 by weight). The coin-cells were assembled in an argon-filled glove box and tested using a LAND CT2001A cell test system (Wuhan, China) with galvanostatic charge and discharge in the voltage range of 5 mV to 3.0 V (versus Li/Li+) at different current densities (0.1 C–1 C rate, 1 C = 1000 mA g−1) at room temperature. The cyclic voltammograms (CV) were obtained over the voltage range from 0.01 to 3.00 V at a scanning rate of 0.1 mV s−1 using a CHI 660C electrochemical working station (CH Instruments, Shanghai, China). Alternating current (AC) impedance spectra were obtained by applying a sine wave with the amplitude of 5.0 mV over the frequency range from 0.01 Hz to 100 kHz. Before AC impedance spectra were conducted, the electrodes were charged to 3.0 V and kept for 5 h at open-circuit to allow their potential to be stabilized.
III. RESULTS AND DISCUSSIONS
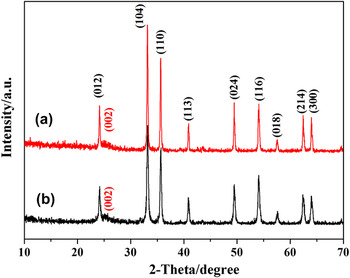
The XRD patterns of Fe2O3-R/GNS and Fe2O3-P/GNS composites are shown in Fig. 1. The broad (002) diffraction peak appears at 24.9° can be indexed into the disorderedly stacked GNS, which is in agreement with the diffraction peak of previously reported values of GNS. Reference Cong, He, Lu and Yu23,Reference Zhou, Wang, Li, Zhang, Li, Wu, Wen and Cheng24 All the other diffraction peaks of two samples are in agreement with that of the standard hematite α-Fe2O3 (JCPDS No. 33-664, lattice constant a = b = 5.035 Å, and c = 3.749 Å), indicating that both products with relatively high crystal purity are synthesized. By comparing the full width half maximum (FWHM) of the diffraction peaks, one can easily find that the diffraction peaks of rhombohedra are broader than those of nanoparticles, which may be attributed to different particle sizes of the as-prepared Fe2O3 samples. According to the Scherrer's equation, the grain size of rhombohedra and particles are calculated to be 78.5 and 159.2 nm, respectively.
XRD patterns of (a) Fe2O3-R/GNS and (b) Fe2O3-P/GNS composites.

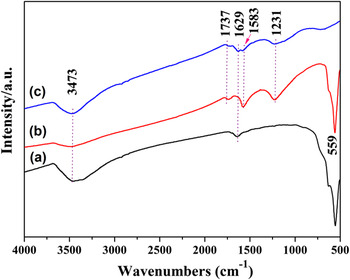
Figure 2 shows the FTIR spectra of graphene, bare Fe2O3, and Fe2O3-R/GNS composites. For graphene [Fig. 2(a)], the peak at 3473 cm−1 can be attributed to O–H stretching vibrations of adsorbed water molecules and structural OH groups, and the peak at 1629 cm−1 can be attributed to O–H bending vibrations. The presence of carboxyl and epoxy functional groups can also be detected at around 1737 and 1231 cm−1, respectively. After Fe2O3 was integrated with GNS, a new strong Fe–O stretching vibration peak is observed at 559 cm−1, and the absorption bands at 1583 cm−1 reflecting the skeleton vibration of GNS enhance obviously. Reference Mensing, Kerdcharoen, Sriprachuabwong, Sriprachuabwong, Wisitsoraat, Phokharatkul, Lomas and Tuantranont25 Meanwhile, the peaks in 1629 and 3473 cm−1 related to oxidized group decrease significantly, indicating Fe3+ interactions with oxygen-containing groups and conversion to iron oxide in the subsequent reaction.
FTIR spectra of (a) bare Fe2O3, (b) Fe2O3-R/GNS, and (c) graphene.

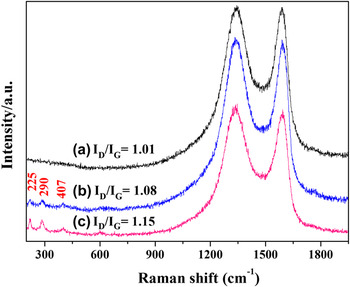
Figure 3 shows the Raman spectra of graphene, Fe2O3-P/GNS and Fe2O3-R/GNS composites. The three samples show typical peaks at around 1340 and 1590 cm−1, which correspond to the D band (κ-point phonons of A 1g symmetry) and G band (E 2g phonon of C sp 2 atoms) of graphene. Besides the two peaks, the Raman band at 225 cm−1 is assigned to A 1g mode and the bands at 290 and 407 cm−1 are assigned to E g vibration modes of hematite [Figs. 3(b) and 3(c)]. Reference Lee, Deng, Fan, Mhaisalkar, Tan, Tok, Loh, Chin and Sow18 Such a result further confirms that the crystalline structure Fe2O3/graphene nanocomposites have been obtained.
Raman spectra of (a) graphene, (b) Fe2O3-P/GNS, and (c) Fe2O3-R/GNS composites.

Raman spectra with characteristic G and D bands are sensitive to defects, disorder, and carbon grain size, and have extensively been used to characterize carbon materials. D band is an indication of disorder in the Raman spectra of the GNS, originating from defects associated with vacancies, grain boundaries, and amorphous carbon species. And the I D/I G intensity ratio is a measure of disorder degree and average size of the sp 2 domains. Reference Zhou, Bao, Tang, Zhong and Loh26 In Fig. 3(a), it can be identified that the I D/I G of GNS calcined at 500 °C is 1.01, which is higher than that of pristine GO (approximately 0.75) reported in our previous study, Reference Zhao, Liu, Jiang, Pan, Tao, Song, Fang and Xu22 indicating that a lot of carbon cavities are generated and the disorder degree increased during thermal decomposition of GO to form GNS in N2. With the addition of Fe2O3 nanocrystallites, the disorder of the two composites increased to a certain extent possibly due to the insertion of Fe2O3 into GNS layers. This agrees well with the previous observation on GNS-based transitional metal oxide composites. Reference Wang, Cui, Yang, Casalongue, Robinson, Liang, Cui and Dai15,Reference Xue, Ma, Cui and Xing21,Reference Zhang, Lei, Chen, Yu and Wang27 Especially, Fe2O3-R/GNS composite demonstrates more defects and disorder with an I D/I G ratio of 1.15, reflecting that a smaller size of nanorhombohedron is easier to be inserted between the GNS layers. Accordingly, this change would affect the physical and chemical properties of graphene-based composite materials. Reference Pumera28
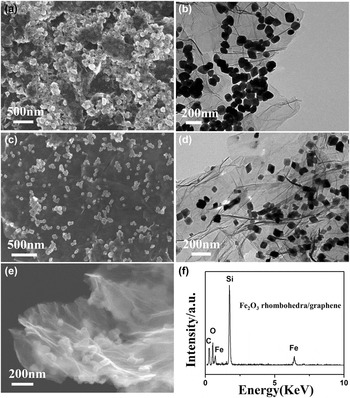
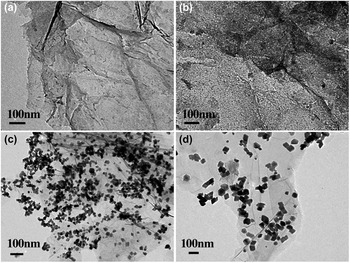
SEM and TEM observations revealed the morphologies of α-Fe2O3 nanoparticles and rhombohedra composites, as shown in Fig. 4. In the system without adding any inorganic salt additive, Fe2O3 particles showed irregular shape and congregated together forming an irregular aggregate despite the presence of GNS support [Fig. 4(a)]. The magnified TEM image reveals that the Fe2O3 particles are around 150–200 nm in size [Fig. 4(b)]. However, when the system was added with CH3COONa and reacted for the same 6 h, well dispersed and uniform Fe2O3 nanorhombohedra with average diameters of 80 nm were obtained, which is consistent with the results of XRD calculations. Obviously, the size, morphology, and distribution of Fe2O3 rhombohedra on graphene are much better than those of Fe2O3-P/GNS composite. According to the TEM image [Fig. 4(d)], the graphene layer can be clearly distinguished from the background. And a few particles seem to be enveloped by a thin film as some particles locate on the back of monolayer graphene. Although not fully verified, it has been proposed that the epoxy and C–OH functional groups lie above and below each carbon layer. Reference Bourlinos, Gournis, Petridis, Szabo, Szeri and Dekany29 The Fe2O3 nanorhombohedra appear on both sides of the support: some locate above the graphene nanosheet, while others lie on the back of the sheet.
SEM and TEM images of (a, b) Fe2O3-P/GNS composite and (c, d) Fe2O3-R/GNS composite, respectively, (e) higher magnification SEM image of the edge of Fe2O3-R/GNS and its EDS spectrum (f).

Figure 4(e) shows the higher magnification SEM image of the edge of graphene in Fe2O3-R/GNS composite. The graphene nanosheets are of inherent wrinkled or crumpled thin voile-like structures with folds, originated from the exfoliation of GO precursors during the pyrolysis process. These transparent flakes composed of high quality multilayer graphene sheets are closely attached with the oxides, suggesting good electrical conductivity of the composite. The corresponding energy-dispersive x-ray spectrometry (EDS) is shown in Fig. 4(f). A few elements such as C, O, and Fe were present in the composite. The Si element was observed because the Si substrate was used to disperse SEM sample, thus removing the carbon effect from the common substrate (carbon paste). The weight percentage of Fe2O3 is calculated to be about 45.9%, which is slightly different from the theoretical value (50%), indicating that most Fe3+ ions are eventually generated into Fe2O3 on the graphene surface.
Previous studies have demonstrated that inorganic species could play as the capping agents or structural agents to control the morphology and size of nanomaterials besides organic surfactants and polymers. Owing to their relatively small size, it is expected that inorganic ions might have a more pronounced influence on the nucleation and growth process of nanocrystallites than organic surfactants and polymers. Take the synthesis system of rhombohedra for example, inorganic salts might change the pH and ionic strength of the solution. And the inorganic anions can coordinate with existing reactant cations via different coordination modes and strengths. Moreover, the selective adsorption of inorganic ions on the surface of the formed crystal nuclei and primary nanoparticles can alter its surface termination and atomic arrangement. Reference Wu, Guo, Wan and Hu7 All these changes may affect the anisotropic growth process and result in a different size and shape of the final nanostructures.
To reveal the growth mechanism of the rhombohedra α-Fe2O3/GNS in more detail, the products were collected at certain reaction time intervals for TEM observations (Fig. 5) and the formation of Fe2O3 rhombohedra could be illustrated by three processes. (i) Nucleation process. As is known, perfect rhombohedra gradually grew up from crystal nucleus at the center. Firstly, Fe3+ ions are selectively adsorbed with the carboxyl groups of the graphene surface through mutual electrostatic attraction. Then, the Fe3+ ions, which were adsorbed on both sides of graphene, reacted with OH− (produced by the hydrolysis of CH3COO−) and oxygen at room temperature to form α-FeOOH amorphous particles, as shown in Fig. 5(a). Then α-FeOOH particles dehydrated to form spherical iron oxide nucleus under hydrothermal condition. This kind of spherical iron oxide nucleus is in the unsteady state due to its poor crystallinity and large surface energy. Reference Voorhees30,Reference Yang and Zeng31 (ii) Growth process. One ferric iron (Fe3+) could chelate three CH3COO− to form octahedral molecular structures, and selectively adsorb in spherical iron oxide nucleus in different directions. The different adsorption ability of CH3COO− on different planes of iron oxide resulting in anisotropic growth and oriented attachment, which then eventually form this particular rhombohedra structure. After hydrothermal reaction for 30 min [Fig. 5(b)], there are transparent areas appear around the spherical iron oxide nucleus significantly getting larger. The phenomenon of small particles dissolution, while larger particles grow up agrees with Ostwald ripening. Reference Siegfried and Choi32,Reference Filankembo and Pileni33 And finally, small spherical iron oxide would grow into rhombohedra after heating for 2 h [Fig. 5(c)]. It is notable that some small primary nanocrystals still existed in this sample, indicating that oriented attachment is still underway. (iii) Growth arrest. The adsorption of CH3COO− on the surface of the rhombohedra can make the particles negatively charged. Due to the same negative charge, interactional repulsion exists among the particles. As a result, rhombohedra were uniformly monodispersed on the graphene surface in this 6 h sample, as shown in Fig. 5(d). The grain size remained basically the same when the standing time prolong to 24 h, indicating that CH3COO− can play the role of capping agents which have a pronounced influence on the uniformity of the as-grown rhombohedra.
TEM images of Fe2O3-R/GNS sample at different hydrothermal reaction time intervals (a) 0 min, (b) 30 min, (c) 2 h, and (d) 6 h.

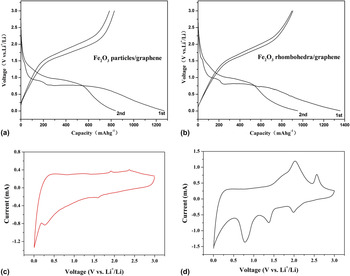
To investigate the particle size and shape effects on the electrochemical properties of the α-Fe2O3 nanostructures, we mixed these materials with acetylene black and PTFE as working electrodes. Figures 6(a) and 6(b) show the first and second charge–discharge curves of Fe2O3-P/GNS and Fe2O3-R/graphene composites at a current density of 100 mA g−1 in the voltage range of 5 mV to 3 V. It was found that the shape of the two curves is very similar, both samples have two voltage plateaus at 1.1–1.52 V and 0.78–0.95 V in the first discharge curves. The voltage plateau at around 1.52 V can be described as a small amount of lithium insertion into the crystal structure of Fe2O3 to form Li x Fe2O3 intermediate. The discharge plateau at approximately 0.95 V reflects Li x Fe2O3 inserted a certain amount of lithium and turned into Li2Fe2O3, meanwhile the crystal structure of Fe2O3 transformed into cubic from hexagonal stacking. The long plateau at around 0.78 V is largely due to the reduction reaction of Fe3+ and the irreversible formation of solid electrolyte interphase (SEI) layers because of the decomposition of the solvent in the electrolyte. Reference Tian, Zhuang, Li, Wu, Shi and Sun34 These two plateau voltages are clearly reflected as peaks in the CV curves shown in Figs. 6(c) and 6(d). The magnitude of the current density of the redox peaks is significantly large in the case of the Fe2O3-R/GNS composite electrode, demonstrating excellent electrical conductivity between Fe2O3 nanorhombohedra and GNS matrix. The initial discharge capacities based on the total mass are 1270.2 and 1356.9 mAh g−1 for Fe2O3-P/GNS and Fe2O3-R/GNS composites, respectively. The corresponding reversible charge capacities are 839.6 and 905.3 mAh g−1. Obviously, Fe2O3-R/GNS obtains higher specific capacity than that of Fe2O3-P/GNS composite. The value is comparable to those obtained in previous Fe2O3/graphene hybrid materials. Reference Wu, Guo, Wan and Hu7,Reference Xue, Ma, Cui and Xing21,Reference Liu and Tay35,Reference Wang, Liu, Luo, Zhao, Ren, Bai and Wang36 This should be readily attributed to the smaller size and larger surface area for the Fe2O3-R/GNS sample. Meanwhile, small particles are much easier to be inserted in the graphene layers [as seen in Fig. 4(e)], by this way, can prevent the stack of graphene and improve the specific surface area and porosity, thus providing sufficient contact area for the reaction of lithium intercalation to Fe2O3-R/GNS composite. Reference Wang, Tian, Liu, Zhi, Bando and Golberg37
The galvanostatic charge–discharge profiles and CV curves of (a, c) Fe2O3-P/GNS and (b, d) Fe2O3-R/GNS composites, respectively.

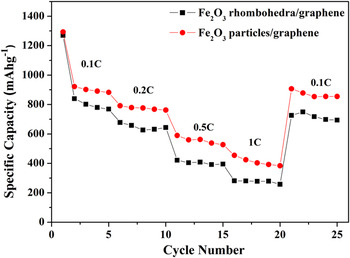
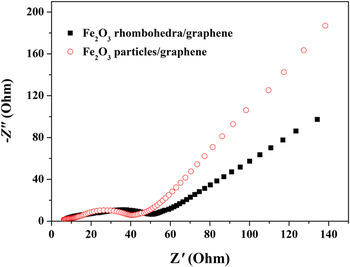
The rate capabilities and high rate cycling performance of the two composites are also investigated and shown in Fig. 7. Fe2O3-R/GNS composite shows rather good rate capability with an average discharge capacity as high as 1025.2 mAh g−1 at a current density of 0.1 C, 780.3 mAh g−1 at 0.2 C, 426.7 mAh g−1 at 1 C and finally resume 871.2 mAh g−1 when the current density is reduced back to 0.1 C. While Fe2O3 particle/graphene exhibits lower charge capacities of 891.8, 648.2, 302.4, and 724.2 mAh g−1 at the corresponding rates, respectively. These results show that the Fe2O3-R/GNS composites are indeed promising architectures, which are able to improve the electrochemical performance of the electrodes. To understand the reason behind the superb performance of the Fe2O3-R/GNS electrodes compared to the Fe2O3-P/GNS electrodes, comparative electrochemical impedance spectroscopy (EIS) data were collected. Nyquist plots (Fig. 8) demonstrate that a diameter of the semicircle of Fe2O3-R/GNS electrodes in the high-medium frequency region is much smaller than that of Fe2O3-P/GNS electrodes, thus suggesting that Fe2O3-R/GNS composites possess the lower contact and charge-transfer impedance. The result indicates that the Fe2O3-R/GNS composites possess a high electrical conductivity, resulting in the better rate capability and higher reversible capacity in comparison with the Fe2O3-P/GNS composites.
Comparison of rate capability of Fe2O3-P/GNS and Fe2O3-R/GNS composites.

Nyquist plots of electrodes made of Fe2O3-P/GNS and Fe2O3-R/GNS composites.

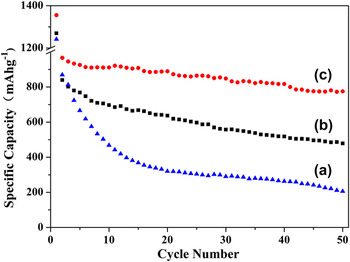
Figure 9 shows the cycling performance of bare Fe2O3, Fe2O3 particles/graphene, and Fe2O3 rhombohedra/graphene composite in the voltage range of 5 mV to 3 V at 0.1 C rate. It shows that the capacity of the bare Fe2O3 rapidly decreases from 869.8 to 254.3 mAh g−1 after 50 cycles, resulting in 1.42% capacity loss per cycle. For Fe2O3-P/GNS, the discharge specific capacity fades down from 839.6 to 478.4 mAh g−1, about 57.1% retention of the initial capacity is maintained. In a sharp contrast, Fe2O3-R/GNS could still deliver a specific capacity of 775.4 mAh g−1, exhibits excellent cyclic performance, and retains 85.7% of its initial capacity after 50 cycles. It is worth noting that the present Fe2O3-R/GNS revealed excellent electrochemical stability compared with many recently reported Fe2O3/graphene hybrid structures. Reference Lee, Deng, Fan, Mhaisalkar, Tan, Tok, Loh, Chin and Sow18-Reference Xue, Ma, Cui and Xing21,Reference Zhang, Lei, Chen, Yu and Wang27,Reference Tian, Zhuang, Li, Wu, Shi and Sun34-Reference Zou, Kan and Wang38 These Fe2O3 products in these mentioned composites included nanoparticles, nanorice, nanotubes, nanoplatelets, and hollow spheres; and they were also anchored on the surface of graphene. Therefore, the superior electrochemical stability improvement for our sample is believed to be resulted from the synergetic effect of rhombohedra morphology, small diffusion lengths, and flexible confinement graphene. First, a superflexible graphene coating covering α-Fe2O3 nanocrystals not only provides an elastic buffer space to accommodate the volume change upon lithiation/delithiation, but also efficiently prevents the crumbling of the electrode material. Even though the volume expansion occurred, the electrode will not be cracked since the graphene sheets can deform resilient to buffer such volume variation. Second, apart from preventing the detachment and agglomeration of pulverized F2O3, graphene can also provide effective conductive network and excellent Li+ transport, which decrease the inner resistance of lithium-ion batteries and are favorable for stabilizing the electronic and ionic conductivity. Reference Zou, Kan and Wang38 Third, it may be related to the different morphologies of the α-Fe2O3 nanostructures, which holds different crystalline surfaces exposed to electrolyte. Finally, compared with the particles, rhombohedron has the advantages of being fairly uniform in nuclear size (80 nm), solid combination, and good dispersion on the graphene surface, which would shorten the path length for Li-ion transport, increase materials/electrolyte contact area, and facilitate the Li-ion diffusing to the sites on the surface of α-Fe2O3 nanostructures, therefore leading to high specific capacity and cyclability.
Cycling performance of (a) bare Fe2O3, (b) Fe2O3-P/GNS and (c) Fe2O3-R/GNS composites at 0.1 C rate in the voltage range of 5 mV to 3 V.

IV. CONCLUSIONS
A novel Fe2O3 rhombohedra/graphene composite as a performance improved anode material for lithium-ion batteries has been prepared with hydrothermal method. The growth mechanism and the role of CH3COONa inorganic surfactant in the reaction system were studied. The flexible graphene nanosheets with high electrical conductivity and excellent mechanical properties contact tightly with α-Fe2O3, not only act as the electronic conducting skeleton of the composites but also provide an elastic buffer space to accommodate the volume change upon lithiation/delithiation. Electrochemical measurements show that the shape and size of α-Fe2O3 have remarkable effects on their electrochemical performance toward lithium storage. Particularly, rhombohedron has the advantages of being fairly uniform in nuclear size, solid combination, and good dispersion on the graphene surface than particles. It exhibits a reversible capacity of 905.3 mAh g−1 at the initial discharge cycle, and the value could retain 775.4 mAh g−1 with high capacity retention of 85.7% after 50 cycles, much higher than that of bare Fe2O3 and Fe2O3 particle/graphene composites.
ACKNOWLEDGMENTS
This work was supported by the Natural Science Foundation of China (11275121, 21241002, 21371116), Science and Technology Committee of Shanghai (13DZ1200502, 13DZ2295200), and Program for Innovative Research Team in University (IRT13078).