Introduction
Although CZTSSe has been the subject of significant research in the last 15 years for its light absorption properties in thin-film solar cells [Reference Xin, Katahara, Braly and Hillhouse1, Reference Miskin, Yang, Hages, Carter, Joglekar, Stach and Agrawal2], the efficiency of Cu2ZnSn(S, Se)4 (CZTSSe) solar cells has remained at 12.6% since 2013, limited by intrinsic defects [Reference Wang, Winkler, Gunawan, Gokmen, Todorov, Zhu and Mitzi3]. With the realization that Cu+ and Zn2+ antisite defects make the open circuit voltage (V oc) the bottle neck of CZTSSe solar cells [Reference Valakh, Kolomys, Ponomaryov, Yukhymchuk, Babichuk, Izquierdo-Roca, Saucedo, Perez-Rodriguez, Morante, Schorr and Bodnar4, Reference Schelhas, Stone, Harvey, Zakhidov, Salleo, Teeter, Repins and Toney5, Reference Mendis, Shannon, Goodman, Major, Claridge, Halliday and Durose6, Reference Hages, Redinger, Levcenko, Hempel, Koeper, Agrawal, Greiner, Kaufmann and Unold7, Reference Koeper, Hages, Li, Levi and Agrawal8, Reference Gokmen, Gunawan, Todorov and Mitzi9, Reference Hages, Koeper and Agrawal10], researchers have focused their effort in reducing the defect density by substituting atoms with different sizes onto Cu, Zn, or Sn sites to increase the antisite defect formation energy. The modified materials based on CZTSSe include Cu2Zn(Ge, Sn)(S, Se)4 [Reference Hages, Levcenco, Miskin, Alsmeier, Abou-Ras, Wilks, Br, Unold and Agrawal11, Reference Guo, Ford, Yang, Hages, Hillhouse and Agrawal12, Reference Ford, Guo, Agrawal and Hillhouse13], Cu2CdSn(S, Se)4 [Reference Su, Tan, Li, Zeng, Batabyal and Wong14], and (Cu, Ag)2ZnSnSe4 (CAZTSe) [Reference Hages, Koeper and Agrawal10, Reference Kumar and Ingole15, Reference Gershon, Lee, Antunez, Mankad, Singh, Bishop, Gunawan, Hopstaken and Haight16, Reference Gong, Tabata, Takei, Morihama, Maeda and Wada17, Reference Chagarov, Sardashti, Kummel, Lee, Haight and Gershon18]. One of the successful examples is substituting Ag for Cu, whose covalent radius is about 30% larger than that of Cu. This resulting Ag2ZnSnSe4 (AZTSe) has been proved to have lower densities of donor- or acceptor-type defect states than pure CZTSSe [Reference Chagarov, Sardashti, Kummel, Lee, Haight and Gershon18, Reference Yuan, Chen, Xiang, Gong, Walsh, Park, Repins and Wei19].
Silver-containing CZTSSe solar cells were first reported in 2016 by two groups. Hages et al. [Reference Hages, Koeper and Agrawal10] reported p-type CZTSSe with partial substitution of Cu with up to 50% Ag, and Gershon et al. [Reference Gershon, Lee, Antunez, Mankad, Singh, Bishop, Gunawan, Hopstaken and Haight16, Reference Gershon, Sardashti, Gunawan, Mankad, Singh, Lee, Ott, Kummel and Haight20] reported n-type AZTSe in the absence of Cu. The n-type AZTSe layer was fabricated through coevaporation of Ag, Zn, Sn, and cracked Se sources, and the resulting device achieved about 5% efficiency. As an alternative to vacuum-based deposition techniques, solution processing offers a cost-effective option for depositing thin films with high photovoltaic performance. Among different solution processing methods, the colloidal nanoparticle route is competitive because of its scalability, robustness, and high utilization rate of materials. Typically, sulfide nanoparticles are synthesized and assembled into a thin film, followed by chalcogen exchange in Se vapor at elevated temperature to obtain dense, continuous selenide films [Reference Guo, Ford, Yang, Walker, Stach, Hillhouse and Agrawal21, Reference Guo, Ford, Hillhouse and Agrawal22]. Because the morphology and phase purity of the final film are determined by the starting nanoparticles [Reference Hages, Koeper, Miskin, Brew and Agrawal23], an appropriate Ag2ZnSnS4 (AZTS) nanoparticle synthesis is needed for the fabrication of AZTSSe thin films via solution processing. Other than being used as the precursor for AZTSe thin films, AZTS itself has also been explored as photocatalyst [Reference Cheng and Hong24, Reference Li, Chai, Peng, Mao and Zan25, Reference Tsuji, Shimodaira, Kato, Kobayashi and Kudo26], light absorber layer [Reference Ma, Guo, Zhang, Li, Yuan and Ding27], or window layer for CZTSe thin film solar cells [Reference Guo, Ma, Zhang, Jia, Li, Yuan and Ding28].
Nanoparticles of AZTS synthesized through different solvent thermal processes have been reported previously, and the resulting nanoparticles are found to have significant amounts of secondary phases [Reference Li, Chai, Peng, Mao and Zan25, Reference Tsuji, Shimodaira, Kato, Kobayashi and Kudo26]. Here, we report a method to produce AZTS nanoparticles with high phase-purity by a hot-injection method. Additionally, the formation pathway of AZTS nanoparticles is revealed based on the kinetics of phase transformation and particle growth. The optical band gap as well as the photoelectrochemical performance were examined for AZTS nanoparticle films from the resulting AZTS nanoparticles. Based on these results, several potential applications of the sulfide thin film are under investigation in the literature for its future usage.
Results and discussion
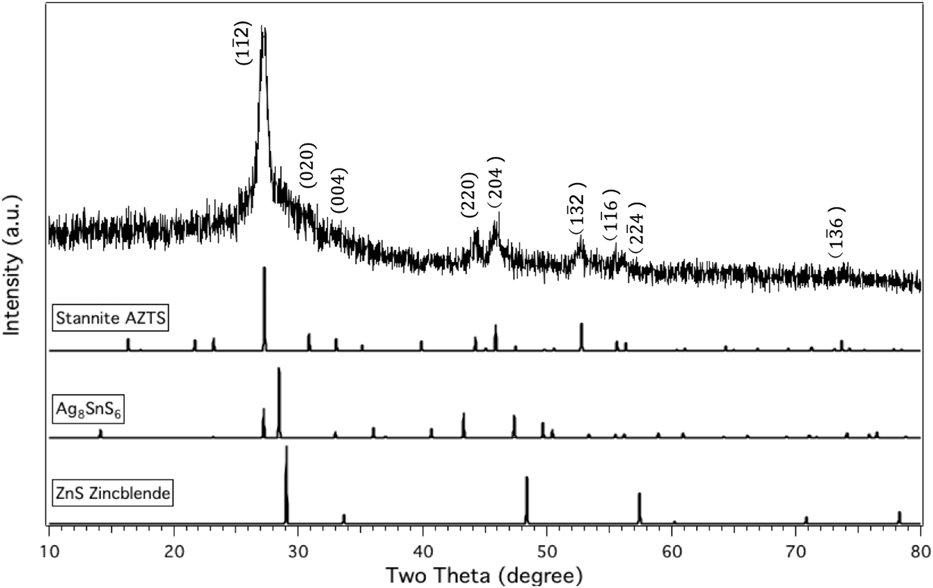
X-ray powder diffraction (as shown in Fig. 1) and TEM were used to characterize the phase purity of the as-fabricated AZTS nanoparticles as a function of reaction time. For reaction times shorter than 180 min, ZnS was detected as rod-shaped particles distinctly different from the AZTS nanoparticles. It was not possible to determine whether the AZTS nanoparticles were stannite structure (space group  $I\bar{4}3m$, ICSD#605734) or kesterite structure (space group
 $I\bar{4}$, as simulated using CrystalMaker using the lattice parameters reported by Gong et al.) The diffraction peak positions and intensities were similar for the two phases. Note that Gong et al. [Reference Gong, Tabata, Takei, Morihama, Maeda and Wada17] and Gautam et al. [Reference Gautam, Senftle and Carter29] have separately proposed that kesterite structure is more stable for AZTS than stannite. In previous studies, ZnS and Ag8SnS6 are commonly found as secondary phases in as-fabricated AZTS nanoparticles or thin films [Reference Cheng and Hong24, Reference Tsuji, Shimodaira, Kato, Kobayashi and Kudo26, Reference Sasamura, Osaki, Kameyama, Shibayama, Kudo, Kuwabata and Torimoto30]. No significant peaks corresponding to these secondary phases were observed by XRD or TEM for reactions times equal to 180 min. This situation is in contrast with characterization of phase content in CZTS nanoparticle synthesis, where some of the major peaks of CZTS overlap with Cu2SnS3 or ZnS. The peaks from AZTS nanoparticles are clearly distinguishable from zincblende zinc sulfide (space group
 $F\bar{4}3m$, ICSD #77090) and Ag8SnS6 (space group
 $F\bar{4}3m$, ICSD #605727).
X-ray diffraction pattern of nanoparticles collected from a 180-min reaction time and compared with standard stannite Ag2ZnSnS4 (ICSD#605734), zincblende ZnS (ICSD#77090), and Ag8SnS6 (ICSD#605727).

Hot injection of sulfur-oleylamine (s-OLA) and metal–salts–oleylamine (m-OLA) solutions at 250 °C was used to bypass temperatures that are favorable for the formation of binary or ternary phase(s). Compared to the precursor concentrations used in the reported synthesis of CZTS nanoparticles [Reference Miskin, Yang, Hages, Carter, Joglekar, Stach and Agrawal2, Reference Guo, Ford, Yang, Walker, Stach, Hillhouse and Agrawal21], precursor concentrations for AZTS synthesis were reduced to about 1/3 for two reasons: (i) at 65 °C, the solubility of Ag, Zn, and Sn precursors in OLA is lower than that of Cu, Zn, and Sn precursors and (ii) at higher concentrations, Ag, Zn, and Sn precursors provide a much more viscous solution, leading to poor mixing upon hot injection in the reaction medium and resulting in the formation of secondary phases. If secondary phases form and grow, it becomes more difficult for the rest of free ions to form AZTS with the correct stoichiometric ratio. This is especially true for SnS2, which tends to grow to a few hundreds of nanometers or even micron-sized disks within a few minutes [Reference Huang, Wang, Brahma, Wang and Huang31]. The starting precursor concentration is one of the key variables to suppress the nucleation and grain growth of the secondary phases.
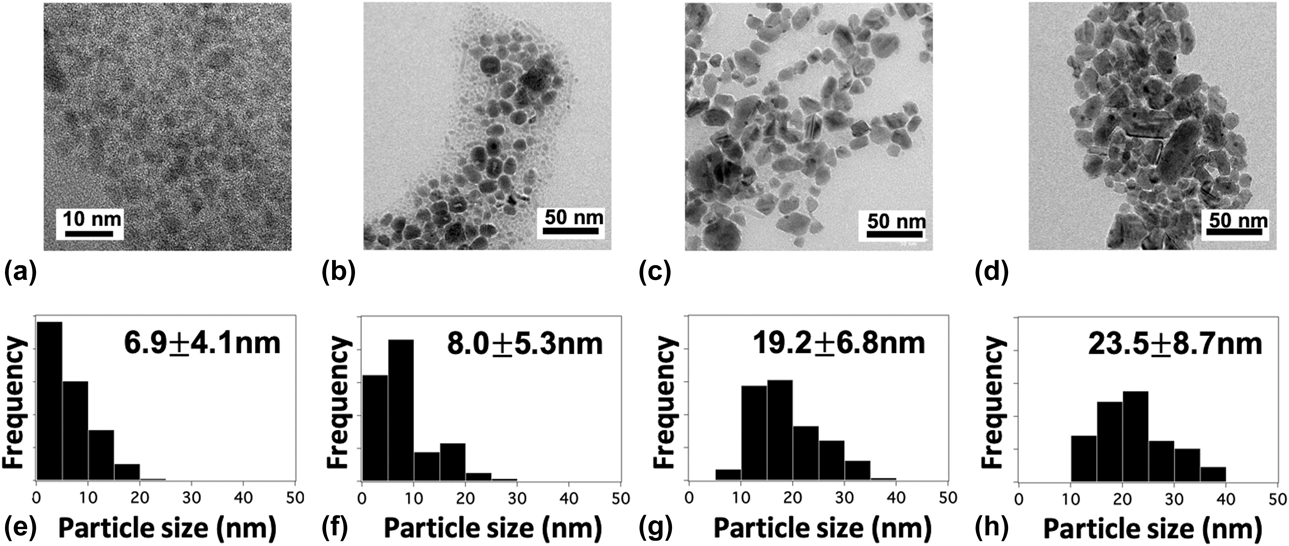
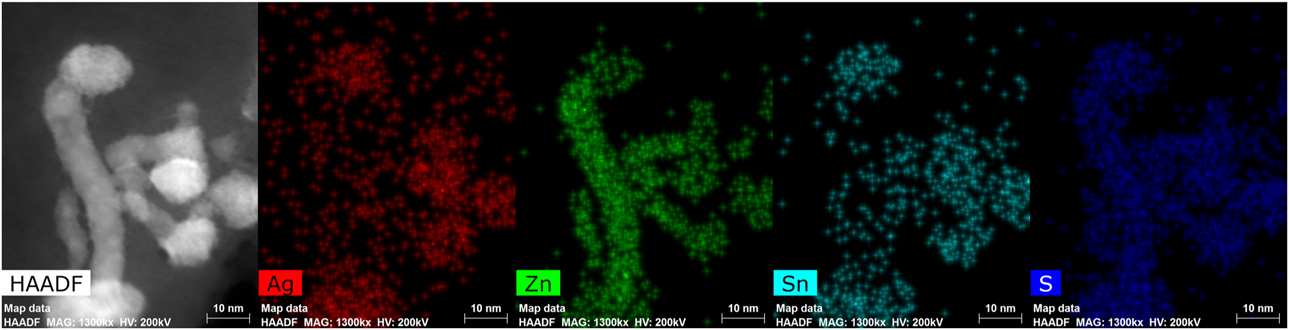
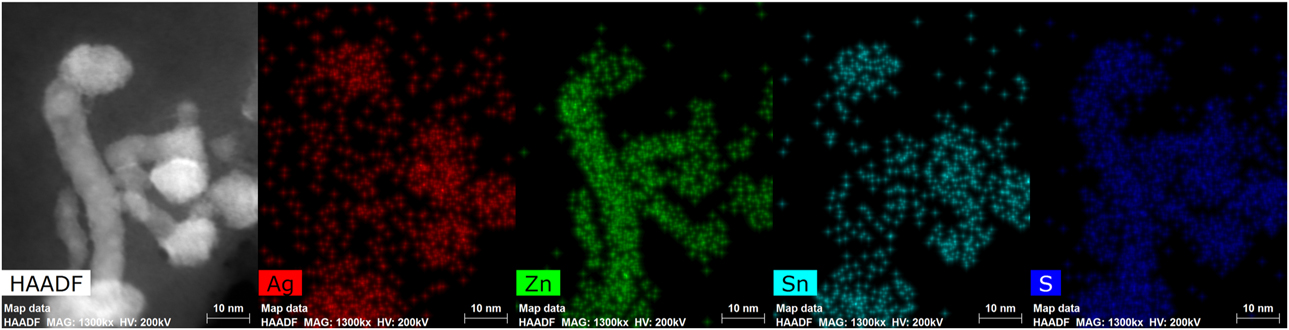
To study the phase and composition evolution of the nanoparticles, TEM images were taken for nanoparticles collected at reaction time periods of 10, 15, 60, and 180 min and are shown in Figs. 2(a)–2(d) with corresponding size distributions in Figs. 2(e)–2(h). Most of the 10-min nanoparticles are small, round nanoparticles with a diameter less than 10 nm. After 15 min, two different shapes of nanostructures were observed: round particles and nanowires. STEM-EDS mapping (Fig. 3) reveals that the round particles primarily contain Ag, Zn, Sn, and S, whereas the nanowires are ZnS. After 60 min of reaction, the number of nanowires is reduced significantly, and the AZTS nanoparticles have grown to an average size of 19.2 nm and remain equiaxed. For the 180-min sample, the size of the AZTS nanoparticles has increased to about 23 nm and no ZnS particles were observed in STEM-EDS.
TEM images showing typical particle shapes and sizes and the corresponding size distributions for the collected AZTS nanoparticles at various reaction time periods: (a) & (e) 10 min, (b) & (f) 15 min, (c) & (g) 60 min, and (d) & (h) 180 min.

Energy dispersive X-ray spectroscopy elemental mapping from scanning transmission electron microscopy for 15 min nanoparticles.
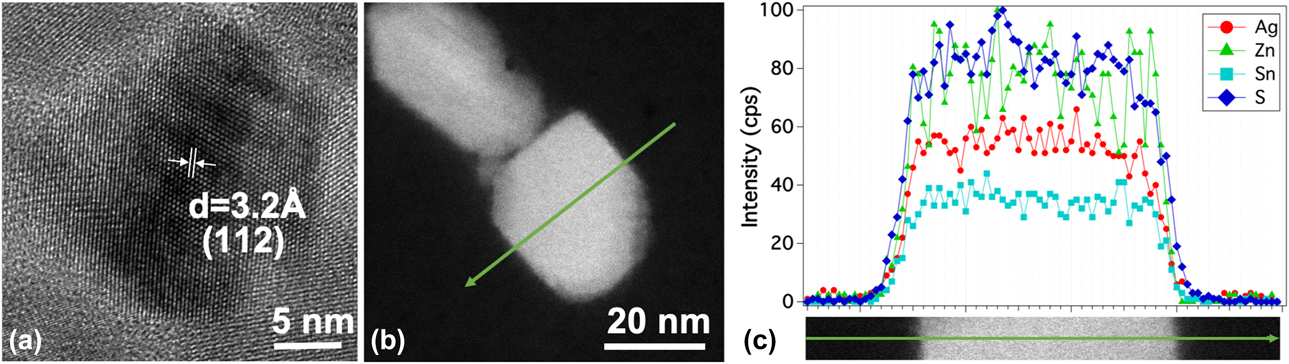
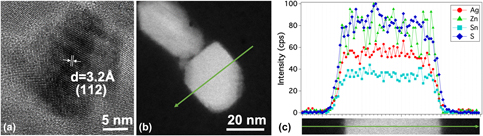
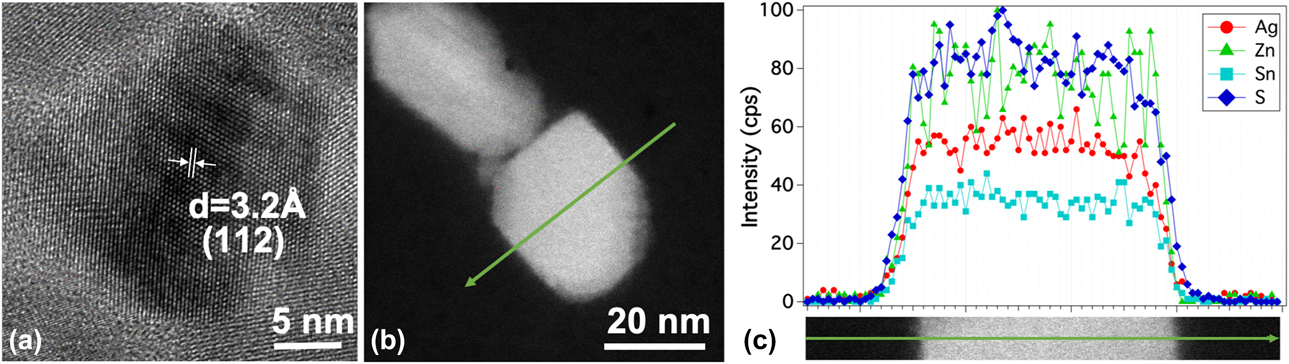
The microstructure and compositional profile of the individual 180-min AZTS nanoparticles were examined by HRTEM/STEM-EDS. The HRTEM image in Fig. 4(a) shows a single-crystal AZTS nanoparticle with a d-spacing = 0.32 nm, corresponding to the (112) plane. The overall composition of AZTS nanoparticle is Ag2.0Zn1.2Sn1.0S3.7 (the atomic percentages separately measured in STEM-EDS for Ag, Zn, Sn, and S were 25.3 ± 3.4, 15.3 ± 2.3, 12.7 ± 1.9, and 46.7 ± 3.4, respectively). The distributions of Ag, Zn, Sn, and S within an individual nanoparticle are presented in Fig. 4(c). The EDS line scan across the nanoparticle shows that Ag, Sn, and S profiles are uniform inside the particle, whereas Zn is more variable. This is likely because Zn is incorporated into the particle at a later stage as the ZnS nanowires disappear.
(a) HRTEM image of an AZTS nanoparticle; (b) STEM high angle annular dark-field (HAADF) image of AZTS nanoparticles; (c) STEM-EDS line scans for nanoparticles showing the intensity profiles of Ag, Zn, Sn, and S respectively.
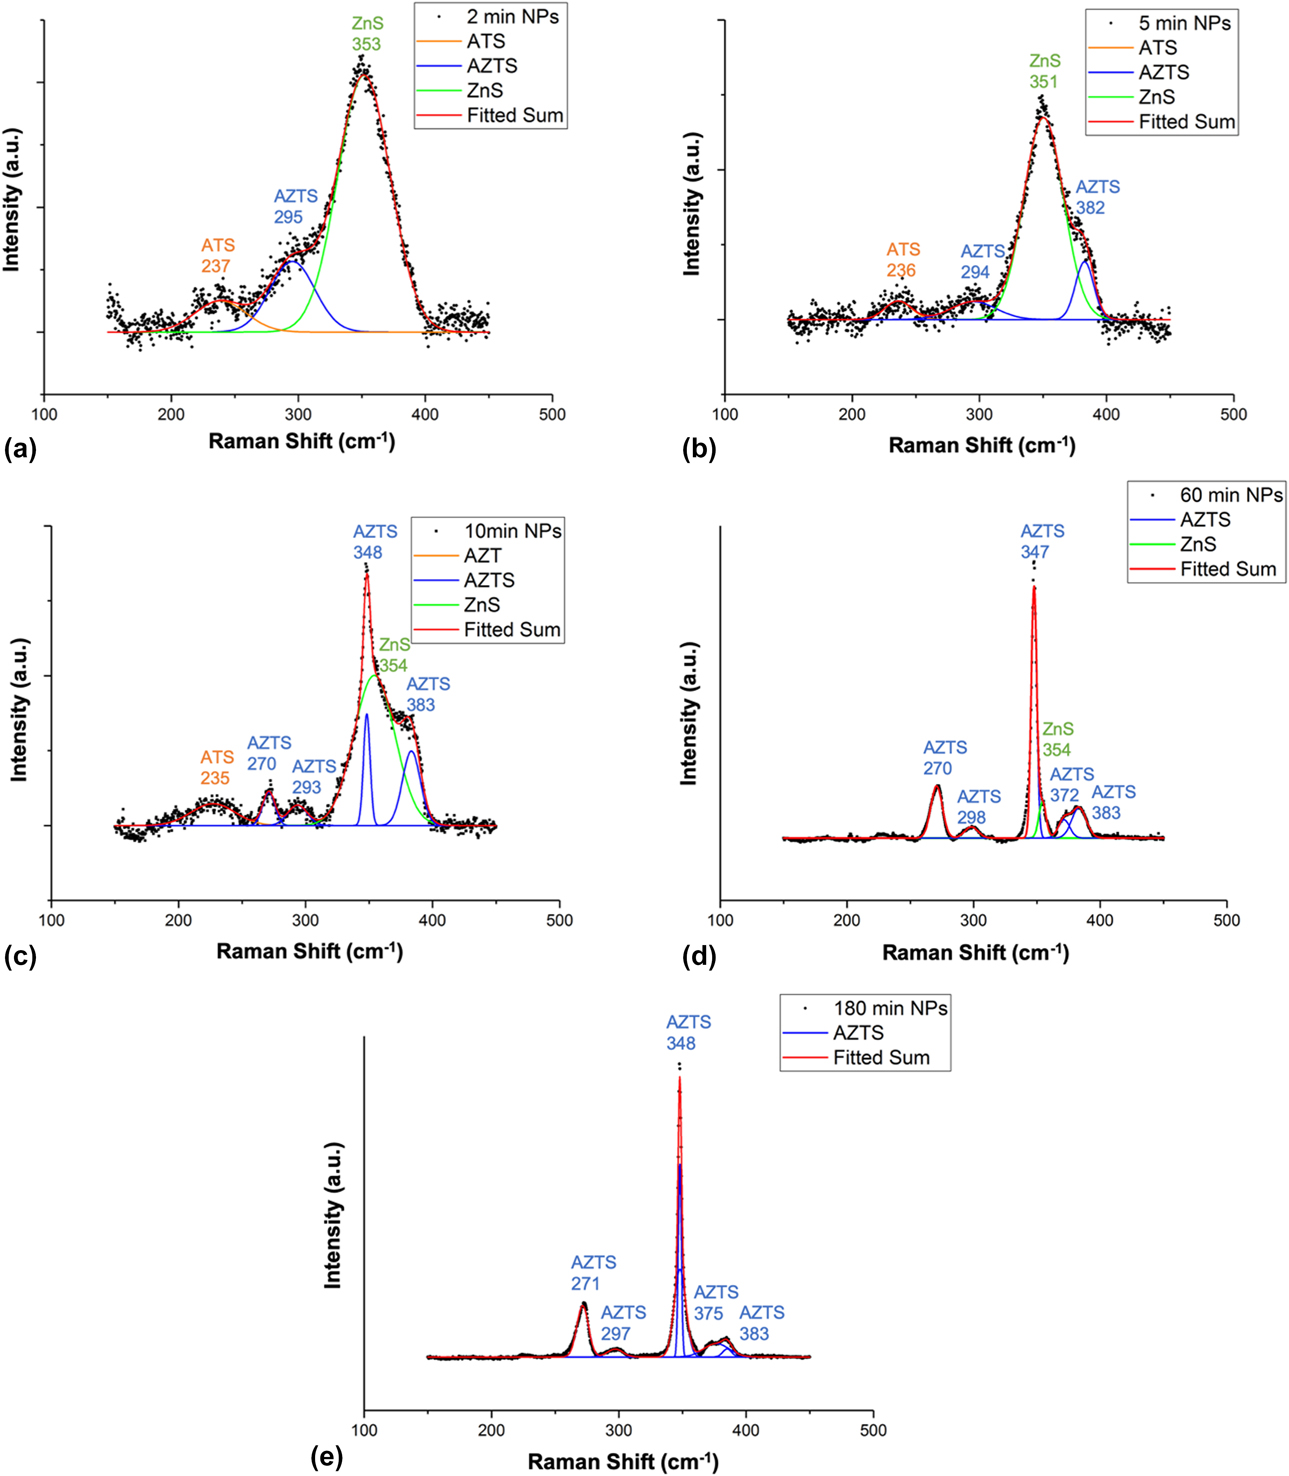
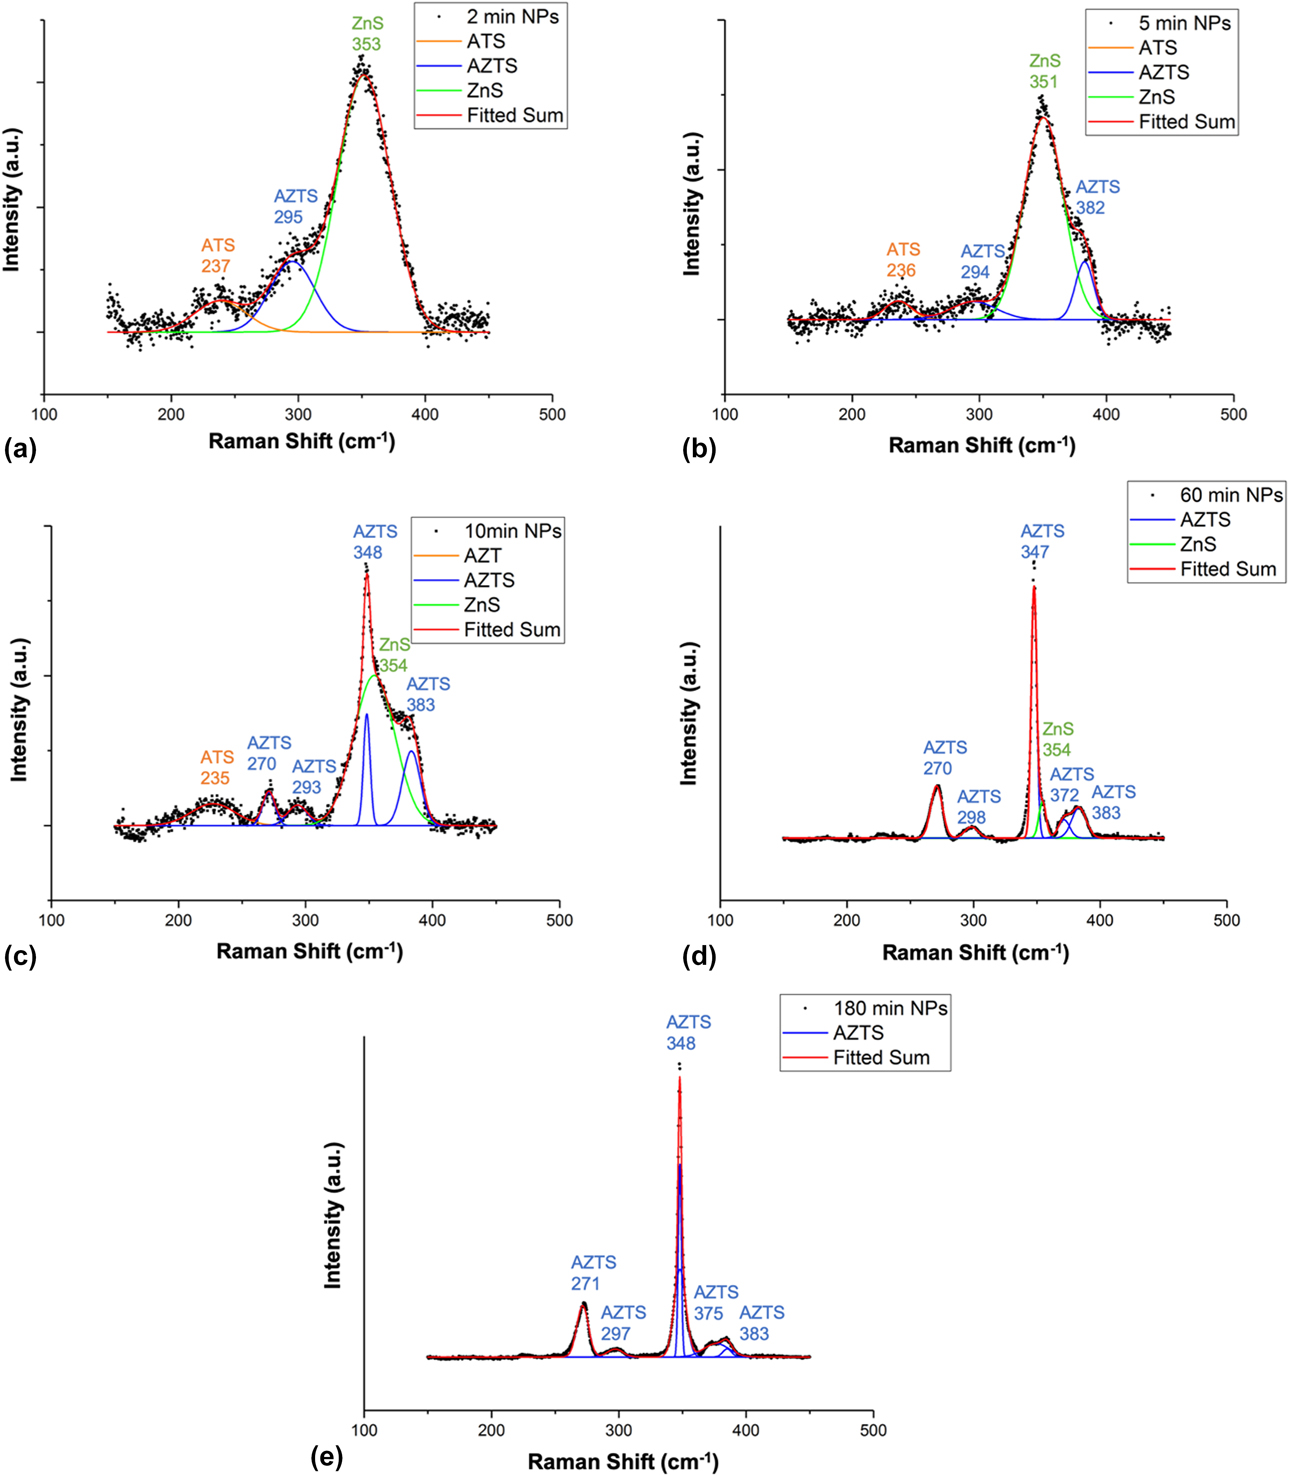
When the nanoparticles are at an initial stage of formation, i.e., the diameters of the nanoparticles are less than 10 nm, it is very difficult to determine the phases and composition in STEM due to spatial resolution and signal intensity limitation. To explore the nanoparticle phase transformation at different growth stages, we also applied surface-enhanced Raman spectroscopy (SERS) for the early stage synthesis as SERS shows stronger intensity and more details than conventional Raman spectroscopy [Reference Tan, Lee, Pedireddy, Baikie, Ling and Wong32]. Aliquots were withdrawn at 2, 5, 10, 60, and 180 min, and their Raman spectra are shown in Figs. 5(a)–5(e), respectively. After 2 min of reaction, three major peaks are observed in SERS. The broad peak near 237 cm−1 corresponds to silver tin sulfide (ATS) compounds, primarily Ag8SnS6 and Ag4Sn3S8. Another small peak is at 295 cm−1 corresponding to the AZTS phase. The strongest peak for 2 min is located at 353 cm−1 corresponding to ZnS. After 5 min, another AZTS peak appears at 382 cm−1. After 10 min of reaction, four peaks are observed corresponding to AZTS (270 cm−1, 292 cm−1, 348 cm−1, and 383 cm−1), whereas the ZnS peak (354 cm−1) and the ATS peak (235 cm−1) remain significant. After 60 min of reaction, the peak from AZTS phase (347 cm−1) is further enhanced denoting higher crystallinity of AZTS. At the same time, the ATS peak (∼236 cm−1) disappears and the ZnS peak (354 cm−1) is reduced to a small shoulder. Finally, after reaction for 180 min, the Raman peak for ZnS has disappeared and only AZTS peaks are observed, which indicate the phase purity of AZTS, in agreement with the STEM-EDS results.
SERS spectra of nanoparticles extracted at (a) 2 min, (b) 5 min, (c) 10 min, (d) 60 min, and (e) 180 min.
From SERS, it is observed that the formation mechanism for the AZTS nanoparticles is quite different from that of CZTS reported in the prior studies [Reference Tan, Lee, Pedireddy, Baikie, Ling and Wong32]. In the CZTS case, Cu2−xS nucleates first, then Sn4+ and Zn2+ diffuse into Cu2−xS nanoparticles successively to form CZTS [Reference Tan, Lee, Pedireddy, Baikie, Ling and Wong32, Reference Liao, Jao, Shyue, Chen and Su33, Reference Hou, Benito-Alifonso, Kattan, Cherns, Galan and Fermín34, Reference Collord and Hillhouse35]. There is a three-step growth from Cu2−xS to Cu3SnS4 (CTS) then CZTS. However, in our case, no Ag2S is observed from the SERS study of the early stage reaction. It is probably because the formation energy for Ag2S is much higher than Cu2−xS [Reference Lide36], so ZnS formation is the preferred precipitation reaction when cations are firstly injected and the temperature drops to a lower level (∼205 °C) after injection. This also explains the difficulty in creating homogeneous (Ag, Cu)2ZnSnS4 solid solution when Cu and Ag precursors were presented together in the nanoparticle synthesis [Reference Hages, Koeper and Agrawal10]. According to the STEM-EDS and SERS analysis, when s-OLA and m-OLA are first injected, ZnS, ATS, and AZTS all start to nucleate. As the temperature increases back to 250 °C, AZTS nanoparticles are more thermodynamically preferred and grow larger with good crystallinity, whereas ZnS and ATS nanoparticles begin to decrease in size as reaction proceeds beyond 10 min and eventually disappear completely.
Compared with previous research on AZTS nanoparticle synthesis [Reference Sasamura, Osaki, Kameyama, Shibayama, Kudo, Kuwabata and Torimoto30], the secondary phases ZnS or Ag8SnS6 are eliminated. There are two major differences between previous work and our reaction. First, the sulfur sources are different. Sasamura et al. used ammonium N,N-diethyldithiocarbamate as the sulfur source, producing AZTS along with impurity phases [Reference Sasamura, Osaki, Kameyama, Shibayama, Kudo, Kuwabata and Torimoto30]. Embden et al. used dodecanethiol (DDT) as both cosolvent and the sulfur source to synthesize nanostructured Ag–Ag8GeS6, whereby Ag2S nuclei were first formed followed by Ag in the presence of DDT [Reference van Embden, Bourgeois, Della Gaspera, Waddington, Yin, Medhekar, Jasieniak and Chesman37]. This is quite different from the CZTS case, in which only wurtzite CZTS nanoparticles are produced in the presence of DDT [Reference Zhou, Hsu, Duan, Bob, Yang, Song, Hsu and Yang38, Reference Yang, Miskin, Hages, Hanley, Handwerker, Stach and Agrawal39]. The difference is probably because Ag+ rends to be reduced to elemental state compared with Cu+ when DDT acts as a reducing agent at elevated temperatures. In our work, elemental S dissolved in OLA is used, releasing high reactive H2S during injection [Reference Thomson, Nagashima, Macdonald and Ozin40] and resulting in AZTS nanoparticles instead of elemental Ag [Reference Li, Lui, Lam, Xi and Lam41, Reference Zou, Su and Jiang42]. Second, the metal salts used previously are acetates which have weaker bonds between cations and anions than acetylacetonate salts used in our study. With zinc acetate, Zn2+ will be released more easily leading to the formation of ZnS [Reference Tan, Lee, Pedireddy, Baikie, Ling and Wong32, Reference Zou, Su and Jiang42].
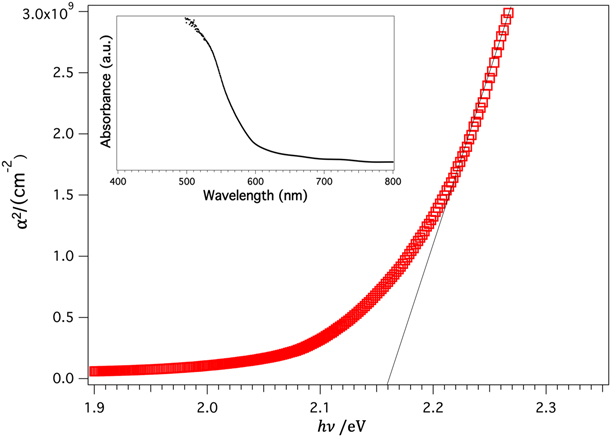
Optical properties of these AZTS nanoparticles were examined using UV-vis measurements. The optical band gap value is extracted from the use of following equation:
 $$\alpha\;\infty \;{\left( {E - {E_{\rm{g}}}} \right)^n}\quad ,$$
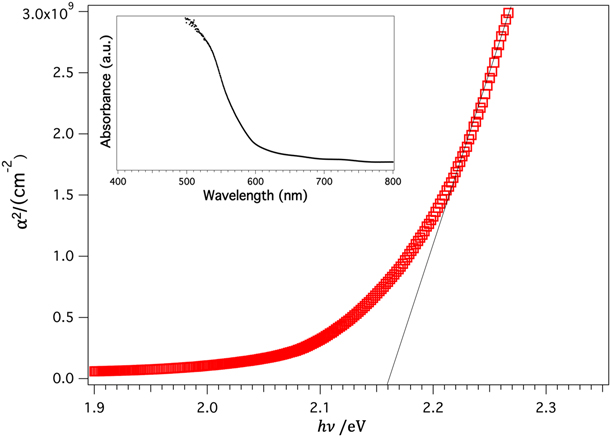
in which α is the absorption coefficient calculated from the absorption spectrum for a film of thickness ∼800 nm, E is the incident photon energy, and E g is the band gap. For a direct band gap material, n = 1/2. As shown in Fig. 6, the observed band gap is 2.16 eV, higher than the band gap (2.0 eV) of AZTS bulk material [Reference Tsuji, Shimodaira, Kato, Kobayashi and Kudo26].
Band gap of as annealed AZTS thin film extracted from UV-vis spectroscopy. The picture on the upper left corner is the absorption spectrum.
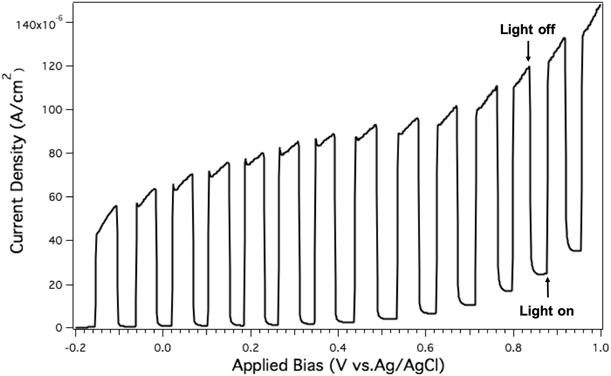
Considering the wide band gap of AZTS, researchers are working to realize the potential of AZTS as a photocatalyst for H2 production [Reference Cheng and Hong24, Reference Li, Chai, Peng, Mao and Zan25]. Photoelectrochemical (PEC) measurements were conducted to investigate the potential of AZTS nanoparticle films for photocurrent generation in 0.1 M K2SO4 aqueous solution. A three-electrode system is used to measure the photon response of nanoparticle films at a range of −0.2 to 1.0 V versus the Ag/AgCl reference electrode (Fig. 7) with manual chopping every 0.05 V. The photocurrent density increases with applied voltage up to ∼100 µA/cm2, suggesting that the AZTS is an n-type semiconductor [Reference Sasamura, Osaki, Kameyama, Shibayama, Kudo, Kuwabata and Torimoto30, Reference Balow, Miskin, Abu-Omar and Agrawal43]. Some kinetic instability of the photocurrent was observed for the first time when the light was switched on. Additionally, compared with the previous AZTS thin films made by co-sputtering [Reference Cheng and Hong24], photocurrent generated by the pure-phase nanoparticle film was about 1/3 of the best co-sputtered large grain films. The limited current density may be resulted from the surface states of the nano-sized particles, where electrons and holes can combine at grain boundaries. By using these single-phase particles with desirable band gap and high crystallinity, better PEC performance of AZTS film is expected with further improvement on micron-sized large grain film formation, as well as optimization of back-contact material.
Photocurrent versus applied bias (relative to Ag/AgCl electrode) curve of AZTS nanoparticles coated on FTO glass.

Conclusion
In summary, single-phase, semiconducting nanoparticles of AZTS have been successfully synthesized through a solvothermal process. The hot-injection reaction allows production of AZTS nanoparticles with uniform composition. Based on the analysis of the intermediate products formed at different reaction stages, the reaction pathways were measured and formation mechanisms for single-phase AZTS nanoparticles were proposed. The similarities as well as differences between CZTS and AZTS nanoparticle synthesis are discussed in this work. It is expected that the proposed solution-based formation mechanisms for single-phase AZTS presented here will contribute to future silver-based nanoparticle synthesis and device fabrication research. In terms of electronic properties, AZTS nanoparticle films were found to have a band gap of 2.16 eV and were capable of generating a 0.1 mA/cm2 photocurrent at a bias of 0.8 V versus Ag/AgCl in K2SO4 solution, showing its potential as a light absorber material for photocurrent generation. Its application as a precursor for AZTSe absorber films is also under investigation and solution-processed AZTSe thin-film solar cells are expected in the near future.
Method
Materials
For nanoparticle synthesis, silver acetylacetonate (98%, Sigma-Aldrich), zinc acetylacetonate hydrate (99.995% trace metals basis, Sigma-Aldrich), and tin(IV) bis-(acetylacetonate) dichloride (98%, Sigma-Aldrich) were used as cation sources and stored under N2 atmosphere. Note that silver acetylacetonate can degrade at room temperature and was stored at 4 °C in the freezer inside glovebox (N2 filled, oxygen and moisture level less than 0.1 ppm) when not in use. Elemental sulfur (99.998% trace metals basis, Sigma-Aldrich) was used as the anion source. Oleylamine (OLA) (>98%, Sigma-Aldrich) was degassed by three freeze–pump–thaw cycles prior to use. Methanol (99.9%, Fisher), 2-isopropanol (>99.9%, Fisher), and hexane (99% pure, mixture of isomers, Fisher) were used as received to wash nanoparticles. Potassium sulfate (K2SO4, > 99.0%, Sigma-Aldrich) was dissolved at 0.1 M concentration in deionized water (18.2 MOhm cm at 25 °C) as electrolyte for PEC measurement.
Nanoparticle synthesis and washing
The kinetic transformation of AZTS nanoparticles was studied using an OLA-based hot-injection method. Related synthesis procedures for Cu2ZnSnS4 (CZTS) nanoparticles have been reported in the literatures [Reference Miskin, Yang, Hages, Carter, Joglekar, Stach and Agrawal2, Reference Guo, Ford, Yang, Walker, Stach, Hillhouse and Agrawal21, Reference Yang, Miskin, Carter, Agrawal and Stach44].
Typically, 0.6 mmol silver acetylacetonate, 0.33 mmol zinc acetylacetonate hydrate, and 0.33 mmol tin(IV) bis-(acetylacetonate) dichloride were dissolved in 8 mL OLA under N2 atmosphere at 65 °C (m-OLA). In addition, 6 mmol S was dissolved separately in 6 mL OLA under N2 at 65 °C (s-OLA). To start the reaction, 12 mL of OLA was added into a 100-mL three-neck flask and stirred at 300 rpm. The OLA was heated to 35 °C and purged with argon 3 times. The solution was then heated to 135 °C for a second 3-cycle purging to remove the gases and light impurities. The OLA was then heated up to 250 °C. When OLA reached 250 °C, 4.5 mL s-OLA solution was injected through a syringe quickly. After 10 s, 6 mL of m-OLA was quickly injected into the system. The reaction was kept at 250 °C with continuous stirring under argon atmosphere. Aliquots (2 mL) were taken at 10, 15, and 60 min of reaction time and quenched into 10 mL of IPA. These aliquots were centrifuged at 14,000 rpm to extract the nanoparticles. Three hours after injection, the reactant flask was removed from the heating mantle and cooled down to 50 °C with blowing N2. When the reactant reached room temperature, it was then pipetted out into a Teflon-coated centrifuge tube and mixed with equal volume of IPA. The mixture was centrifuged at 14,000 rpm for 5 min. After the first centrifuging, the precipitant pellet was recovered and dispersed in 3 mL hexane. After the precipitant was fully dispersed in hexane, ∼18 mL mixture of 70% IPA and 30% methanol was added into the centrifuge tube and centrifuged at 1000 rpm for 5 min. This time, the precipitant was discarded and the supernatant was saved. The nanoparticle containing supernatant was then centrifuged at 16,000 rpm for 5 min to collect the nanoparticles as a precipitate. These nanoparticles were redispersed in 3 mL hexane with subsequent addition of 18 mL of 7:3 volume ratio mixture of IPA and methanol. The nanoparticles were recollected as precipitant pellet by centrifuging at 16,000 rpm for 5 min and discarding the upper layer liquid. This procedure of hexane dispersion followed with alcohol washing was repeated 3 times in total, as was typically performed for CZTS nanoparticle [Reference Miskin, Yang, Hages, Carter, Joglekar, Stach and Agrawal2]. The final precipitant was dried under Ar flow at ∼2 Lpm for about 25 min and then sealed in a container under N2 atmosphere.
Film deposition
The synthesized nanoparticles (3 h reaction time) were dispersed into hexanethiol at the concentration of 300 mg/mL to form a nanoparticle ink. This ink was doctor bladed onto molybdenum-coated (800 nm) soda-lime glass or fluorine-doped tin oxide (FTO)–coated glass (∼13 Ω/sq surface resistivity). The as purchased FTO glass was rinsed by IPA and methanol and then ultrasonically cleaned in Alconox detergent solution followed by ultrapure water wash prior to usage. Each time, 15 µL ink was pipetted out for ∼2.5 × 5 cm2 coating area. The coated film was dried for 4 min at room temperature and then annealed at 300 °C for 1 min in air. Each substrate was coated and annealed twice.
Characterization
For characterization by X-ray diffraction (XRD; Rigaku SmartLab diffractometer), the nanoparticle films were prepared by drop casting nanoparticle ink on soda-lime glass. The morphologies and crystal structures of the sulfide nanoparticles were measured by transmission electron microscopy (TEM; FEI Talos) with a 200 kV electron beam. For TEM sample preparation, the nanoparticle inks were diluted with toluene at about 1:1000 volume ratio and ultrasonicated for 15 min prior to deposition. The suspension was drop casted onto an ultrathin carbon on carbon lacey support film (gold grid, 400 mesh, Ted Pella) for (HR)TEM or on a silicon nitride 5 nm thick TEM window (9 small windows, SIMPore Inc.) for STEM/EDS. The absorbance of AZTS nanoparticles was measured by a PerkinElmer Lambda 950 spectrophotometer through an AZTS nanoparticle ink–coated FTO glass sample. Surface-enhanced Raman Spectra (SERS) were acquired by HORIBA Jobin Yvon LabRam HR800 with an excitation laser wavelength of 633 nm. The nanoparticle samples for SERS measurement were drop casted on Au substrates (50 nm thick, thermally evaporated on Mo glass) at the concentration of 4 mg/mL in hexane dispersion. PEC measurement was conducted on Digi-Ivy D2011 single channel potentiostat with a solar simulator (Newport 300 W Xe arc lamp) under AM 1.5G condition.
Acknowledgment
This study was financially supported by NSF under grant #1534691-DMR (DMREF: Rapid Design of Earth Abundant Inorganic Materials for Future PVs). The authors would like to thank Dr. Scott McClary for assisting on photoelectrochemical measurements.