

Introduction
Due to forest destruction, 50–80% of the original forest cover in Madagascar has been lost since human arrival (Green and Sussman, Reference Green and Sussman1990). Deforestation has caused fragmentation, increased the patchiness of the remaining forest, and created mosaics of small fragments at various stages of secondary growth (Sussman et al., Reference Sussman, Green and Sussman1994). As a consequence of deforestation, many endemic species in Madagascar are threatened and near extinction (Brooks et al., Reference Brooks, Mittermeier, Mittermeier, da Fonseca, Rylands, Konstant, Flick, Pilgrim, Oldfield, Magin and Hilton-Taylor2002; Burgess et al., Reference Burgess, D'Amico Hales, Ricketts and Dinerstein2006).
In Madagascar, 95% of the carabid species are endemic and are found only in a few localities in low numbers (Jeannel, Reference Jeannel1946, Reference Jeannel1948, Reference Jeannel1949; Basilewsky, Reference Basilewsky1973, Reference Basilewsky1985). Because of scarcity of studies, distributional range, habitat requirements and relative abundance are unknown for most of the Malagasy species. However, knowledge of their ecology is essential for successful conservation.
Carabid species vary in distributional ranges and specializations, from patchily distributed specialists to geographically wide-ranging generalists (Eversham et al., Reference Eversham, Roy and Telfer1996). Occurrence of species depends on several abiotic and biotic factors including moisture, temperature, competitors and food availability (Thiele, Reference Thiele1977; Lövei and Sunderland, Reference Lövei and Sunderland1996). Very little species-specific information is available for Malagasy carabids and it is unknown how specialized they are to certain habitats, plants or prey items.
Occurrence of a high proportion of rare species is a general pattern of community structure in both marine and terrestrial species assemblages (Gray et al., Reference Gray, Bjørgesæter and Ugland2005). A species can be or become rare in several different ways, such as when it has a small distributional range, low local abundance or narrow habitat requirements (Rabinowitz, Reference Rabinowitz and Synge1981). Rare species may exist as a few large, many small, or few small populations (Kean and Barlow, Reference Kean and Barlow2004). In general, rare species may also have lower reproductive capacity and/or poorer dispersal ability (Gaston and Kunin, Reference Gaston, Kunin, Kunin and Gaston1997).
Relationships between abundance and distribution have been studied in a wide variety of taxa, habitats and scales (Brown, Reference Brown1984; Blackburn et al., Reference Blackburn, Cassey and Gaston2006). In most cases, these relationships are positive such that locally abundant species have wide distributional ranges or occupy a large number of sites, while rare species have low local abundances and narrow distributional ranges. In addition, species declining in abundance often decline also in the number of sites they occupy and vice versa. For species that occur in low abundances and have a narrow distributional range, this might represent 'double jeopardy' and an increased risk of extinction (Lawton, Reference Lawton1993, Reference Lawton1996).
The aim of this study was to document community composition, distribution patterns and habitat preferences of carabid species by determining: (1) which species are rare and which are common, (2) how species are distributed and if abundance and occupancy are related, and (3) which habitat types species prefer – primary forest, secondary forest or human-modified areas. The study was conducted in forested sites in the Ranomafana National Park (RNP) and nearby deforested areas.
Materials and methods
Study sites
Research was conducted in RNP, Madagascar during 2000–2005. The park is located in the south-eastern region of the country, between 47°18′–47°37′E and 21°02′–21°25′S, approximately 90 km from the Indian Ocean. The core area (43,500 ha) of the park is mountainous and contains relatively undisturbed lowland rain forests, cloud forests and high-plateau forests (Grenfell, Reference Grenfell1995). The altitudinal gradient varies between 500 and 1500 m above sea level (masl) though most of the park lies between 900 and 1200 masl. The park is surrounded by a 3-km-wide peripheral zone, which includes villages and cultivations.
Carabids were collected from four study areas (two primary forest areas, a secondary forest area and a non-forested area), and from 209 sampling sites (size 10 × 10 m). Most of the sites (147) were located in low montane secondary forest (Talatakely), which was selectively logged in 1986–1987. Two of the study areas were located in primary forests. Vatoharanana (39 sites) and Valohoaka (seven sites) are montane primary rain forests 4 and 8 km south from Talatakely, respectively. There have been very slight selective loggings in Vatoharanana. Valohoaka is undisturbed.
The fourth study area with 16 sampling sites was located in the peripheral (buffer) zone of RNP just outside the protected forest. In that zone, natural vegetation is severely degraded and sampling sites included a variety of secondary vegetation formations, e.g. rice fields, abandoned fields, banana cultivations, old pine cultivation, young 'forests', which were dominated by Harungana madagascariensis Lamarck ex Poiret (Clusiaceae) and Psidium cattleianum Sabine (Myrtaceae), and edge forest just outside of the protected area. The altitudinal gradient of sites varied between 800 and 900 masl in the peripheral zone, and between 900 and 1000 masl in Talatakely. Altitudes of sites in Vatoharanana were approximately 1100 masl, and in Valohoaka ~1200 masl.
Collecting methods
Carabids were collected by hand and by trunk traps throughout the years 2000–2005. Collecting effort was standardized so that in each study site one person collected by hand for 1 h. Hand collecting included beating or shaking trees, turning stones, breaking into decaying logs, and removing bunches of dead leaves from shrubbery. Such collecting was conducted during the daytime only.
Total collecting times varied between areas such that 345 h were spent collecting in Talatakely, 166 h in Valohoaka, 201 h in Vatoharanana and 45 h in the peripheral zone. Several sites were visited more than once during the study period, but each collecting time is analysed as a separate sample.
Two different sizes of circle trunk traps were tested. The larger one was 82 cm and the smaller one 35 cm wide at the base. The traps were attached directly to the trunks of living trees for gathering specimens walking alongside the trees. Both trap types were left for 24 h in one site and then turned upside down, and left for another 24 h. In total, two traps were operating for 48 h in 24 sites (six sites in each of the four areas).
Species identification
A total of 4314 collected specimens could be sorted into 125 ’morphospecies’. Seventy-two of these (3177) specimens could be assigned to known species on the basis of literature (Jeannel, Reference Jeannel1946, Reference Jeannel1948, Reference Jeannel1949; Basilewsky, Reference Basilewsky1973, Reference Basilewsky1985), and comparison with identified specimens in the collections of the Musée Nationale d'Histoire Naturelle, Paris. The remaining 53 morphospecies could be identified to genus- or subfamily-levels only.
Most of the species were identified in collaboration with Dr David Kavanaugh (California Academy of Sciences, USA), who also is responsible for the descriptions of most of the new species. In addition, the rest of the material was identified by the following taxonomic specialists: Professor Achille Casale, University of Sassari, Italy (Callidiola), Dr Thierry Deuve, Musée Nationale d'Histoire Naturelle, Paris, France (Eucamptognathus and Tshitscherinellus) and Jiří Moravec (Pogonostoma). Nomenclature follows Lorenz (Reference Lorenz2005).
Statistical analysis
For estimating the total species richness, I used Chao 1 (Chao, Reference Chao1984) because it is based on the number of rare species (singletons and doubletons), which is a common feature in tropical species communities:

where S obs is the observed number of species in a sample, α is the number of observed species that are represented by a single individual (i.e. singleton) and β is the number of observed species represented by two individuals (i.e. doubleton) in the sample. For comparison, other species richness estimators Bootstrap, Abundance-base Coverage Estimator (ACE), and Jackknife (first and second) were also tested. Species accumulation curves (or sample-based rarefaction curves) for observed and estimated species richness (number of species) were computed using Estimate S (Colwell, Reference Colwell2005). Both curves were produced by randomizing sample order 50 times without replacement.
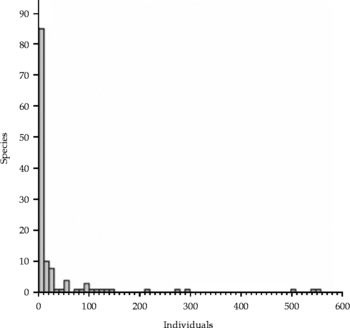
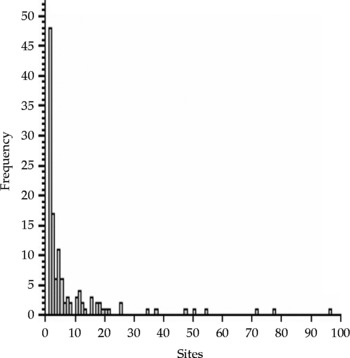
Community structure of carabids was studied by classifying species into abundance classes. The first class consisted of species which had less than ten individuals, the second class species between ten and 20 individuals, and so on. The distribution patterns of species were analysed by calculating the number of sites where each species was found.
Species abundance–occupancy relationship was studied using Pearson correlation coefficients. An attempt was made to correlate occupancy with: (1) total number of individuals per species and (2) average number of individuals per species per sample. A linear regression line with 95% mean prediction intervals was fitted to the scatterplot. The software used was SPSS.
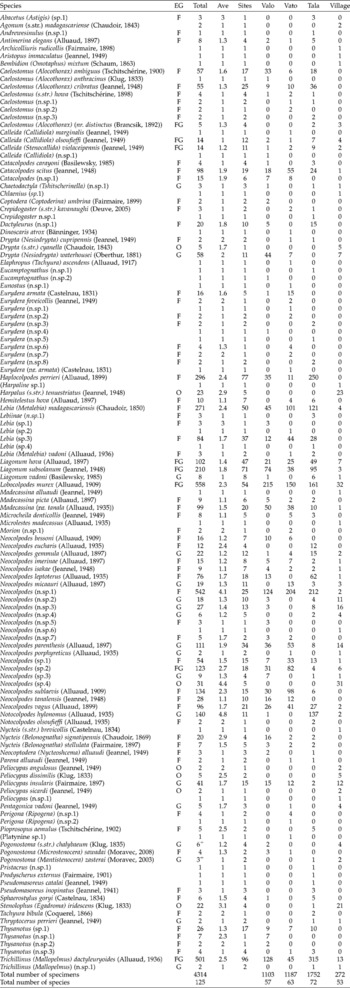
Differences of species abundances (the number of individuals) and occurrences between vegetation types (secondary forest, primary forests and village area) were also studied. Based on the data collected, species were classified as forest specialist (species preferring forest as their primary habitat), forest generalist (species occurring in many kinds of forests, from primary to degraded forests in the village region), generalist species (species having a wide distribution range from forest to degraded/open habitat) and open habitat species (species found from open habitats like fields). This classification is provided in Table 1 with a total list of species. Species represented by only one individual were not classified.
List of species, EG=ecological groups (F=forest specialist species, FG=forest generalist species, O=open habitat species and G=generalist species), total number of specimens/species), Ave (average number of specimens/species/sample) and numbers of individuals collected from each area

+ Part of the specimens collected also by trunk trap.
Results
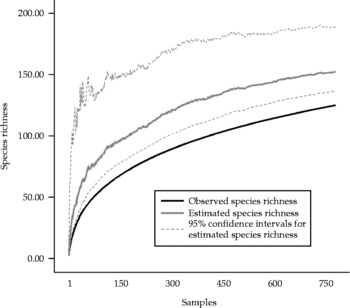
In total, 4314 specimens representing 125 species were collected (see Table 1). Almost 30% (38) of the species were new to science. Only six individuals, representing two species, were collected in the trunk traps. Neither the species accumulation curve for total observed nor that for total estimated species richness reached an asymptote, indicating that only part of the fauna was recorded. Based on the Chao 1 estimation, the total number of species is between 152 and 188 (Fig. 1). Results of other estimations for total species richness were: Bootstrap richness estimator = 143 species, ACE = 158 species, Jackknife richness estimators first-order = 167 species and second-order = 195 species.
Species accumulation curves for total number of species (species richness) and estimated (Chao 1) number of species with 95% confidence intervals

Community composition
Most of the species (88, ~69%) were recorded in very low abundances ( < 10 specimens), and 31 species were recorded only once. Furthermore, there were only a few species in the intermediate abundance classes (Fig. 2). The three most abundant species (Lobocolpodes murex, Trichillinus (Mallopelmus) dactyleuryoides and Neocolpodes (n.sp.1)) were very common (>500 specimens each) and accounted for ~36% of the total catch.
Community structure of carabids

Almost 40% (48) of the species were found only in one site and 100 species were recorded from ten or fewer sites (Fig. 3). Comparison of the three most common species, which had almost the same abundances, showed marked differences in their distribution; Trichillinus (Mallopelmus) dactyleuryoides was widely distributed (found in 43% of the sites), L. murex was intermediately distributed (found in 24% of the sites) and Neocolpodes (n.sp.1) was more restricted to certain sites (found in 11% of the sites). T. dactyleuryoides and L. murex inhabit a wide variety of forest habitats from primary to degraded forests, but Neocolpodes (n.sp.1) was mainly found in the protected forest area (see Table 1).
Number of species (frequency) and sites (occupancy)

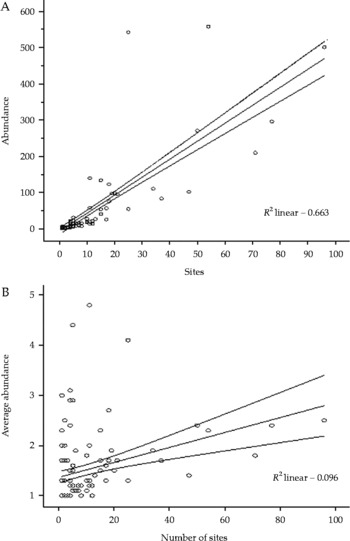
Relationship between total abundance (number of individuals found for a species) and occupancy (number of sites occupied by a species) was positively correlated (Pearson's correlation coefficients 0.814, P < 0.01) (Fig. 4A). Average abundance was also significantly correlated with occupancy at the 0.01 level (Fig. 4B).
A, relationship between total abundance (number of individuals within species) and occupancy (number of sites) for the species collected (circles). B, relationship of average abundance and occupancy. Linear regression line is fitted with 95% mean prediction interval.

Habitat preferences of species
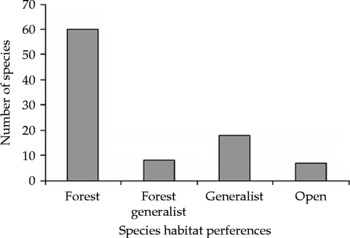
Classification of the species by apparent preferred habitat type showed that ~70% of the classified species preferred forest as their primary habitat (Fig. 5). Most of these were classified as forest specialists, because they were not found in the peripheral zone. Almost 20% of the species were habitat generalists, which were collected from a wide range of habitats from forest and peripheral zone sites. Less than 10% of the species were found only from open habitat sites in the peripheral zone.
Numbers of species classified as forest specialist, forest generalist, generalist and open habitat species

Most of the species (72) and individuals (1752) were collected from the secondary forest at Talatakely, and fewest species (53) and individuals (272) from the buffer zone area. The two primary forest areas were intermediate between these two. However, because the greatest collecting effort was made in the secondary forest area and the least effort in the buffer zone area, these results should be considered as preliminary. In addition to differential collecting effort, differences in the months of collecting may have impacted the results. Collections were conducted in the buffer zone area only during the rainy season, when abundances are in general the highest, but were conducted in the other areas also during other times of the year.
Discussion
This study found high species richness and a relatively large proportion (25%) of new species in the carabid beetle fauna of RNP. High number of species, new species and singletons are common results of previous insect studies in the tropics (e.g. Wolda, Reference Wolda, Leigh, Rand and Windsor1983; Novotný and Basset, Reference Novotný and Basset2000; Lucky et al., Reference Lucky, Erwin and Witman2002). The community structure of carabids observed in this study, with many rare, very few abundant, and almost no species in the intermediate abundance class, was similar also to that seen in a mature boreal-forest (Niemelä, Reference Niemelä1993).
In this study, most of the species (88, ~69%) were recorded in very low abundances ( < 10 specimens) and 31 species were found only once during the 5-year collecting period. It seems that rarity is a community character in Malagasy carabid beetles, but identifying the causes of rarity requires more specific information about the species’ ecology. Low abundances of species might also be due to methodological error. For example, abundances of species might be found to be higher using some other collecting method because the beetles prefer a microhabitat (e.g. forest canopy) that was not sampled well by hand collecting. Some species might also be more abundant in other areas nearby or elsewhere in Madagascar.
Almost 100 species (80%) were recorded from less than ten sites, and the most widely distributed species was found in only 43% of the sites; so most of the species were scarce and only a few in this study were distributed widely. This can be explained, at least in part, by the used methodology. In any inventory effort, rare species tend to accumulate slowly (Martikainen and Kaila, Reference Martikainen and Kaila2004); and if the sampling is insufficient, they might not be recorded at all despite their occurrence.
Although the abundance–occupancy relationship was positive among the collected carabid species, the three most common species had very different distributional ranges, from very patchily to widely distributed. Application of the abundance–occupancy relationship, such as for predicting species abundance from occupancy measures for conservation or pest management purposes (Gaston et al., Reference Gaston, Blackburn, Greenwood, Gregory, Quinn and Lawton2000), should therefore always be done with caution. Warren et al. (Reference Warren, McGeoch and Chown2003) also observed under- and over-estimations of species abundances.
A few specimens collected were extremely difficult to identify. This might be due to high variation within species or hybridization between species. Although hybridization is considered to be rare in carabid beetles, evidence of hybridization has been found both in nature (Imura, Reference Imura1989; Mossakowski et al., Reference Mossakowski, Braun and Roschen1990; Sota et al., Reference Sota, Kusumoto and Kubota2000; Obydov, Reference Obydov2001; Veyrier et al., Reference Veyrier, Audiot, Meusnier and Brouat2005) and under laboratory conditions (Sota et al., Reference Sota, Kusumoto and Kubota2000). Hybridization has not been observed among tropical carabids, but I see it as possible. Breeding tests in the laboratory can test this most reliably.
Although collecting was conducted round the year, most collections were done during February–March. This may have affected the results, so that species abundant in that part of the year were represented more than species abundant at other times of the year. Seasonal variation of carabids has been noticed in many studies (Lövei and Sunderland, Reference Lövei and Sunderland1996; Rainio, Reference Rainio2009; Vennila and Rajagopal, Reference Vennila and Rajagopal2003). Results might also be biased because some sites were studied more thoroughly, and species inhabiting those sites would be better represented than species inhabiting sites visited only once or a few times.
Most of the species appear to be arboreal, collected from trees and bushes among dead leaves. Forest is the most important habitat, with 70% of the species found only in that habitat type. Stork (Reference Stork1987) suggested that adaptations for living in trees have provided greater opportunity for occupying new microhabitats, and hence, for more species to evolve in the arboreal realm than living only in a ground layer. However, there were also species collected only from the ground (e.g. inside the rotting logs on the forest floor).
For a species, low abundance and narrow distribution range increase the extinction risk (Gilpin and Soulé, Reference Gilpin, Soulé and Soulé1986; Gaston, Reference Gaston1994), especially when its natural habitat is threatened. Due to deforestation, many populations become more isolated, which further increases the risk of extinction. Also, outside the protected area of Ranomafana, the habitat is severely degraded due to intense human pressures (Wright and Andriamihaja, Reference Wright, Andriamihaja, Goodman and Benstead2003). Continued management and protection of the forest habitats in RNP is, therefore, crucial for the survival of any endemic species that occur there.
Acknowledgements
I am profoundly grateful to François Ratalata, who has collected most of the data for this project. I thank Outi Ovaskainen and Tahiana Randriamanaitra for assisting in the field work, and Jari Niemelä, Ilkka Hanski, David Kavanaugh, Katja Matveinen-Husu, Wolfgang Lorenz and one anonymous referee for many valuable comments on the manuscript. I also thank David Kavanaugh, Thierry Deuve, Achille Casale and Jirí Moravec for identification of specimens. This study was financed by the Academy of Finland (project no. 50813).