


Introduction
Glaciological and climatological studies of the Greenland ice sheet are an important part of the research on the role of the cryosphere in global change (e.g. Reference Oeschger and LangwayOeschger and Langway, 1989; Reference Ohmura, Wild and BengtssonOhmura and others, 1996). Modeling is one of the principal contributions to these studies, and the usefulness of the findings is dependent on the reliability of the datasets used for particular variables. In this study, we present the spatial distribution of the mean annual surface mass balance. Surface mass balance is defined as the difference between the sum of the mass-gain processes, including precipitation, condensation, vapor-to-solid sublimation, deposition of blowing snow, and freezing of rain or surface runoff as superimposed ice, and the sum of the mass-loss processes, including evaporation, sublimation, surface-melt runoff and snow deflation (removal by wind). In the accumulation zone where the surface mass balance is positive, the surface balance is usually called the net accumulation rate. In the ablation zone where the surface mass balance is negative, the surface balance is usually called the net ablation rate.
The surface mass balance is determined for gridpoint locations with 50 km spacing (Fig. 1; N = 682, where N is the number of gridpoints in a dataset). The gridpoint locations correspond to the intersection of gridlines and grid-columns that are, respectively, normal and parallel to the 45° W meridian. The point of origin for line spacing is the North Pole. Latitude and longitude for each gridpoint are determined for a polar stereographic projection with standard line at 71° N. Each location is centered on a 50 km × 50 km grid square with a nominal area of 2500 km2, and true grid areas are calculated with a latitude-dependent scale factor derived for the projection (Reference PintherPinther, 1975).
Schematic distribution of ice-sheet zones of diagenetic snowfacies and the surface balance. In the dry-snow and upper percolation zones for N = 443 points, the balance is determined with a microwave-emissivity accumulation model and satellite measurements of emissvity (Reference Zwally and GiovinettoZwally and Giovinetto, 1995). For N = 62 gridpoints in the ablation zone (seaward of the equilibrium line), the balance is calculated as function of elevation and latitude (Reference BraithwaiteBraithwaite, 1980). The balance for N = 177points in between these areas is obtained from a compilation of field data ( Reference Ohmura and ReehOhmura and Reeh, 1991), modified by simple linear interpolation to have values of zero at the equilibrium line.
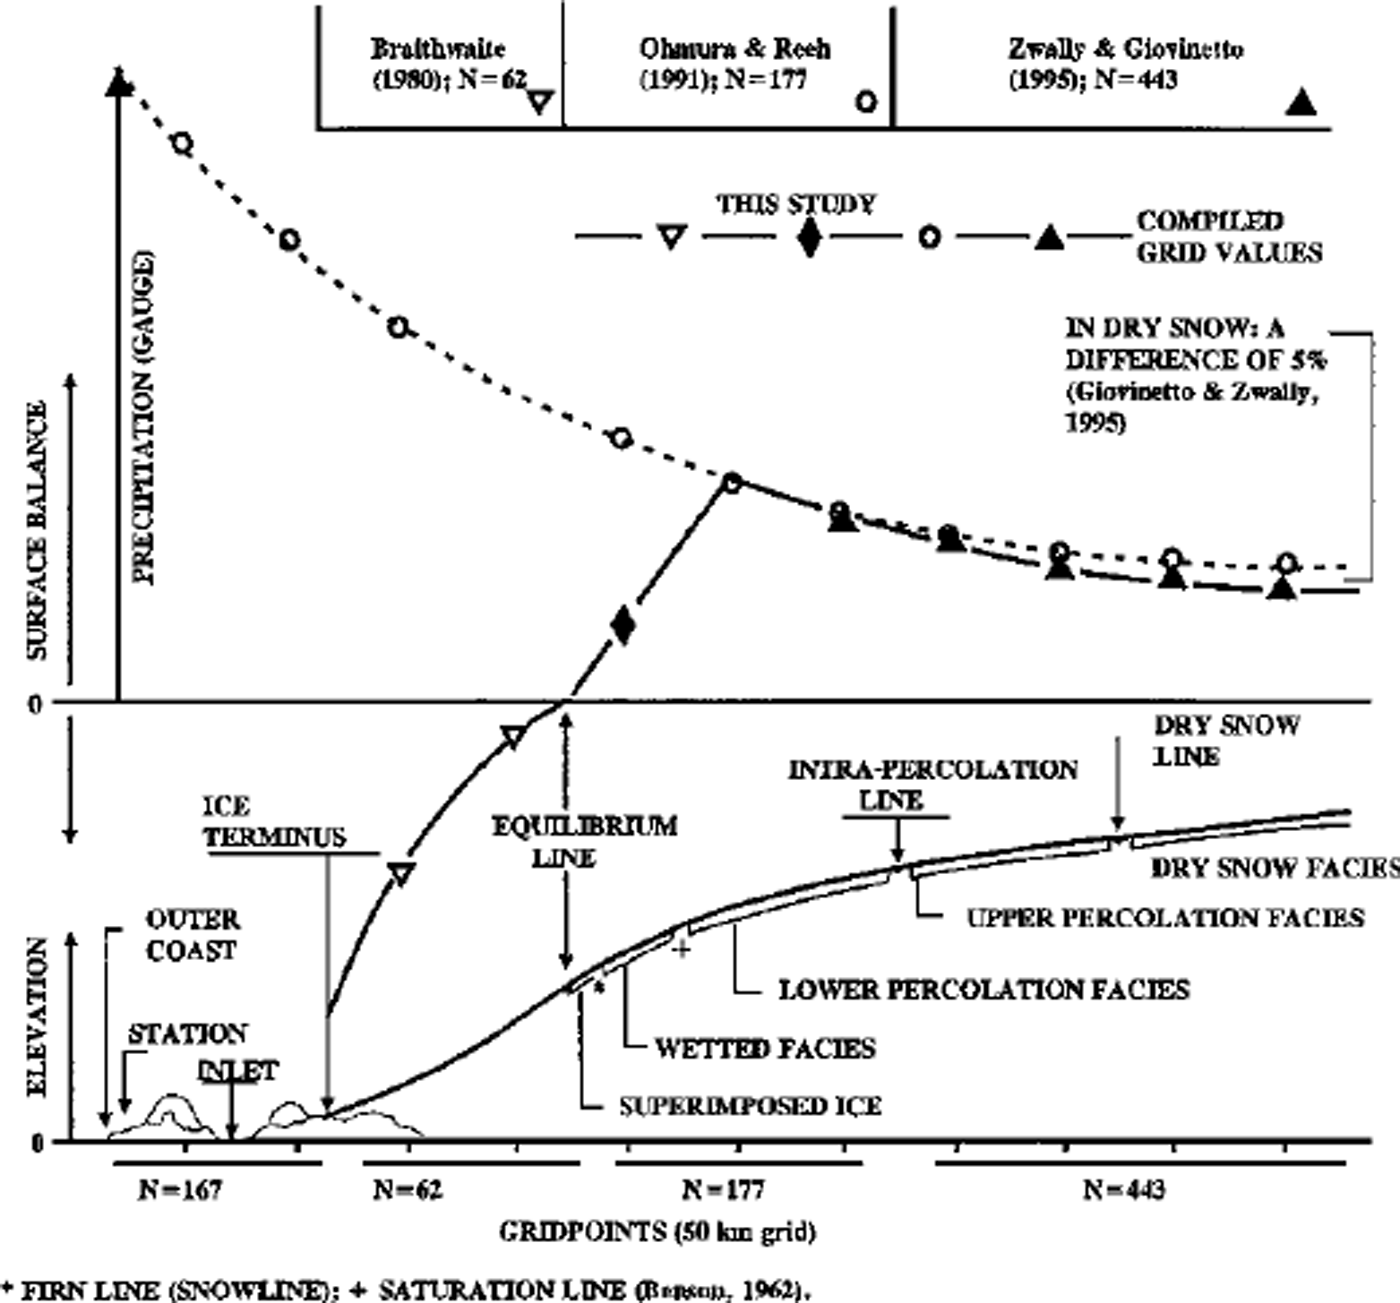
The conterminous area of Greenland, excluding islands not attached by ice to the mainland, is fully sampled by 849 gridpoints. Of these, 682 points are on the conterminous ice sheet. The other 167 points are on exposed rock and ice caps not attached to the ice sheet and also excluded from the ice-sheet analysis (Fig. 2). The locations are categorized from plots of the peripheral gridpoints on the latest coastline and ice-termini map (Reference WeidickWeidick, 1995; 1:2.5 × 10⁶; Universal Transverse Mercator projection zone 24; central meridian 39° W).
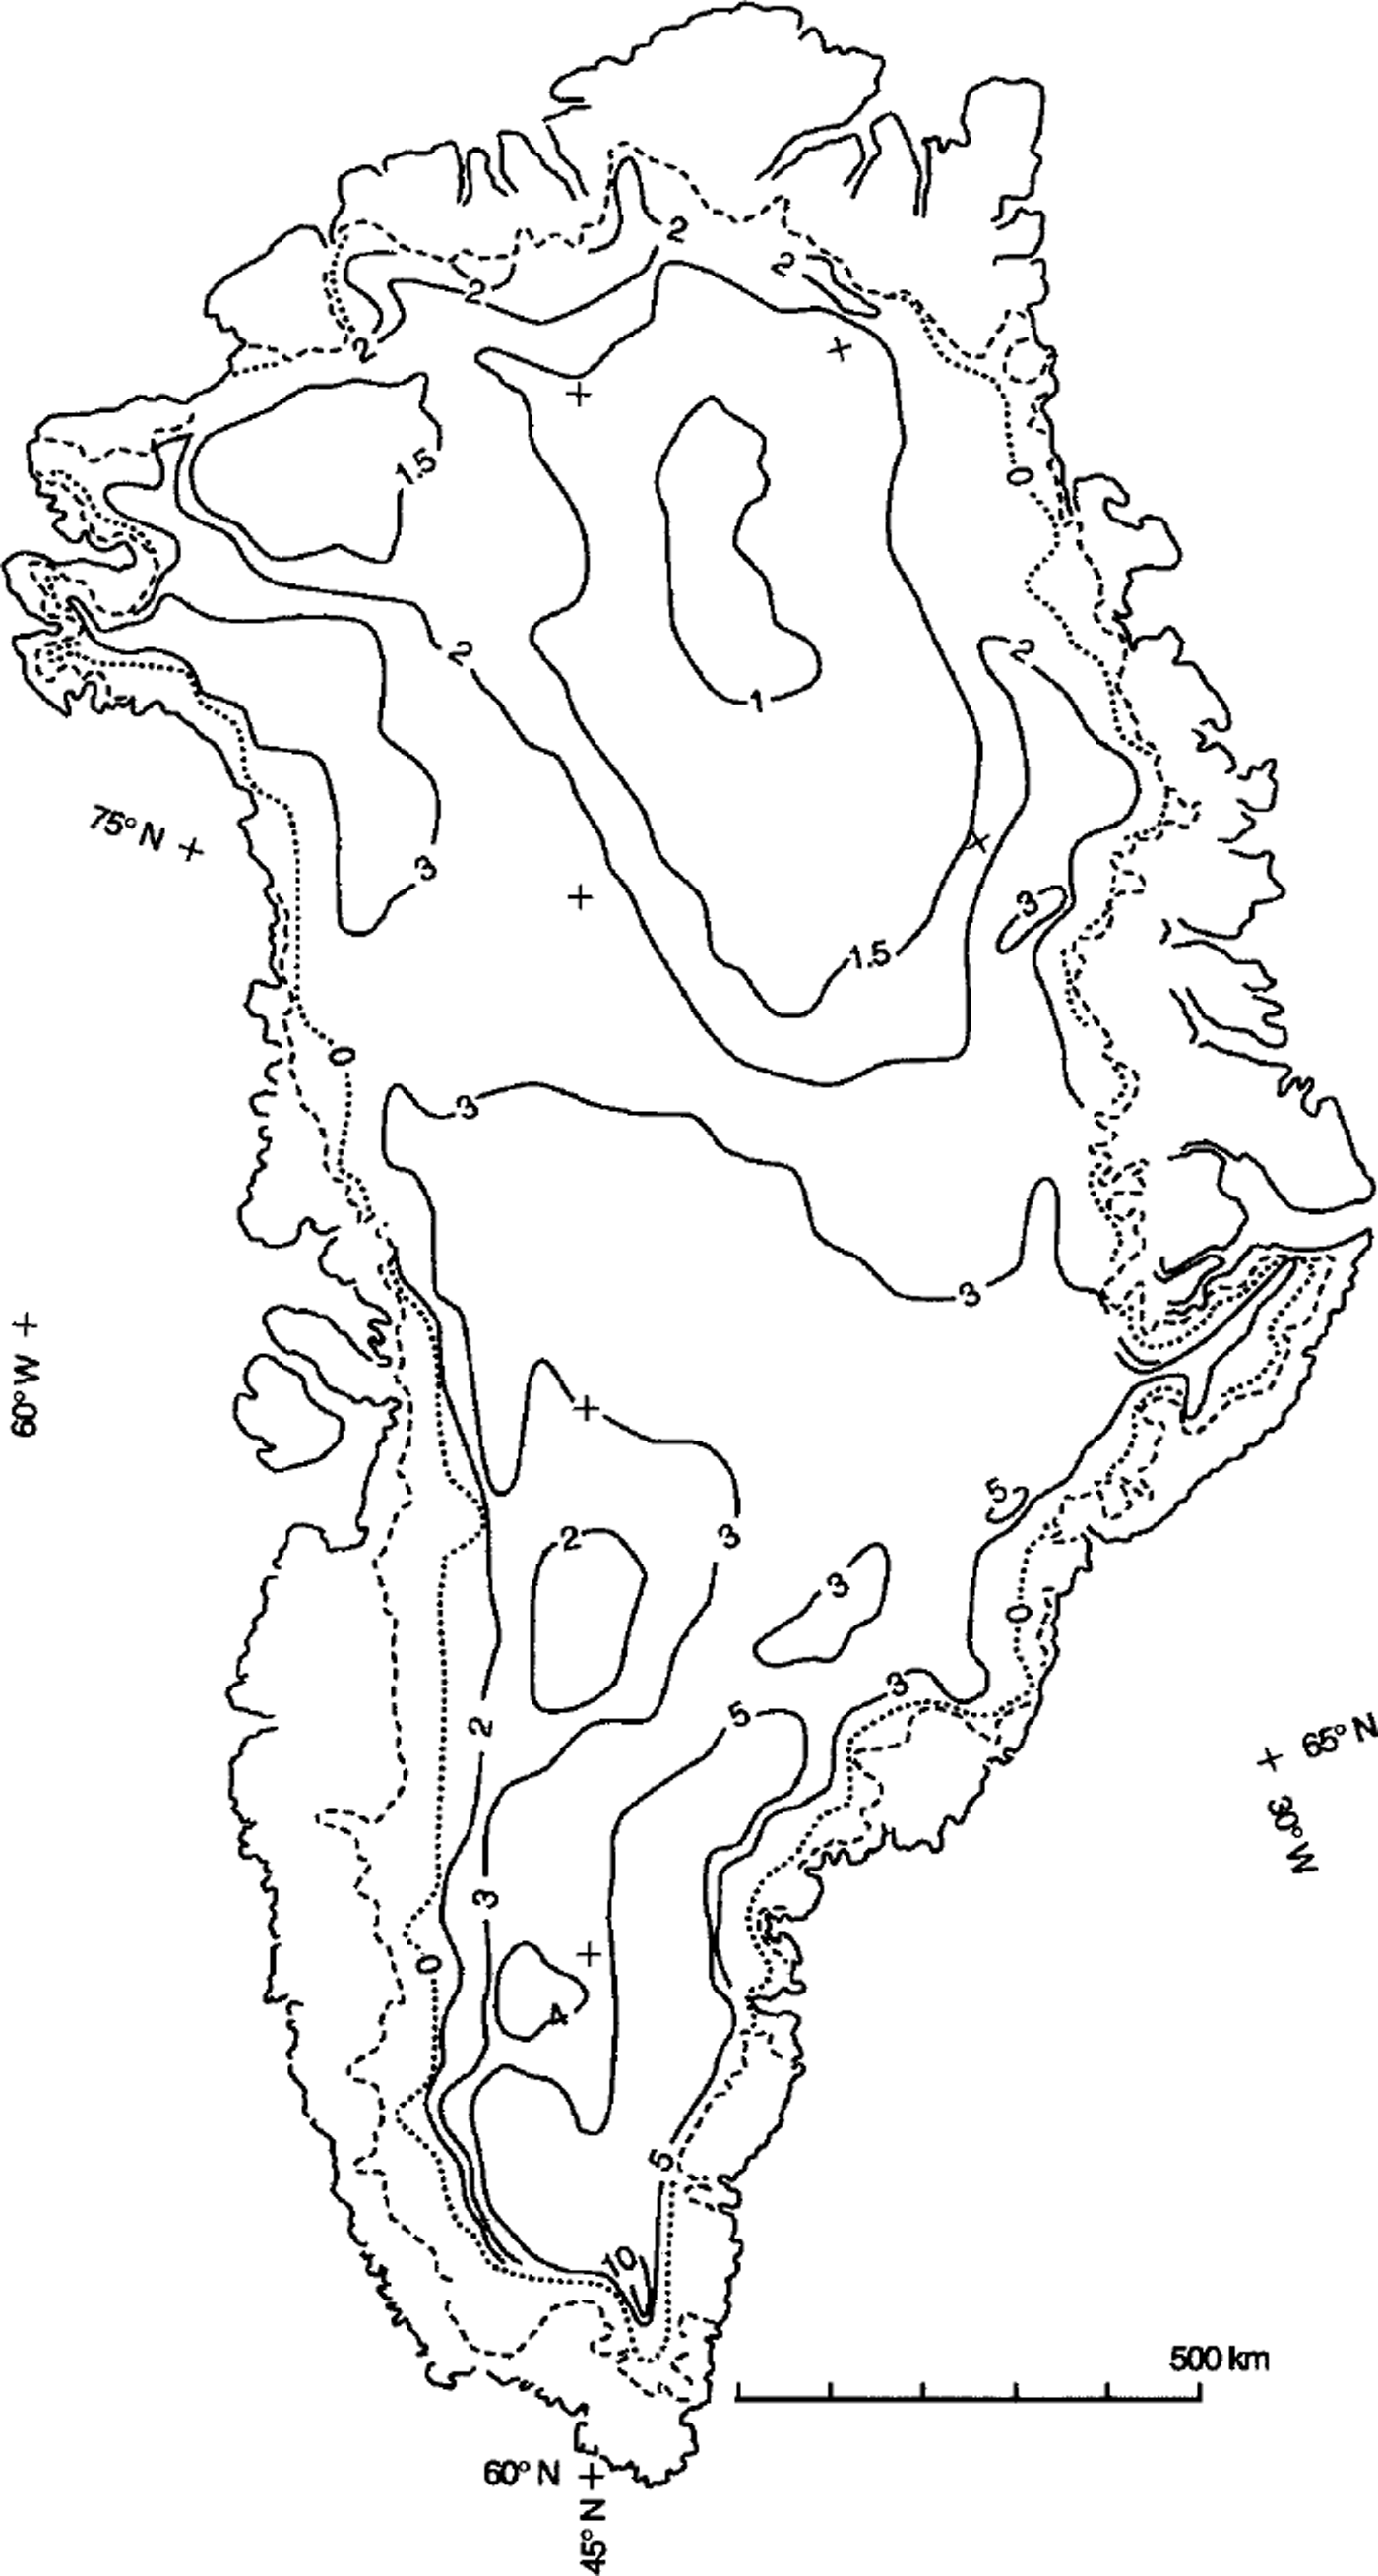
Distribution of surface mass balance on the 50 km grid points (N = 682) of the conterminous Greenland ice sheet.

The ice-sheet dataset is delineated on the basis of zonation ofdiagenetic snow fades (e.g. Reference BensonBenson, 1962) (Fig. l).The three principal indicators for the zone delineation are combinations of at least two of the following: surface elevation, mean annual surface temperature and latitude. The surface elevation for each gridpoint is obtained by bilinear interpolation from the European remote-sensing satellite (ERS-1) radar altimeter elevation maps (Reference Zwally, Brenner and FuZwally and Brenner, 1999). The mean annual surface temperature for each gridpoint is obtained by bilinear interpolation from the Nimbus 7 temperature humidity infrared radiometer (THIR) database for 1979 (Reference ComisoComiso, 1994). Since 1979 is the only full year of THIR data analyzed, its variability relative to other years is not known. However, in another analysis using a 100 km grid database for the conterminous ice sheet (N = 187), we found that the THIR temperatures (Ta’79, in K) strongly correlated with the mean annual surface temperature (Taf, in K) that was visually interpolated to gridpoints from an isotherm map drawn by Reference OhmuraOhmura (1987). The isotherms were drawn on the basis of data for 27 coastal and 20 interior stations, standardized for the period 1951–60 and interpolated on the basis of latitude and elevation using three lapse-rate determinations for latitudes of 65°, 70° and 75° N. The data for two stations on the ice sheet, as well as firn-tem-perature measurements at 10 m depth, were used for evaluation of the isotherms, but not in the production of the isotherm maps. It should be noted that the use of firn temperatures to draw annual isotherms is limited to the areas of dry snow and upper percolation fades, or approximately one-half the area of the ice sheet (N = 98 in the 100 km grid). Our correlation between Ta’79 and Taf was: correlation coefficient, R = 0.949; root-mean-square residual, rms = 1.8 K; mean of temperature residual (Taf-Ta’79) = 1.0 K; standard deviation, SD = 2.7 K).
Surface Mass-Balance Distribution
Our new surface balance dataset for the 50 km grid (N = 682) is first compiled in digitized format (Fig. 2) and then contoured (Fig. 3). In the dry-snow zone and the area of upper percolation fades (N = 443 total), the balance rate is calculated as a function of firn emissivity (Reference ZwallyZwally, 1977) using a model developed for Greenland (Reference Zwally and GiovinettoZwally and Giovinetto, 1995). The coefficients in the model were determined using field data for 89 sites in the areas of dry snow, in effect calibrating the model to the field data. The firn emissivities are calculated from the mean annual surface temperature and brightness temperatures obtained, respectively, from the Nimbus 7 THIR database for 1979 (Reference ComisoComiso, 1994) already mentioned and by bilinear interpolation from the Nimbus 5 electrically scanning microwave radiometer (ESMR) database for 1973–76 (Reference Parkinson, Comiso, Zwally, Cavalieri, Gloersen and CampbellParkinson and others, 1987). A robust correlation between the balance values derived from the emissivity model and the field data in the area of dry snow (R = 0.891; rms=36kgm–2a–1 ; Reference Zwally and GiovinettoZwally and Giovinetto, 1995) is also reliable in large parts of the area of upper percolation. The location of the dry-snow line and of the intra-percolation line are inferred, with minor modifications, from the fades zonation described by Reference BensonBenson (1962) as function of elevation and latitude.
Contoured distribution of surface mass balance on the Greenland ice sheet, showing the outer coastline, the ice-sheet terminus (dashed line) and the balance isopleths labeled in 100 kg m–2a–1 . The location of the equilibrium line (dotted line) is drawn to indicate relative difference in the width of the zone of net ablation rather than exact location of the line.
Ablation is calculated as a function of elevation and latitude with a model that was developed on the basis of data from West Greenland (Reference BraithwaiteBraithwaite, 1980; also shown in Reference WeidickWeidick, 1995), giving minimum rates of net ablation for points (N = 62) below the elevation of the equilibrium line. We do not attempt to modify the model for the known differences that exist in ablation (for the same elevation and latitude) between East and West Greenland (e.g. Reference ReehReeh, 1985; Reference WeidickWeidick, 1995). The ablation model represents the net annual mass loss, which implicitly includes the melting of all the snow accumulated during winter as well as a net melting of surface ice during summer. The location of the equilibrium line on any part of the grid is determined from summaries available in the literature, which indicate close to a linear change from 300ma.s.l. at 82° N to 1800ma.s.l. at 61° N (Reference Giovinetto and ZwallyGiovinetto and Zwally, 1996).
The remaining gridpoint locations (N = 177) lie on the area between the equilibrium line and the intra-percolation line. This area, which includes the zones of upper percolation and wetted fades as well as of superimposed ice, is referred to herein as the zone of intra-percolation fades. For the lower percolation zone, we obtain surface-balance values by visual interpolation from the isopleth pattern drawn on the basis of field data (Reference Ohmura and ReehOhmura and Reeh, 1991; N = 177). The values for approximately one-third of the locations were modified by linear interpolation that is forced to a balance of 0 kg m–2a–16 at the equilibrium line. However, this is an approximation, because spatial changes of the rate are not necessarily linear (eg. Reference MockMock, 1967; Reference BraithwaiteBraithwaite, 1980), particularly on either side of the equilibrium line.
The descriptive statistics for the new balance dataset are listed in Table 1, as well as a summary of the derived mean balance estimates, principally a mean balance of 263 kg m–2 a"1 for the accumulation zone (area above the equilibrium line) and a mean balance of (-) 1259 kg m–2 a–1 1 for the ablation zone (area between the equilibrium line and the ice terminus). The mean balance for the conterminous ice sheet is 128 kg m–2 a–16 1 . The implications of the new balance estimates are discussed in the following section.
The new balance values supersede previous values obtained with a similar approach (Reference Giovinetto and ZwallyGiovinetto and Zwally 1996), but with the following changes in procedure:
use of a 50 km grid database (vs a 100 km grid database)
use of the area scale factor to adjust for deformation in the map projection (vs use of the nominal grid square area)
use of the emissivity model (Reference Zwally and GiovinettoZwally and Giovinetto, 1995) for the area bound by the intra-percolation line (vs the dry-snow line)
use of the ablation model (Reference BraithwaiteBraithwaite, 1980) for the area seaward of the equilibrium line (vs no estimate for that area)
use of interpolated values from the compilation of Reference Ohmura and ReehOhmura and Reeh (1991) for the zone of lower percolation facies (vs the zones of upper percolation as well as lower percolation facies)
adjustment of values interpolated from Reference Ohmura and ReehOhmura and Reeh (1991) for locations close to the equilibrium line to fit a linear change of the rate and a value of 0 kg m–2 a–16 1 at the equilibrium line (vs a cross-board reduction of one-eighth of the balance rate applied to all locations close to the equilibrium line).
Surface-balance dataset (50 km grid)
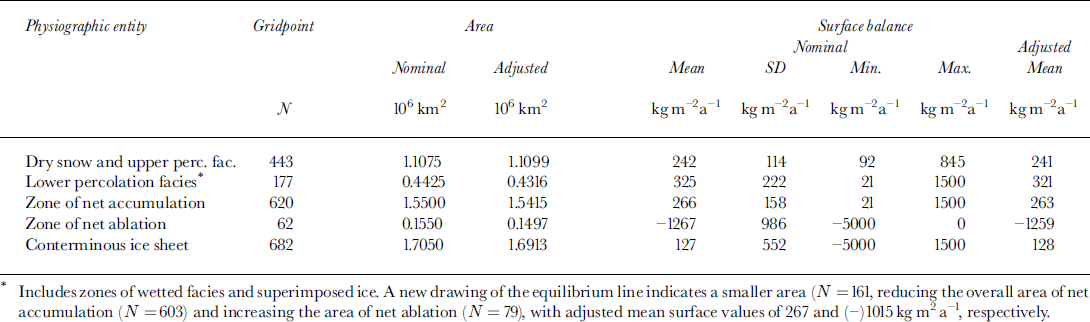
These changes introduce differences in balance values for particular locations on the order of 100 kgm–2a–1 1 , but only a small reduction (–10 kg m–2 a–16 ) in the mean balance over the accumulation zone. The previous value was at 273 kg m–2 a–11 for a nominal area of 1.58 × 10⁶ km2 or 431 Gt a"1 total.
Visually interpolated isopleths were drawn on the basis of grid balance values to show the distribution as a continuous surface, particularly along the coastal zone, on either side of the equilibrium line (Fig. 3). Visual interpolation and manual drawing are required because contouring algorithms are not sufficiently sensitive to the combination of a coarse-grid dataset and the steep gradient of the balance rate in the coastal zone.
Comparison of Results
We compare the surface balance distribution with two preceding distributions. One previous distribution, by Reference Radok, Barry, Jenssen, Keen, Kiladis and MclnnesRadok and others (1982), used models in a manner analogous to our approach. The other distribution, by Reference Ohmura and ReehOhmura and Reeh (1991), was based on visual interpolation of field data. Profiles of the surface balances from these three balance distributions along five east-west profiles are shown in Figure 4.
Surface mass-balance profiles across the Greenland ice sheet based on 50 km gridlines perpendicular to the 45° W meridian (abscissa, 0 km; distances in 100 km West (signed negative) and East) at latitudes of (a) 78.94° N, (b) 75.75° N, (c) 71.67° N, (d) 68.98° N and (e) 64.10° K Balance profiles (left ordinate in l00 kg m–2a–1– ) from this study (thick solid line), Reference Radok, Barry, Jenssen, Keen, Kiladis and MclnnesRadok and others (1982) (dashed line) and Reference Ohmura and ReehOhmura and Reeh (1991) (dotted line). Surface elevation profiles (right ordinate in km) (thin solid line) are from elevation maps from ERS-1 radar altimetry.

Our isopleth pattern, as well as the magnitude of the balance values, agrees in general with the pattern produced by Reference Ohmura and ReehOhmura and Reeh (1991) over most of the interior of the ice sheet. However, the isopleth values along the peripheral area, extending approximately 200 km inland from the ice terminus, show a large disparity, mainly because we show surface balance, whereas Reference Ohmura and ReehOhmura and Reeh (1991) show gross accumulation (cf. Fig. 1). Because balance and gross accumulation are two distinct variables, our comparison with the isopleth pattern of Reference Ohmura and ReehOhmura and Reeh (1991) (full circles in Fig. 4) is limited to a distance of approximately 50–100 km inland from the equilibrium line. The eastern and western ends of each balance profile for Ohmura and Reeh correspond mostly to locations on the lower percolation. The relatively large disparity between balance values for the cross-section at 68.98° N (Fig. 4d) may have a number of causes, including errors inherent in the field and remotely sensed datasets and their interpretations. Moreover, natural temporal variations cannot be discounted. For the remotely sensed data, variations in the temperature field for 1979 or in melting-freezing phenomena at or near the surface in the few years prior to or during collection of the ESMR data (1973–76) could be factors. For interpolations of field data, the use of data representing various short periods of time could be a factor in the differences.
Our isopleth pattern is also in general agreement with the pattern produced by Reference Radok, Barry, Jenssen, Keen, Kiladis and MclnnesRadok and others (1982). However, their values in the interior are approximately 50% larger than ours. This difference is not readily evident on the profiles in Figure 4, except along the western coastal region, but it is evident in a comparison of estimates of surface balance obtained from the distributions (Table 2). Reference Radok, Barry, Jenssen, Keen, Kiladis and MclnnesRadok and others (1982) used the field data available at the time, but relied on models to derive the grid values for the areas of net accumulation and net ablation (respectively, the models developed by Reference MockMock (1967) and by Reference Budd and SmithBudd and Smith (1981)).
Surface-balance terms
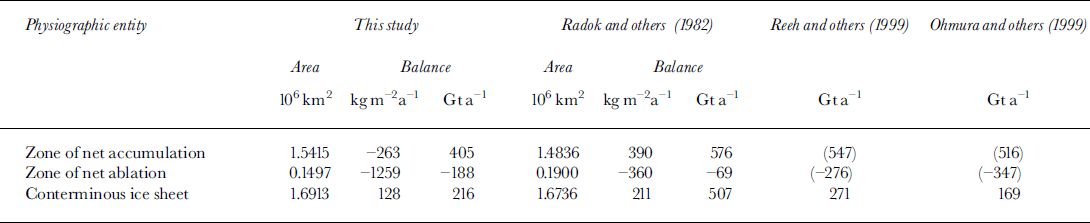
For comparison, we selected the estimates made by Reference Radok, Barry, Jenssen, Keen, Kiladis and MclnnesRadok and others (1982) that separated the areas of net accumulation and net ablation at the equilibrium line, as we have. Their separation gave 89% accumulation area and 11 % ablation area (ratio of 8:1). Although similar to our values of 91 % and 9% (ratio of 10:1), the respective ablation areas differ by 20%. Their other estimate that separated the areas at the saturation line gave 75% accumulation and 25% ablation. The difference in the total area of the conterminous ice sheet used in the balance estimates contributes little to the overall difference. The main factors are the difference between the accumulation/ablation-area ratio (8:1 vs 10:1) and the disparity in the mean rates of ablation. Our ablation estimate of –188 Gt a"1 is 172% larger than their –69 Gta–1–, whereas our accumulation estimate of 405 Gt a–1 is only 30% smaller than their 576 Gt a–1.
Since this study and Reference Radok, Barry, Jenssen, Keen, Kiladis and MclnnesRadok and others (1982) split the accumulation and ablation zones at the equilibrium line, columns 2–6 inTable 2 can be compared for all terms. However, the balance terms listed for Reference Ohmura, Calanca, Wild and AnklinOhmura and others (1999) and Reference Reeh, Mayer, Miller, Thomsen and WeidickReeh and others (1999) are not defined by a split at the equilibrium line. Thus, the balance estimates for the conterminous ice sheet are directly comparable across the table, but the separate estimates of accumulation and ablation are not. Therefore, the accumulation and ablation terms listed in the last two columns are shown in parentheses.
Our estimate of surface balance for the whole area of the conterminous ice sheet (216 Gta–1) is 57% smaller than an estimate of Reference Radok, Barry, Jenssen, Keen, Kiladis and MclnnesRadok and others (1982) (507 Gta–1), and 20% smaller than the estimate of Reference Reeh, Mayer, Miller, Thomsen and WeidickReeh and others (1999) (271 Gt a–1). In contrast, it is 28% larger than the 169 Gt a"1 estimate of Reference Ohmura, Calanca, Wild and AnklinOhmura and others (1999). The difference between our overall estimate and Reference Reeh, Mayer, Miller, Thomsen and WeidickReeh and others’ (1999) is –55 Gta–1, and between ours and Reference Ohmura, Calanca, Wild and AnklinOhmura and others’ (1999) +47 Gta–1. Both of these differences are approximately within the composite variation of previous estimates of ±50 Gta–1, which is appropriate for comparing two balance estimates. This composite variation of estimates is calculated from the variation of estimates of accumulation (±20 Gta–1) and of ablation (±30Gta–1 ) reported during the last two decades (referenced in this and the following section), but excluding the findings of this study and of the study by Reference Radok, Barry, Jenssen, Keen, Kiladis and MclnnesRadok and others (1982)). Including the accumulation and ablation terms from our study and from Reference Radok, Barry, Jenssen, Keen, Kiladis and MclnnesRadok and others (1982) would artificially increase the calculated variations, because of the aforementioned differences in defining the accumulation and ablation terms. In the other studies, the accumulation estimates are for the whole area of the ice sheet, combining estimates of net accumulation for the interior and of gross accumulation for the area coastal zone. The other estimates of ablation are the gross ablation for the coastal zone. The resulting composite variation is approximately ±35Gta–1 for any one particular balance estimate, and approximately ±50Gta–1 for the difference between any two surface balance estimates.
Concluding Remarks
Substantial differences in the various estimates of surface balance for Greenland are introduced, primarily by differences in the delineation of the equilibrium line that determines the division of areas of net accumulation and net ablation, as well as in the models used to assess ablation. Secondary differences are introduced by differences in the models used to obtain accumulation, and in the criteria used for the interpolation of field data. Our microwave emissivity model for accumulation, which is calibrated to field data, has provided in effect an improved method of interpolating field data and for extrapolation into areas of sparse data. Whereas our balance estimate for the accumulation zone (263 kg m–2 a–16 1 ) is within 33% of the estimate by Reference Radok, Barry, Jenssen, Keen, Kiladis and MclnnesRadok and others (1982) (390 kg m–2a–1 ) obtained using the multivariate models described by Reference MockMock (1967), comparison suggests that the ablation model of Reference BraithwaiteBraithwaite (1980) produces larger ablation values than the model of Reference Budd and SmithBudd and Smith (1981) by a factor of approximately 3.
The differences between our estimate of surface balance and two of the latest estimates (Reference Ohmura, Calanca, Wild and AnklinOhmura and others, 1999; Reference Reeh, Mayer, Miller, Thomsen and WeidickReeh and others, 1999) are approximately within the calculated composite variation of other estimates. On a broader perspective, our surface balance estimate of 216 Gta–1, compared with other estimates in which assessments of both accumulation and ablation were made by the same author(s) (as opposed to estimates based on combinations of separate assessments of either accumulation or ablation by different authors), shows agreement with the estimates of Reference WeidickWeidick (1985) (215 Gt a–1) and Reference Van de WalVan de Wal (1996) (223 Gt a–1). Except for the estimate of Reference Ohmura, Calanca, Wild and AnklinOhmura and others (1999) (169 Gta–1), our estimate is smaller than the estimates of Reference Radok, Barry, Jenssen, Keen, Kiladis and MclnnesRadok and others (1982) (507 Gta–1), Reference Huybrechts, Letréguilly and ReehHuybrechts and others (1991) (283 Gt a–1), Reference Reeh, Mayer, Miller, Thomsen and WeidickReeh and others (1999) (271 Gta–1) and Reference Janssens and HuybrechtsJanssens and Huybrechts (2000) (261 Gta–1). Thus, its use in mass-budget studies, which also require estimates of ice discharge into the ocean, would reduce the resulting mass-budget estimates. For example, substituting our accumulation estimate in the latest budget estimate of Reference Reeh, Mayer, Miller, Thomsen and WeidickReeh and others (1999) would change their findings from a mass balance near zero (i.e. equilibrium) to a negative balance of 55 Gt a–1, suggesting a positive contribution of the Greenland ice sheet to sea-level change of 0.15 mm a"1.
Acknowledgements
The authors acknowledge the contributions of S. Bhardwaj, M. Beckley, M. Cheng, G. Conrad, J. DiMarzio, S. Fiegles and J. Saba.



